916 Windsor Rd · Windsor, SC
Flood risk 4/10 · Minor
- FEMA flood zone
- X (unshaded)
- Chance of flooding over 30 yrs
- 0.22%
- Est. flood insurance / yr
- $507 – $1,088
Fire risk 7/10 · Major
- Est. fire insurance / yr
- $783 – $1,453
Heat risk 7/10 · Major
- Hot days now (above 108°F)
- 7 days/yr
- Hot days in 30 yrs
- 17 days/yr
Wind risk 8/10 · Major
- Chance of severe wind over 30 yrs
- 80.0%
Air-quality risk 3/10 · Minor
- Unhealthy air days now
- 3 days/yr
- Unhealthy air days in 30 yrs
- 3 days/yr
Risk factors via First Street. Map © Google.
Why this score? — see what drove the B grade
The composite is a weighted blend of 9 inputs, each scored 0–100. Each bar is that input's sub-score; the figure is the points it added to the 100-point composite (weight × sub-score).
- Cash flow +30.0/30.0
- 1% rule +10.0/10.0
- DSCR +10.0/10.0
- ARV discount +7.5/15.0
- Appreciation +5.0/10.0
- Schools +3.2/10.0
- Livability +2.7/5.0
- Rent growth +2.5/5.0
- Condition / age +2.5/5.0
$69,000
🖨 Deal sheet 📄 Offer letter ✓ Due diligence
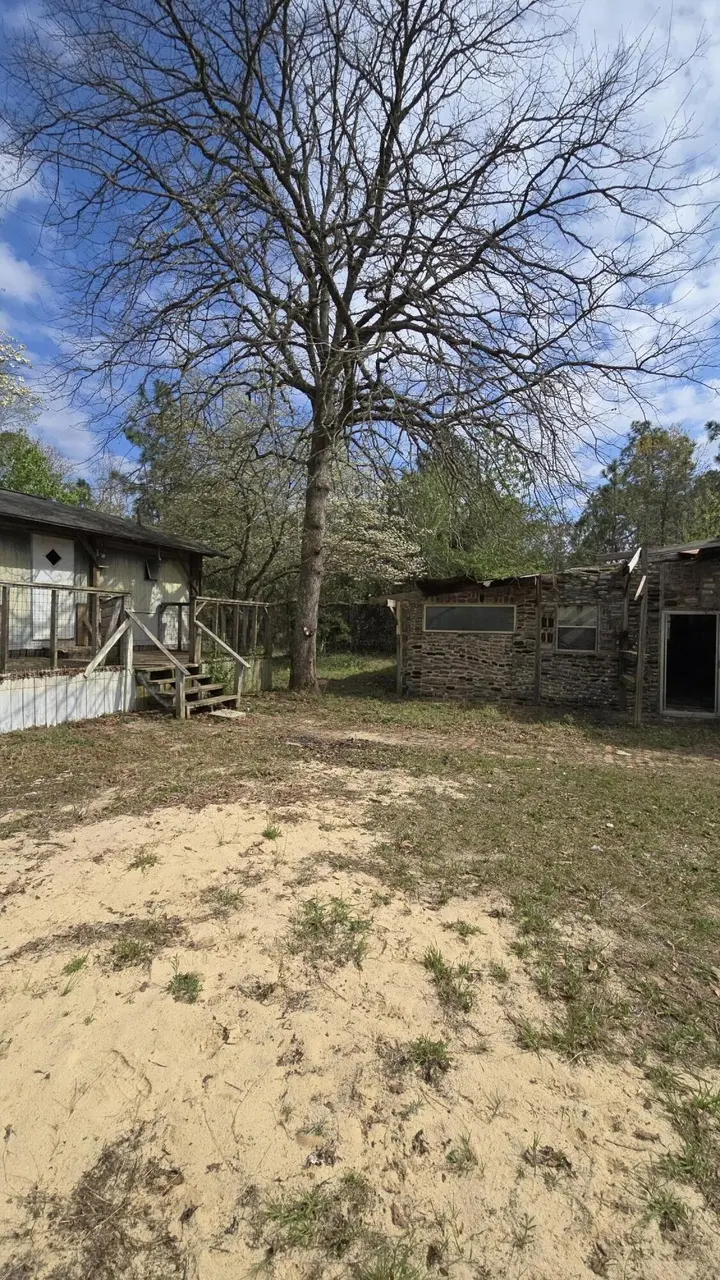
Listing remarks
This lovely, natural property is tucked away at the end of a long, private drive, offering a peaceful retreat surrounded by nature. (Make Sure to go all the way to back of this property) Spring is currently putting on a show with budding trees and a canopy of beautiful wisteria. For nature lovers, the frequent presence of deer provides a serene, woodland backdrop to your morning coffee. Improvements & Features include the acreage being equipped with functional footprints ready for your vision: Barn/Equipment Building: A 576-sqft structure (built in 1983) offers a solid starting point for a workshop, tack room, or storage, though it is in need of some sweat equity. A whimsical, one-o
Key facts
- 2 acre lot
- Built 1983
- Listed 84 days
Property features AI
Exterior
- Parking: No parking
- Utilities: Private well water; Septic tank
- Home design: One-level manufactured home on land; Residential property
- Construction: Construction details: see remarks; Foundation details: see remarks; Roof: see remarks; Located on 2 acres; Wooded lot; Road surface: dirt
- Exterior features: No exterior features listed; Patio/porch: none
Interior
- Kitchen: No appliances listed
- Flooring: Flooring: see remarks
- Heating & cooling: Has heating; Heating details: see remarks
- Interior features: Interior features: see remarks; Total rooms: 2
Neighborhood map
What this means for you Summary
Snapshot
- This is a 1-bed/?-bath manufactured listed at $69k.
Deal economics
- At list price, monthly cash flow is $613 ($7k/yr) — positive.
- The deal already cash-flows at list — no discount required.
- Meets the 1% rule at list price ($1k rent vs $69k).
- Recommended offer: $65k (6.0% below list) — sets the bar for market timing.
Location & tenants
- Location reads 53/100 on livability (#333 in SC) — a working-class tenant base; expect higher turnover. Strengths: cost of living A+, crime A, housing B; Watch: schools F, amenities F, commute F.
- Aiken 01 (suburban): math 31% / reading 44% proficiency, ranked #36 of 80 in SC (top 45%) — families likely to look elsewhere, expect single-tenant / working-renter base with shorter leases.
- Market conditions: 25 active listings in the ZIP; 2,500 units permitted in Aiken County in 2024 (1,023 in 5+ unit buildings).
Forward outlook
- In year one you build about $439 of equity ($477 loan paydown + $-38 appreciation (-0.1% local appreciation)).
- Aiken County population projected at +9% by 2050 — modest demand growth; plan on rents tracking national, not racing it.
- At projected returns (-0.1% appreciation + 3.0% rent growth), your $19k cash investment doubles in ~3 years — after that, you're playing with house money.
Negotiation context
- It's been on market 84 days — a 6% lower offer ($65k) is reasonable based on typical stale-listing flexibility.
Risks & watch-outs
- Climate carrying-cost: severe wind risk, 80% chance of damaging wind over 30y; major wildfire risk; extreme-heat days projected 7→17/yr by 2055 (HVAC capex compounding) — expect insurance premiums to compound above CPI over the hold.
Questions for the listing agent
- It's been on market 84 days. Have you received any prior offers? Is the seller open to a 6% concession, seller financing, or rate buy-down credit?
- Why hasn't it sold? Are there any deal-killer items the seller is aware of (foundation, flood, title, zoning, code violations)?
- Is there a deadline driving the sale (1031 exchange, divorce, estate, relocation)? That informs how much negotiation room exists.
- Schools are F-rated, which usually means shorter tenancies and higher turnover. Who's the typical renter profile here, and what's been the actual vacancy rate?
- What's the average days-on-market for RENTAL listings here right now (not sales)? A rising rental-DOM trend means longer vacancies and softer asking-rent achievability than the comps imply.
- What's the recent tenant-quality profile in this submarket — average credit score on applications, eviction rate, late-payment / NSF rate, and stable-employment percentage? A property-management company in the area should have these aggregated.
- How much new for-sale + rental construction is in the pipeline within 1–3 miles? Heavy new supply typically softens prices + rents 12–24 months out; constrained supply supports both.
Investment metrics
- 1% rule
- 2.00% ✓
- Cap rate
- 16.96%
- Cash-on-cash
- 38.09%
- DSCR
- 2.69
- GRM
- 4.2
CMA / ARV
No comps found within radius.
Projected returns pro-forma
-0.06% appreciation · 3.0% rent growth · sell at horizon
- IRR
- 39.0%
- Equity multiple
- 2.91×
- Total profit
- $36,875
- Equity at exit
- $19,844
- IRR
- 42.1%
- Equity multiple
- 5.73×
- Total profit
- $91,331
- Equity at exit
- $23,700
Cash invested: $19,320 (down + closing). Projections, not guarantees.
Landlord ↔ Tenant lean methodology
- Overall (STATE)
- 90 Strongly Landlord-Friendly
- State South Carolina
- 90 Strongly Landlord-Friendly · R+6
- County
- — inherits STATE
- City
- — inherits STATE
ZIP-level market 29856
- Home prices YoY
- -0.1%
- Active inventory
- 25
- Price-to-rent
- 4.2×
Monthly cashflow live
- Estimated rent
- $1,380 medium interval (Pro) →
- Mortgage (P&I)
- −$362
- Tax est. 1.5%
- −$86 /mo · $1,035/yr
- Insurance
- −$29
- HOA
- −$0
- Vacancy / Maint / Mgmt
- −$290
- Net cashflow
- $613
Break-even live
UW: 25.0% down · 7.5% · 30yr · 1.5% tax · 5.0% vac · 8.0% maint · 8.0% mgmt
Financing live
Cash to close
- Down payment
- $17,250
- Closing costs
- $2,070
- Reserves months
- —
- Total cash needed
- —
Loan-product check · same deal, 3 products live
Conventional
25% down · 7.5% · 30yr
- Down + closing
- —
- Monthly P&I
- —
- Monthly cashflow
- —
- DSCR
- —
- Eligible?
- —
Personal DTI + credit; lowest rate.
DSCR
20% down · 8.5% · 30yr
- Down + closing
- —
- Monthly P&I
- —
- Monthly cashflow
- —
- DSCR
- —
- Eligible?
- —
No personal income docs; deal must DSCR.
Hard money
10% down · 12.0% · 12mo
- Down + closing
- —
- Monthly P&I
- —
- Monthly cashflow
- —
- DSCR
- —
- Eligible?
- —
Short-term bridge; refi at stabilization.
Listing history 17 events
-
2026-06-18days on market $69,000 Active 84 DOM
-
2026-06-17days on market $69,000 Active 83 DOM
-
2026-06-16days on market $69,000 Active 82 DOM
-
2026-06-15days on market $69,000 Active 81 DOM
-
2026-06-14days on market $69,000 Active 79 DOM
-
2026-06-13days on market $69,000 Active 78 DOM
-
2026-06-10days on market $69,000 Active 76 DOM
-
2026-06-09days on market $69,000 Active 75 DOM
-
2026-06-08days on market $69,000 Active 74 DOM
-
2026-06-07days on market $69,000 Active 73 DOM
-
2026-06-03days on market $69,000 Active 69 DOM
-
2026-06-02days on market $69,000 Active 68 DOM
-
2026-06-01days on market $69,000 Active 67 DOM
-
2026-05-31days on market $69,000 Active 66 DOM
-
2026-05-30days on market $69,000 Active 65 DOM
-
2026-05-18price $69,000
-
2026-03-26$73,000 Active
ⓘ Source: listings_history table (triggers on properties + properties_extension) + one-shot
backfill from property_details.listing_events for pre-trigger history.
Climate risk First Street
- Flood 4/10 Moderate FEMA zone X (unshaded) · 22% chance over 30 yrs
- Wildfire 7/10 Severe
- Heat 7/10 Severe 7 d/yr ≥108°F today · 17 d/yr by 30 yrs out
- Wind 8/10 Severe 80% chance of damaging wind over 30 yrs
- Air quality 3/10 Moderate 3 unhealthy d/yr today · 3 by 30 yrs out
Nearby sold comps map
Loading sold comps map…
Walkable amenities ~0.75 mi
Loading nearby amenities…
Taxation est. · year 1
- Rental income
- $16,557
- − Mortgage interest
- −$3,865
- − Property taxes
- −$1,035
- − Insurance
- −$345
- − Repairs & maintenance
- −$1,325
- − Management
- −$1,325
- − Depreciation
- −$2,007
- Taxable income
- $6,656
- Est. tax owed @ 24.0%
- −$1,597
- After-tax cash flow
- $5,761/yr
For passive investors: Depreciation is non-cash, so a rental often shows a tax loss while cash-flowing — sheltering income. Rental losses are passive: they offset passive income freely, and up to $25,000/yr can offset ordinary (W-2) income if you actively participate and your MAGI is under $100k (phasing out to $0 by $150k); unused losses carry forward. On sale, claimed depreciation is recaptured at up to 25%, and gains may owe capital-gains tax (a 1031 exchange can defer both). Figures are a year-1 estimate at your 24.0% rate — not tax advice; consult a CPA.
Schools (NCES district)
- District
- Aiken 01
- NCES district ID
- 4500720
- Math proficiency
- 31% ▼ -11.00%
- Reading proficiency
- 44% ▼ -1.00%
- Median HH income
- $45,081
- Composite
- 31.91/100
- National rank
- #5857
- State rank
- #36 of 80 in SC
Livability — Windsor
- Score
- 53/100
- State rank
- #333
- US rank
- #24250
Category grades
Schools grade is shown separately in the Schools card above.
Census & demographics
- City population
- 3,473
- Population (ZIP)
- 3,473
Population outlook (Aiken County) Hauer SSP2
- Today (2025)
- 178,003 people
- By 2030
- 182,876 · +2.7%
- By 2040
- 189,970 · +6.7%
- By 2050
- 193,840 · +8.9%
- By 2075
- 199,453 · +12.1%
- By 2100
- 192,403 · +8.1%
Race, ethnicity, and origin ACS 2023
- Neighborhood character
- Diverse neighborhood (Simpson 0.70)
- Race & ethnicity
- White 47% Hispanic / Latino 27% Two or more races 20% Black 10% Asian 2%
- Hispanic origin (detail)
- Mexican 19%
- Common ancestry
- Slovak 3% Serbian 2% Lithuanian 1%
- Foreign-born
- 15% · Canada
- Languages at home
- 75% English-only · Spanish 23% Other Indo-European 1% Arabic 1%
Political lean MEDSL · Aiken
- 2024 margin
- Strong R (+25.9) · D 36.4% · R 62.2% · Other 1.4%
- 2008→2024 swing
- -1.9pp toward R · 2008: -24.0pp · 2024: -25.9pp
- All cycles
- 2024: R+25.9 2020: R+22.7 2016: R+27.5 2012: R+26.0 2008: R+24.0
Not yet ingested
- Civics
- —
Market trends
- HPI YoY
- ▼ -0.06%
- Current HPI
- 68.9787
- Rent YoY
- —
- Metro
- —
- State GDP YoY
- ▲ 4.51%
- F500 in state
- 2
Industry mix (Fortune 500 HQ in SC)
| Industry | F500 HQs | Revenue |
|---|---|---|
| Packaging | 1 | $7B |
|
||
Price history
-5.5% since first listed2 events — show timeline
- 2026-05-18 Price Changed $69,000 AMLS
- 2026-03-26 Listed $73,000 AMLS
Property tax history
+7.7%/yrLatest (2025): $129 · +64.9% YoY. Source: county tax records.
Cash-flow waterfall
monthlySold comps — $/sqft
last 12 mo · ≤1 miLoading sold comps…