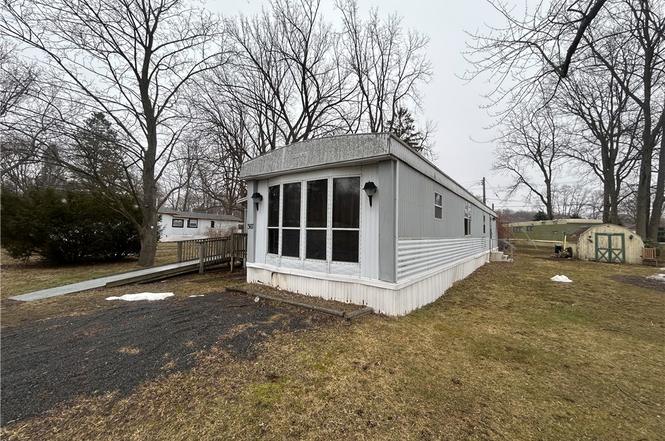
307 Dale Dr · Victor, NY
Flood risk 1/10 · Minimal
- FEMA flood zone
- X
- Chance of flooding over 30 yrs
- 0.0%
- Est. flood insurance / yr
- $507 – $1,088
Fire risk 3/10 · Minor
- Est. fire insurance / yr
- $691 – $1,283
Heat risk 2/10 · Minimal
- Hot days now (above 97°F)
- 7 days/yr
- Hot days in 30 yrs
- 16 days/yr
Wind risk 1/10 · Minimal
- Chance of severe wind over 30 yrs
- —
Air-quality risk 2/10 · Minimal
- Unhealthy air days now
- 0 days/yr
- Unhealthy air days in 30 yrs
- 1 days/yr
Risk factors via First Street. Map © Google.
Why this score? — see what drove the C- grade
The composite is a weighted blend of 9 inputs, each scored 0–100. Each bar is that input's sub-score; the figure is the points it added to the 100-point composite (weight × sub-score).
- Cash flow +15.0/30.0
- ARV discount +15.0/15.0
- Schools +5.2/10.0
- 1% rule +5.0/10.0
- DSCR +5.0/10.0
- Livability +4.0/5.0
- Rent growth +2.5/5.0
- Condition / age +2.5/5.0
- Appreciation +0.0/10.0
$34,900
🖨 Deal sheet (PDF) 📄 Offer letter ✓ Due diligence
Listing remarks
Welcome to 307 Dale Drive, located in the desirable Hunt’s Community. This well-maintained 2-bedroom, 1-bath home offers comfortable, easy living with wheelchair accessibility, making it a great option for those looking for convenience and functionality. The home features a practical layout with bright living spaces, a functional kitchen, and two nicely sized bedrooms. Accessibility features help make daily living easier while still maintaining a warm and inviting feel. Situated in a quiet community setting, this property offers low-maintenance living while still being conveniently located near local amenities, shopping, and dining.
Key facts
- Functional kitchen
- Conveniently located
- Built 1984
Tags
Neighborhood map
What this means for you Summary
Snapshot
- This is a 2-bed/1.0-bath manufactured listed at $35k.
Deal economics
- At list price, monthly cash flow is $1k ($16k/yr) — positive.
- The deal already cash-flows at list — no discount required.
- Meets the 1% rule at list price ($2k rent vs $35k).
- Recommended offer: $32k (9.0% below list) — sets the bar for market timing.
- Cap rate 53.0% vs local median 2.6% in Victor — top-decile yield for the area; either an underpriced asset or a hidden risk that comps aren't pricing in. Stress-test before assuming the spread holds.
Location & tenants
- Location reads 79/100 on livability (#122 in NY, #1,991 nationally) — a middle-class / working-renter tenant base. Strengths: schools A+, employment A+, housing A+; Watch: amenities F, commute F.
- Victor Central School District (suburban): math 56% / reading 62% proficiency, ranked #222 of 590 in NY (top 38%) — acceptable for families but not a draw, mixed tenant base, ~2y average lease; only 12% free/reduced lunch — higher-income household profile.
- Market conditions: 72 active listings in the ZIP; 1 comparable units currently listed for rent nearby; solid renter incomes; 284 units permitted in Ontario County in 2024 (69 in 5+ unit buildings).
Forward outlook
- Local home prices are declining (-3.0%/yr); year-one equity from $241 of loan paydown is wiped out by about $1k of value loss. Plan a longer hold.
- Ontario County population projected to shrink 6% by 2050 — rents likely to lag national; underwrite the cash flow, not the appreciation.
- At projected returns (-3.0% appreciation + 3.0% rent growth), your $10k cash investment doubles in ~1 year — after that, you're playing with house money.
Negotiation context
- It's been on market 93 days — a 9% lower offer ($32k) is reasonable based on typical stale-listing flexibility.
Questions for the listing agent
- It's been on market 93 days. Have you received any prior offers? Is the seller open to a 9% concession, seller financing, or rate buy-down credit?
- Why hasn't it sold? Are there any deal-killer items the seller is aware of (foundation, flood, title, zoning, code violations)?
- Is there a deadline driving the sale (1031 exchange, divorce, estate, relocation)? That informs how much negotiation room exists.
- Schools are A-rated — typically a magnet for longer-tenancy family renters. What's the average tenant stay here, and is there a school-zone premium baked into asking?
- What's the average days-on-market for RENTAL listings here right now (not sales)? A rising rental-DOM trend means longer vacancies and softer asking-rent achievability than the comps imply.
- What's the recent tenant-quality profile in this submarket — average credit score on applications, eviction rate, late-payment / NSF rate, and stable-employment percentage? A property-management company in the area should have these aggregated.
- How much new for-sale + rental construction is in the pipeline within 1–3 miles? Heavy new supply typically softens prices + rents 12–24 months out; constrained supply supports both.
Investment metrics
- 1% rule
- 5.81% ✓
- Cap rate
- 53.03%
- Cash-on-cash
- 166.94%
- DSCR
- 8.43
- GRM
- 1.4
CMA / ARV
- ARV (on-the-fly)
- $69,580
- Comps found
- 10
Show comp detail 10 sales within ~0.75 mi
| Address | Dist | Beds/Ba | Sqft | Sold | Price | $/sf | Match |
|---|---|---|---|---|---|---|---|
| 307 Dale Dr | 0.00mi | 2/1.0 | 980 (0%) | 0mo | $30,000 | $31 | 100 |
| 229 Marlette Dr | 0.12mi | 2/1.0 | 980 (0%) | 21mo | $22,500 | $23 | 77 |
| 118 Hunts Park Rd | 0.06mi | 2/2.0 | 980 (0%) | 22mo | $30,000 | $31 | 75 |
| 6367 Lambert St Unit B100 | 0.36mi | 3/1.0 (+1) | 924 (-6%) | 12mo | $47,000 | $51 | 59 |
| 6374 Lambert St | 0.37mi | 2/2.0 | 1,064 (+9%) | 8mo | $55,000 | $52 | 58 |
| 6382 Murphy Dr | 0.45mi | 3/1.0 (+1) | 896 (-9%) | 8mo | $63,900 | $71 | 53 |
| 6360 Murphy Dr | 0.41mi | 3/2.0 (+1) | 980 (0%) | 24mo | $113,000 | $115 | 52 |
| 6426 Francis Drive # 126 | 0.59mi | 2/2.0 | 1,056 (+8%) | 10mo | $121,220 | $115 | 47 |
| 6376 Murphy Dr | 0.42mi | 3/2.0 (+1) | 840 (-14%) | 15mo | $70,000 | $83 | 35 |
| 996 Gypsum Mills St | 0.34mi | 3/2.0 (+1) | 1,120 (+14%) | 23mo | $100,000 | $89 | 32 |
Match score weights: distance 35% · size 25% · config 20% · recency 20%. Top-matched comps best support the ARV.
Projected returns pro-forma
-3.0% appreciation · 3.0% rent growth · sell at horizon
- IRR
- —
- Equity multiple
- 9.28×
- Total profit
- $80,957
- Equity at exit
- $5,204
- IRR
- —
- Equity multiple
- 19.64×
- Total profit
- $182,107
- Equity at exit
- $3,018
Cash invested: $9,772 (down + closing). Projections, not guarantees.
Landlord ↔ Tenant lean methodology
- Overall (STATE)
- 15 Strongly Tenant-Friendly
- State New York
- 15 Strongly Tenant-Friendly · D+10
- County
- — inherits STATE
- City
- — inherits STATE
ZIP-level market 14425
- Home prices YoY
- -15.1%
- Active inventory
- 72
- Price-to-rent
- 1.4×
Monthly cashflow live
- Estimated rent
- $2,026 medium interval (Pro) →
- Mortgage (P&I)
- −$183
- Tax est. 1.5%
- −$44 /mo · $524/yr
- Insurance
- −$15
- HOA
- −$0
- Vacancy / Maint / Mgmt
- −$425
- Net cashflow
- $1,359
Break-even live
Sensitivity live
| Price | -10% $1,384 | -5% $1,371 | +0% $1,359 | +5% $1,347 | +10% $1,335 |
|---|---|---|---|---|---|
| Rent | -10% $1,199 | -5% $1,279 | +0% $1,359 | +5% $1,439 | +10% $1,519 |
| Rate | -1.0pp $1,377 | -0.5pp $1,368 | base $1,359 | +0.5pp $1,350 | +1.0pp $1,341 |
UW: 25.0% down · 7.5% · 30yr · 1.5% tax · 5.0% vac · 8.0% maint · 8.0% mgmt
Financing live
Cash to close
- Down payment
- $8,725
- Closing costs
- $1,047
- Reserves months
- —
- Total cash needed
- —
Loan-product check · same deal, 3 products live
Conventional
25% down · 7.5% · 30yr
- Down + closing
- —
- Monthly P&I
- —
- Monthly cashflow
- —
- DSCR
- —
- Eligible?
- —
Personal DTI + credit; lowest rate.
DSCR
20% down · 8.5% · 30yr
- Down + closing
- —
- Monthly P&I
- —
- Monthly cashflow
- —
- DSCR
- —
- Eligible?
- —
No personal income docs; deal must DSCR.
Hard money
10% down · 12.0% · 12mo
- Down + closing
- —
- Monthly P&I
- —
- Monthly cashflow
- —
- DSCR
- —
- Eligible?
- —
Short-term bridge; refi at stabilization.
Rent comps 1 comps
| Address | Beds | Baths | Sqft | Rent | $/sqft | DOM | Units | Dist |
|---|---|---|---|---|---|---|---|---|
| 6141 Cedar Creek Way Farmington, NY | 1.0–3.0 | 1.0–2.0 | 1272 | $2,122 | $1.67 | 3d | 17 | 0.29mi |
Listing history 11 events
-
2026-06-10status $34,900 Pending 93 DOM
-
2026-06-09days on market $34,900 Active Under Contract 93 DOM
-
2026-06-09days on market $34,900 Active Under Contract 92 DOM
-
2026-06-07days on market $34,900 Active Under Contract 91 DOM
-
2026-06-05days on market $34,900 Active Under Contract 88 DOM
-
2026-06-03days on market $34,900 Active Under Contract 87 DOM
-
2026-06-03days on market $34,900 Active Under Contract 86 DOM
-
2026-06-01days on market $34,900 Active Under Contract 85 DOM
-
2026-05-31days on market $34,900 Active Under Contract 84 DOM
-
2026-04-20historical Active Under Contract
-
2026-03-06$34,900 Active
ⓘ Source: listings_history table (triggers on properties + properties_extension) + one-shot
backfill from property_details.listing_events for pre-trigger history.
Climate risk First Street
- Flood 1/10 Low FEMA zone X · 0% chance over 30 yrs
- Wildfire 3/10 Moderate
- Heat 2/10 Low 7 d/yr ≥97°F today · 16 d/yr by 30 yrs out
- Wind 1/10 Low
- Air quality 2/10 Low 0 unhealthy d/yr today · 1 by 30 yrs out
Nearby sold comps map
Loading sold comps map…
Walkable amenities ~0.75 mi
Loading nearby amenities…
Taxation est. · year 1
- Rental income
- $24,313
- − Mortgage interest
- −$1,955
- − Property taxes
- −$524
- − Insurance
- −$174
- − Repairs & maintenance
- −$1,945
- − Management
- −$1,945
- − Depreciation
- −$1,015
- Taxable income
- $16,755
- Est. tax owed @ 24.0%
- −$4,021
- After-tax cash flow
- $12,292/yr
For passive investors: Depreciation is non-cash, so a rental often shows a tax loss while cash-flowing — sheltering income. Rental losses are passive: they offset passive income freely, and up to $25,000/yr can offset ordinary (W-2) income if you actively participate and your MAGI is under $100k (phasing out to $0 by $150k); unused losses carry forward. On sale, claimed depreciation is recaptured at up to 25%, and gains may owe capital-gains tax (a 1031 exchange can defer both). Figures are a year-1 estimate at your 24.0% rate — not tax advice; consult a CPA.
Schools (NCES district)
- District
- Victor Central School District
- NCES district ID
- 3629640
- Math proficiency
- 56% ▼ -18.00%
- Reading proficiency
- 62% ▲ 3.00%
- Median HH income
- $73,046
- Composite
- 52.43/100
- National rank
- #1575
- State rank
- #222 of 590 in NY
Livability — Victor
- Score
- 79/100
- State rank
- #122
- US rank
- #1991
Category grades
Schools grade is shown separately in the Schools card above.
Census & demographics
- County
- Ontario County · 58,989 people
- City population
- 16,364
- Metro
- Rochester, NY
- Population (ZIP)
- 13,839
- Household income
- $94,609
- Rent vs Own
- Severe rent burden
- 257.0
Population outlook (Ontario County) Hauer SSP2
- Today (2025)
- 111,230 people
- By 2030
- 111,401 · +0.2%
- By 2040
- 109,535 · -1.5%
- By 2050
- 104,895 · -5.7%
- By 2075
- 92,999 · -16.4%
- By 2100
- 73,723 · -33.7%
Race, ethnicity, and origin ACS 2023
- Neighborhood character
- Predominantly White (86%)
- Race & ethnicity
- White 86% Two or more races 7% Hispanic / Latino 5% Black 2% Asian 2%
- Hispanic origin (detail)
- Puerto Rican 3% Dominican 1%
- Common ancestry
- Romanian 6% Lithuanian 5% Iranian 4%
- Foreign-born
- 3% · Canada, South Korea
- Languages at home
- 94% English-only · Spanish 3% Other Indo-European 1%
Political lean MEDSL · Ontario
- 2024 margin
- Toss-up / Even · D 49.4% · R 50.6%
- 2008→2024 swing
- -1.0pp toward R · 2008: -0.1pp · 2024: -1.2pp
- All cycles
- 2024: R+1.2 2020: R+0.0 2016: R+8.6 2012: R+1.6 2008: R+0.1
Not yet ingested
- Civics
- —
Market trends
- HPI YoY
- ▼ -47.59%
- Current HPI
- 267.0192
- Rent YoY
- —
- Metro
- Rochester, NY
- State GDP YoY
- ▲ 2.60%
- F500 in state
- 92
Industry mix (Fortune 500 HQ in NY)
| Industry | F500 HQs | Revenue |
|---|---|---|
| Financial Services | 10 | $950B |
|
||
| Consumer Goods | 9 | $162B |
|
||
| Insurance | 4 | $225B |
|
||
| Telecommunications | 2 | $144B |
|
||
| Pharmaceuticals | 2 | $112B |
|
||
| Media / Entertainment | 2 | $69B |
|
||
Price history
2 events — show timeline
- 2026-04-20 Contingent — UNYREIS
- 2026-03-06 Listed $34,900 UNYREIS
Cash-flow waterfall
monthlySold comps — $/sqft
last 12 mo · ≤1 miLoading sold comps…