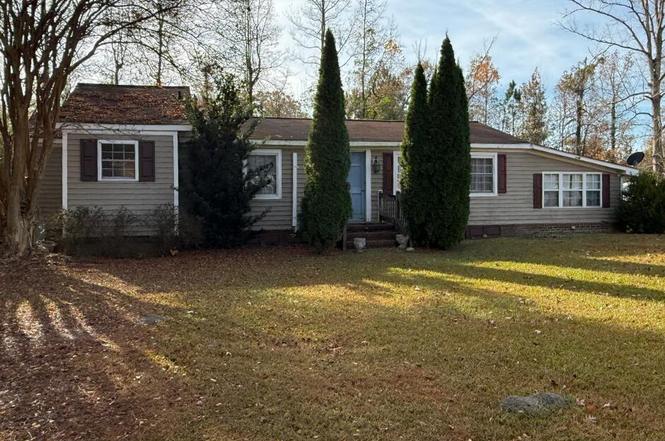
120 Burkett Rd · Dover, NC
Flood risk 1/10 · Minimal
- FEMA flood zone
- X (unshaded)
- Chance of flooding over 30 yrs
- 0.0%
- Est. flood insurance / yr
- $507 – $1,088
Fire risk 5/10 · Moderate
- Est. fire insurance / yr
- $906 – $1,684
Heat risk 8/10 · Major
- Hot days now (above 105°F)
- 7 days/yr
- Hot days in 30 yrs
- 18 days/yr
Wind risk 8/10 · Major
- Chance of severe wind over 30 yrs
- 80.0%
Air-quality risk 2/10 · Minimal
- Unhealthy air days now
- 1 days/yr
- Unhealthy air days in 30 yrs
- 1 days/yr
Risk factors via First Street. Map © Google.
Why this score? — see what drove the C- grade
The composite is a weighted blend of 9 inputs, each scored 0–100. Each bar is that input's sub-score; the figure is the points it added to the 100-point composite (weight × sub-score).
- Cash flow +18.4/30.0
- ARV discount +7.5/15.0
- Appreciation +6.9/10.0
- DSCR +5.8/10.0
- 1% rule +4.0/10.0
- Schools +3.2/10.0
- Livability +2.8/5.0
- Rent growth +2.5/5.0
- Condition / age +2.5/5.0
$110,000
🖨 Deal sheet 📄 Offer letter ✓ Due diligence
Listing remarks
Unique investment opportunity featuring two separate homes located on a single parcel, both in need of work and priced accordingly. The primary residence includes three newer mini split units. With ample lot size and multiple structures, this property presents potential for everyone. Sold as is with no repairs to be made by the seller! Property has a ton of character and needs some TLC to bring it back to life!
Key facts
- Multiple structures
- Ample lot size
- 0.52 acre lot
Tags
Neighborhood map
What this means for you Summary
Snapshot
- This is a 2-bed/1.0-bath single-family listed at $110k.
Deal economics
- At list price, monthly cash flow is $103 ($1k/yr) — positive.
- The deal already cash-flows at list — no discount required.
- To meet the 1% rule (rent ≥ 1% of price), the offer needs to be $99k (9.8% below list).
- Recommended offer: $99k (9.8% below list) — sets the bar for 1% rule.
Location & tenants
- Location reads 56/100 on livability (#625 in NC) — a working-class tenant base; expect higher turnover. Strengths: cost of living A+, housing A+; Watch: crime F, amenities F, commute F.
- Jones County Schools (rural): math 34% / reading 43% proficiency, ranked #121 of 178 in NC (top 68%) — families likely to look elsewhere, expect single-tenant / working-renter base with shorter leases; 70% free/reduced lunch — lower-income household profile, screen leases tightly.
- Zoned schools: Trenton Elementary (math 17% / reading 22%, grade F, #1,242 of 1,410 statewide, top 90%, 149 students, 98% FRL); Jones Senior High School (math 35% / reading 47%, grade F, #385 of 535 statewide, top 72%, 557 students, 100% FRL) — zoned schools average 99% FRL vs 70% district-wide (29 pts higher); higher-poverty schools than district average — tighter screening recommended.
- Market conditions: 2 active listings in the ZIP; 39 units permitted in Jones County in 2024 (0 in 5+ unit buildings).
Forward outlook
- In year one you build about $5k of equity ($761 loan paydown + $4k appreciation (3.7% local appreciation)).
- Jones County population projected at -18% by 2050 — secular population decline; favor cash flow + early exit over multi-decade hold.
- At projected returns (3.7% appreciation + 3.0% rent growth), your $31k cash investment doubles in ~5 years — after that, you're playing with house money.
- By year 7, paydown + projected appreciation supports a ~$31k cash-out refi (75% LTV) — recoverable capital for the next deal without selling this one.
Negotiation context
- It's been on market 101 days — a 9% lower offer ($100k) is reasonable based on typical stale-listing flexibility.
Risks & watch-outs
- Climate carrying-cost: severe wind risk, 80% chance of damaging wind over 30y; moderate wildfire risk; extreme-heat days projected 7→18/yr by 2055 (HVAC capex compounding) — expect insurance premiums to compound above CPI over the hold.
Questions for the listing agent
- It's been on market 101 days. Have you received any prior offers? Is the seller open to a 10% concession, seller financing, or rate buy-down credit?
- Built in 1963 — when were the roof, HVAC, electrical panel, plumbing, and water heater last replaced?
- Why hasn't it sold? Are there any deal-killer items the seller is aware of (foundation, flood, title, zoning, code violations)?
- Is there a deadline driving the sale (1031 exchange, divorce, estate, relocation)? That informs how much negotiation room exists.
- Schools are F-rated, which usually means shorter tenancies and higher turnover. Who's the typical renter profile here, and what's been the actual vacancy rate?
- Crime grade is F in this area — have there been break-ins, vandalism, or insurance claims at this property in the last 3 years? What carrier currently insures it and at what premium?
- What's the average days-on-market for RENTAL listings here right now (not sales)? A rising rental-DOM trend means longer vacancies and softer asking-rent achievability than the comps imply.
- What's the recent tenant-quality profile in this submarket — average credit score on applications, eviction rate, late-payment / NSF rate, and stable-employment percentage? A property-management company in the area should have these aggregated.
- How much new for-sale + rental construction is in the pipeline within 1–3 miles? Heavy new supply typically softens prices + rents 12–24 months out; constrained supply supports both.
Investment metrics
- 1% rule
- 0.90% ✗
- Cap rate
- 7.42%
- Cash-on-cash
- 4.03%
- DSCR
- 1.18
- GRM
- 9.2
CMA / ARV
No comps found within radius.
Projected returns pro-forma
3.71% appreciation · 3.0% rent growth · sell at horizon
- IRR
- 13.1%
- Equity multiple
- 1.78×
- Total profit
- $24,015
- Equity at exit
- $53,940
- IRR
- 14.6%
- Equity multiple
- 3.31×
- Total profit
- $71,175
- Equity at exit
- $86,794
Cash invested: $30,800 (down + closing). Projections, not guarantees.
Landlord ↔ Tenant lean methodology
- Overall (STATE)
- 85 Strongly Landlord-Friendly
- State North Carolina
- 85 Strongly Landlord-Friendly · R+3
- County
- — inherits STATE
- City
- — inherits STATE
ZIP-level market 28526
- Home prices YoY
- 2.1%
- Active inventory
- 2
- Price-to-rent
- 9.2×
Monthly cashflow live
- Estimated rent
- $993 medium interval (Pro) →
- Mortgage (P&I)
- −$577
- Tax from tax record
- −$58 /mo · $697/yr
- Insurance
- −$46
- HOA
- −$0
- Vacancy / Maint / Mgmt
- −$208
- Net cashflow
- $103
Break-even live
UW: 25.0% down · 7.5% · 30yr · 1.5% tax · 5.0% vac · 8.0% maint · 8.0% mgmt
Financing live
Cash to close
- Down payment
- $27,500
- Closing costs
- $3,300
- Reserves months
- —
- Total cash needed
- —
Loan-product check · same deal, 3 products live
Conventional
25% down · 7.5% · 30yr
- Down + closing
- —
- Monthly P&I
- —
- Monthly cashflow
- —
- DSCR
- —
- Eligible?
- —
Personal DTI + credit; lowest rate.
DSCR
20% down · 8.5% · 30yr
- Down + closing
- —
- Monthly P&I
- —
- Monthly cashflow
- —
- DSCR
- —
- Eligible?
- —
No personal income docs; deal must DSCR.
Hard money
10% down · 12.0% · 12mo
- Down + closing
- —
- Monthly P&I
- —
- Monthly cashflow
- —
- DSCR
- —
- Eligible?
- —
Short-term bridge; refi at stabilization.
Listing history 4 events
-
2026-03-26status Pending
-
2026-03-12price $110,000
-
2026-01-28price $135,000
-
2025-12-15$174,500 Active
ⓘ Source: listings_history table (triggers on properties + properties_extension) + one-shot
backfill from property_details.listing_events for pre-trigger history.
Tax reassessment forecast NC · Resets to sale price
- Current annual tax
- $697 · $58/mo
- Projected year-2 tax
- $902 · $75/mo
- Expected delta
- +$205/yr (+$17/mo · 29.4%)
ⓘ Screening estimate from a state-policy table — verify with the county assessor before closing.
Climate risk First Street
- Flood 1/10 Low FEMA zone X (unshaded) · 0% chance over 30 yrs
- Wildfire 5/10 Major
- Heat 8/10 Severe 7 d/yr ≥105°F today · 18 d/yr by 30 yrs out
- Wind 8/10 Severe 80% chance of damaging wind over 30 yrs
- Air quality 2/10 Low 1 unhealthy d/yr today · 1 by 30 yrs out
Nearby sold comps map
Loading sold comps map…
Walkable amenities ~0.75 mi
Loading nearby amenities…
Taxation est. · year 1
- Rental income
- $11,912
- − Mortgage interest
- −$6,162
- − Property taxes
- −$697
- − Insurance
- −$550
- − Repairs & maintenance
- −$953
- − Management
- −$953
- − Depreciation
- −$3,200
- Taxable loss
- −$603
- Est. tax savings @ 24.0%
- +$145
- After-tax cash flow
- $1,386/yr
For passive investors: Depreciation is non-cash, so a rental often shows a tax loss while cash-flowing — sheltering income. Rental losses are passive: they offset passive income freely, and up to $25,000/yr can offset ordinary (W-2) income if you actively participate and your MAGI is under $100k (phasing out to $0 by $150k); unused losses carry forward. On sale, claimed depreciation is recaptured at up to 25%, and gains may owe capital-gains tax (a 1031 exchange can defer both). Figures are a year-1 estimate at your 24.0% rate — not tax advice; consult a CPA.
Schools (NCES district)
- District
- Jones County Schools
- NCES district ID
- 3702400
- Math proficiency
- 34% ▼ -4.00%
- Reading proficiency
- 43% ▼ -3.00%
- Median HH income
- $36,517
- Composite
- 31.93/100
- National rank
- #5849
- State rank
- #121 of 178 in NC
Livability — Dover
- Score
- 56/100
- State rank
- #625
- US rank
- #22751
Category grades
Schools grade is shown separately in the Schools card above.
Census & demographics
- Population (ZIP)
- 1,849
Population outlook (Jones County) Hauer SSP2
- Today (2025)
- 9,892 people
- By 2030
- 9,720 · -1.7%
- By 2040
- 9,043 · -8.6%
- By 2050
- 8,128 · -17.8%
- By 2075
- 6,419 · -35.1%
- By 2100
- 5,454 · -44.9%
Race, ethnicity, and origin ACS 2023
- Neighborhood character
- Majority White (63%)
- Race & ethnicity
- White 63% Black 34% Two or more races 2% Hispanic / Latino 1%
- Common ancestry
- Slovak 1% Romanian 1%
- Foreign-born
- 0% · Canada
- Languages at home
- 99% English-only · Spanish 1%
Political lean MEDSL · Jones
- 2024 margin
- Strong R (+25.7) · D 36.8% · R 62.5%
- 2008→2024 swing
- -17.3pp toward R · 2008: -8.4pp · 2024: -25.7pp
- All cycles
- 2024: R+25.7 2020: R+19.6 2016: R+17.9 2012: R+9.4 2008: R+8.4
Not yet ingested
- Civics
- —
Market trends
- HPI YoY
- ▲ 3.71%
- Current HPI
- 180.1059
- Rent YoY
- —
- Metro
- —
- State GDP YoY
- ▲ 3.28%
- F500 in state
- 26
Industry mix (Fortune 500 HQ in NC)
| Industry | F500 HQs | Revenue |
|---|---|---|
| Financial Services | 2 | $213B |
|
||
| Retail | 2 | $95B |
|
||
| Industrial Conglomerate | 1 | $38B |
|
||
| Metals / Steel | 1 | $35B |
|
||
| Utilities | 1 | $30B |
|
||
| Industrial Machinery | 1 | $19B |
|
||
Price history
-37.0% since first listed4 events — show timeline
- 2026-03-26 Pending — Hive MLS
- 2026-03-12 Price Changed $110,000 Hive MLS
- 2026-01-28 Price Changed $135,000 Hive MLS
- 2025-12-15 Listed $174,500 Hive MLS
Property tax history
+4.3%/yrLatest (2025): $697 · +0.0% YoY. Source: county tax records.
Cash-flow waterfall
monthlySold comps — $/sqft
last 12 mo · ≤1 miLoading sold comps…