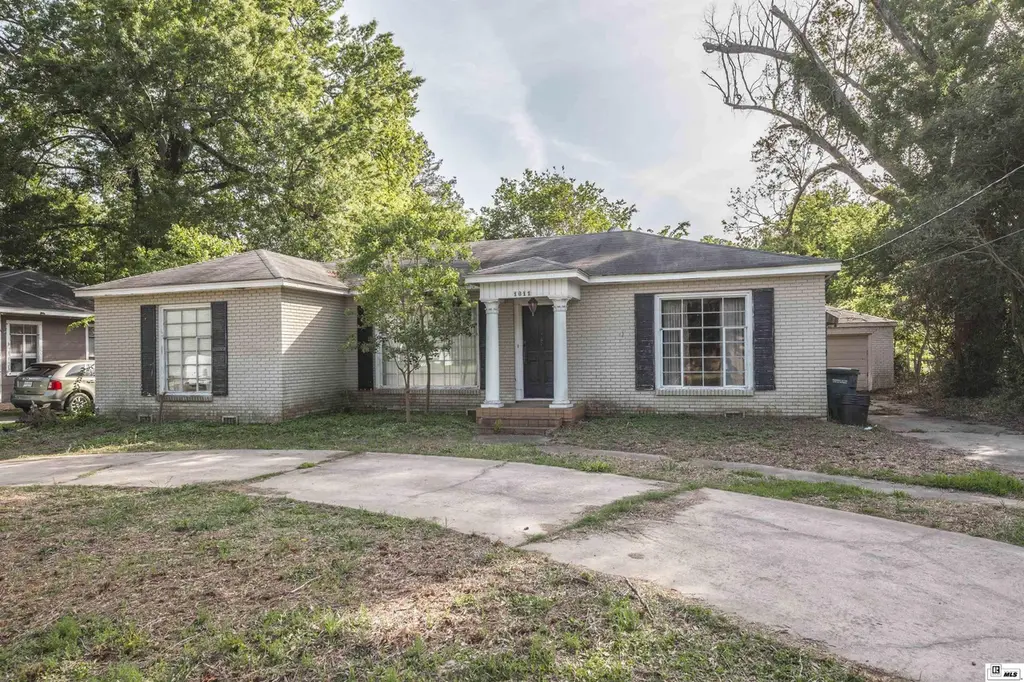
1611 N 8th St · Monroe, LA
Flood risk 1/10 · Minimal
- FEMA flood zone
- X (shaded)
- Chance of flooding over 30 yrs
- 0.0%
- Est. flood insurance / yr
- $507 – $1,088
Fire risk 1/10 · Minimal
- Est. fire insurance / yr
- $1,269 – $2,357
Heat risk 7/10 · Major
- Hot days now (above 112°F)
- 7 days/yr
- Hot days in 30 yrs
- 20 days/yr
Wind risk 7/10 · Major
- Chance of severe wind over 30 yrs
- 78.0%
Air-quality risk 1/10 · Minimal
- Unhealthy air days now
- 0 days/yr
- Unhealthy air days in 30 yrs
- 0 days/yr
Risk factors via First Street. Map © Google.
Why this score? — see what drove the B- grade
The composite is a weighted blend of 9 inputs, each scored 0–100. Each bar is that input's sub-score; the figure is the points it added to the 100-point composite (weight × sub-score).
- Cash flow +30.0/30.0
- 1% rule +10.0/10.0
- DSCR +10.0/10.0
- ARV discount +7.5/15.0
- Livability +3.3/5.0
- Rent growth +2.5/5.0
- Condition / age +2.5/5.0
- Schools +2.1/10.0
- Appreciation +0.0/10.0
$50,000
🖨 Deal sheet (PDF) 📄 Offer letter ✓ Due diligence
Listing remarks MLS
Check out this great investor special! 3 bedroom, 2 bath brick home in Monroe's Garden District!
Key facts
- Spacious lot
- 0.26 acre lot
- Garage
Tags
Property features AI
Finance
- Other: Zoning: residential; Subdivision: HUDSON'S RIVERS; Directions: North on 8th Street, house on right
- HOA & community: No association amenities
Exterior
- Parking: Attached or detached garage with 1 parking space
- Utilities: Public water; Public sewer
- Home design: Single-family residence (site built); One story, entry level 1; Brick veneer construction
- Construction: Brick veneer construction; Asphalt roof; Crawl space foundation
- Exterior features: Patio/porch: other; Cleared lot; Paved road access; Asphalt roof
Interior
- Bedrooms: Three bedrooms on the main level
- Bathrooms: Two full bathrooms
- Heating & cooling: Electric heating; No cooling system
- Interior features: Crawl space basement; No built-in appliances listed; No fireplace
Neighborhood map
What this means for you Summary
Snapshot
- This is a 2-bed/3.0-bath single-family listed at $50k.
Deal economics
- At list price, monthly cash flow is $639 ($8k/yr) — positive.
- The deal already cash-flows at list — no discount required.
- Meets the 1% rule at list price ($1k rent vs $50k).
- Cap rate 21.6% vs local median 5.7% in Monroe — top-decile yield for the area; either an underpriced asset or a hidden risk that comps aren't pricing in. Stress-test before assuming the spread holds.
Location & tenants
- Location reads 66/100 on livability (#128 in LA) — a middle-class / working-renter tenant base. Strengths: cost of living A+, health & safety A+; Watch: crime F, amenities F, commute F.
- City Of Monroe School District (urban): math 21% / reading 31% proficiency, ranked #60 of 98 in LA (top 61%) — low school quality limits family demand, transient renter base, plan for 1-2y turnover; 82% free/reduced lunch — lower-income household profile, screen leases tightly.
- Zoned schools: Lexington Elementary School (604 students, 48% FRL); Neville Junior High School (math 29% / reading 53%, grade F, #61 of 218 statewide, top 28%, 480 students, 58% FRL); Neville High School (math 35% / reading 52%, grade F, #64 of 265 statewide, top 24%, 1,121 students, 49% FRL) — zoned schools average 52% FRL vs 82% district-wide (30 pts lower); this property's tenant base skews higher-income than the district average.
- Zoned-school proficiency averages 42% at this address vs 26% district-wide (+16 pts) — the actual schools serving this property are materially stronger than the City Of Monroe School District average implies; a family-tenant draw the district grade alone would hide.
- Market conditions: 142 active listings in the ZIP; 1 comparable units currently listed for rent nearby; 345 units permitted in Ouachita Parish in 2024 (0 in 5+ unit buildings).
Forward outlook
- Local home prices are declining (-3.0%/yr); year-one equity from $346 of loan paydown is wiped out by about $2k of value loss. Plan a longer hold.
- At projected returns (-3.0% appreciation + 3.0% rent growth), your $14k cash investment doubles in ~3 years — after that, you're playing with house money.
Negotiation context
- Only 3 days on market — expect competitive offers; lowballing is unlikely to land.
- 2 sale attempts since 5y ago with the ask held roughly flat each time — persistent listings suggest the price (not the market) is what's stuck; bring a comps-based counter.
Risks & watch-outs
- Watch-outs: property tax is 3.1% of price; built in 1949 — expect roof / HVAC / electrical / plumbing capex.
- Climate carrying-cost: major wind risk, 78% chance of damaging wind over 30y; extreme-heat days projected 7→20/yr by 2055 (HVAC capex compounding) — expect insurance premiums to compound above CPI over the hold.
Questions for the listing agent
- Built in 1949 — when were the roof, HVAC, electrical panel, plumbing, and water heater last replaced?
- Property tax is high relative to price — has the assessment been appealed recently, and will the sale trigger a re-assessment?
- Is there a deadline driving the sale (1031 exchange, divorce, estate, relocation)? That informs how much negotiation room exists.
- Crime grade is F in this area — have there been break-ins, vandalism, or insurance claims at this property in the last 3 years? What carrier currently insures it and at what premium?
- What's the average days-on-market for RENTAL listings here right now (not sales)? A rising rental-DOM trend means longer vacancies and softer asking-rent achievability than the comps imply.
- What's the recent tenant-quality profile in this submarket — average credit score on applications, eviction rate, late-payment / NSF rate, and stable-employment percentage? A property-management company in the area should have these aggregated.
- How much new for-sale + rental construction is in the pipeline within 1–3 miles? Heavy new supply typically softens prices + rents 12–24 months out; constrained supply supports both.
Investment metrics
- 1% rule
- 2.66% ✓
- Cap rate
- 21.62%
- Cash-on-cash
- 54.73%
- DSCR
- 3.44
- GRM
- 3.1
CMA / ARV
- ARV (on-the-fly)
- $222,456
- Comps found
- 10
Show comp detail 10 sales within ~0.75 mi
| Address | Dist | Beds/Ba | Sqft | Sold | Price | $/sf | Match |
|---|---|---|---|---|---|---|---|
| 1611 N 8th St | 0.00mi | 3/2.0 (+1) | 2,381 (-2%) | 1mo | $46,500 | $20 | 88 |
| 1010 Glenmar Ave | 0.28mi | 3/2.0 (+1) | 2,423 (+0%) | 7mo | $224,000 | $92 | 72 |
| 1503 Glenmar Ave | 0.50mi | 3/3.0 (+1) | 2,409 (-0%) | 12mo | $115,000 | $48 | 61 |
| 407 Rochelle Ave | 0.21mi | 3/2.0 (+1) | 2,115 (-12%) | 5mo | $261,500 | $124 | 56 |
| 1001 Milton St | 0.53mi | 3/2.0 (+1) | 2,182 (-10%) | 1mo | $267,500 | $123 | 49 |
| 209 Stubbs Ave | 0.55mi | 3/2.0 (+1) | 2,219 (-8%) | 5mo | $267,500 | $121 | 48 |
| 201 Auburn Ave | 0.52mi | 3/2.0 (+1) | 2,184 (-10%) | 6mo | $195,000 | $89 | 46 |
| 2315 Jasmine St | 0.65mi | 3/2.0 (+1) | 2,516 (+4%) | 12mo | $205,000 | $81 | 44 |
| 2310 Myrtle St | 0.70mi | 3/3.0 (+1) | 2,720 (+12%) | 15mo | $480,000 | $176 | 29 |
| 112 Glenmar Ave | 0.50mi | 3/2.0 (+1) | 2,080 (-14%) | 20mo | $145,000 | $70 | 28 |
Match score weights: distance 35% · size 25% · config 20% · recency 20%. Top-matched comps best support the ARV.
Projected returns pro-forma
-3.0% appreciation · 3.0% rent growth · sell at horizon
- IRR
- 53.0%
- Equity multiple
- 3.33×
- Total profit
- $32,631
- Equity at exit
- $7,455
- IRR
- 58.2%
- Equity multiple
- 6.79×
- Total profit
- $81,037
- Equity at exit
- $4,323
Cash invested: $14,000 (down + closing). Projections, not guarantees.
Landlord ↔ Tenant lean methodology
- Overall (STATE)
- 90 Strongly Landlord-Friendly
- State Louisiana
- 90 Strongly Landlord-Friendly · R+12
- County
- — inherits STATE
- City
- — inherits STATE
ZIP-level market 71201
- Home prices YoY
- -31.9%
- Active inventory
- 142
- Price-to-rent
- 3.1×
Monthly cashflow live
- Estimated rent
- $1,332 medium interval (Pro) →
- Mortgage (P&I)
- −$262
- Tax from tax record
- −$131 /mo · $1,571/yr
- Insurance
- −$21
- HOA
- −$0
- Lot rent
- −$0
- Vacancy / Maint / Mgmt
- −$280
- Net cashflow
- $639
Break-even live
Sensitivity live
| Price | -10% $667 | -5% $653 | +0% $639 | +5% $624 | +10% $610 |
|---|---|---|---|---|---|
| Rent | -10% $533 | -5% $586 | +0% $639 | +5% $691 | +10% $744 |
| Rate | -1.0pp $664 | -0.5pp $651 | base $639 | +0.5pp $626 | +1.0pp $612 |
UW: 25.0% down · 7.5% · 30yr · 1.5% tax · 5.0% vac · 8.0% maint · 8.0% mgmt
Financing live
Cash to close
- Down payment
- $12,500
- Closing costs
- $1,500
- Reserves months
- —
- Total cash needed
- —
Loan-product check · same deal, 3 products live
Conventional
25% down · 7.5% · 30yr
- Down + closing
- —
- Monthly P&I
- —
- Monthly cashflow
- —
- DSCR
- —
- Eligible?
- —
Personal DTI + credit; lowest rate.
DSCR
20% down · 8.5% · 30yr
- Down + closing
- —
- Monthly P&I
- —
- Monthly cashflow
- —
- DSCR
- —
- Eligible?
- —
No personal income docs; deal must DSCR.
Hard money
10% down · 12.0% · 12mo
- Down + closing
- —
- Monthly P&I
- —
- Monthly cashflow
- —
- DSCR
- —
- Eligible?
- —
Short-term bridge; refi at stabilization.
Rent comps 1 comps
| Address | Beds | Baths | Sqft | Rent | $/sqft | DOM | Units | Dist |
|---|---|---|---|---|---|---|---|---|
| 1707 N 5th St Monroe, LA | 3.0 | 2.0 | 1694 | $3,500 | $2.07 | 23d | 1 | 0.21mi |
Listing history 6 events
-
2026-05-04status Pending
-
2026-05-01$50,000 Active
-
2022-02-10soldstatus 96-char remark
Show marketing remark (96 chars)
Check out this great investor special! 3 bedroom, 2 bath brick home in Monroe's Garden District!
-
2022-02-10soldstatus $75,000
Show marketing remark (96 chars)
Check out this great investor special! 3 bedroom, 2 bath brick home in Monroe's Garden District!
-
2021-12-09$75,000 96-char remark
Show marketing remark (96 chars)
Check out this great investor special! 3 bedroom, 2 bath brick home in Monroe's Garden District!
-
2002-11-01soldstatus
ⓘ Source: listings_history table (triggers on properties + properties_extension) + one-shot
backfill from property_details.listing_events for pre-trigger history.
Tax reassessment forecast LA · Resets to sale price
- Current annual tax
- $1,571 · $131/mo
- Projected year-2 tax
- $1,571 · $131/mo
- Expected delta
- $0/yr ($0/mo · 0.0%)
ⓘ Screening estimate from a state-policy table — verify with the county assessor before closing.
Climate risk First Street
- Flood 1/10 Low FEMA zone X (shaded) · 0% chance over 30 yrs
- Wildfire 1/10 Low
- Heat 7/10 Severe 7 d/yr ≥112°F today · 20 d/yr by 30 yrs out
- Wind 7/10 Severe 78% chance of damaging wind over 30 yrs
- Air quality 1/10 Low 0 unhealthy d/yr today · 0 by 30 yrs out
Nearby sold comps map
Loading sold comps map…
Walkable amenities ~0.75 mi
Loading nearby amenities…
Taxation est. · year 1
- Rental income
- $15,988
- − Mortgage interest
- −$2,801
- − Property taxes
- −$1,571
- − Insurance
- −$250
- − Repairs & maintenance
- −$1,279
- − Management
- −$1,279
- − Depreciation
- −$1,455
- Taxable income
- $7,353
- Est. tax owed @ 24.0%
- −$1,765
- After-tax cash flow
- $5,898/yr
For passive investors: Depreciation is non-cash, so a rental often shows a tax loss while cash-flowing — sheltering income. Rental losses are passive: they offset passive income freely, and up to $25,000/yr can offset ordinary (W-2) income if you actively participate and your MAGI is under $100k (phasing out to $0 by $150k); unused losses carry forward. On sale, claimed depreciation is recaptured at up to 25%, and gains may owe capital-gains tax (a 1031 exchange can defer both). Figures are a year-1 estimate at your 24.0% rate — not tax advice; consult a CPA.
Schools (NCES district)
- District
- City Of Monroe School District
- NCES district ID
- 2201080
- Math proficiency
- 21% ▼ -36.00%
- Reading proficiency
- 31% ▼ -34.00%
- Median HH income
- $28,751
- Composite
- 20.82/100
- National rank
- #8505
- State rank
- #60 of 98 in LA
Livability — Monroe
- Score
- 66/100
- State rank
- #128
- US rank
- #11948
Category grades
Schools grade is shown separately in the Schools card above.
Census & demographics
- Census place
- Monroe, LA
- County
- Ouachita Parish · 118,340 people
- City population
- 60,136
- Metro
- Monroe, LA
- Population (ZIP)
- 21,782
- Household income
- $65,446
- Rent vs Own
- Severe rent burden
- 1466.0
Population outlook (Ouachita County) Hauer SSP2
- Today (2025)
- 163,370 people
- By 2030
- 165,520 · +1.3%
- By 2040
- 167,652 · +2.6%
- By 2050
- 166,699 · +2.0%
- By 2075
- 156,348 · -4.3%
- By 2100
- 134,102 · -17.9%
Race, ethnicity, and origin ACS 2023
- Neighborhood character
- Diverse neighborhood (Simpson 0.55)
- Race & ethnicity
- White 57% Black 35% Two or more races 3% Hispanic / Latino 3% Asian 2%
- Common ancestry
- Lithuanian 3% Slovak 2% Italian 1%
- Foreign-born
- 3% · Vietnam
- Languages at home
- 95% English-only · Spanish 3% Other Indo-European 1% Arabic 1%
Political lean MEDSL · Ouachita
- 2024 margin
- Strong R (+27.9) · D 35.5% · R 63.3% · Other 1.2%
- 2008→2024 swing
- -2.7pp toward R · 2008: -25.2pp · 2024: -27.9pp
- All cycles
- 2024: R+27.9 2020: R+23.6 2016: R+25.4 2012: R+20.9 2008: R+25.2
Not yet ingested
- Civics
- —
Market trends
- HPI YoY
- ▼ -92.35%
- Current HPI
- 196.7468
- Rent YoY
- —
- Metro
- Monroe, LA
- State GDP YoY
- ▲ 3.29%
- F500 in state
- 10
Industry mix (Fortune 500 HQ in LA)
| Industry | F500 HQs | Revenue |
|---|---|---|
| Telecommunications | 2 | $23B |
|
||
| Utilities | 1 | $12B |
|
||
| Wholesale / Distribution | 1 | $5B |
|
||
| Advertising | 1 | $2B |
|
||
Price history
-33.3% since first listed6 events — show timeline
- 2026-05-04 Pending — NELABOR
- 2026-05-01 Listed $50,000 NELABOR
- 2022-02-10 Sold (Public Records) $75,000 Public Records
- 2022-02-10 Sold (MLS) — NELABOR
- 2021-12-09 Listed $75,000 NELABOR
- 2002-11-01 Sold (Public Records) — Public Records
Property tax history
-0.9%/yrLatest (2025): $1,571 · -34.2% YoY. Source: county tax records.
Cash-flow waterfall
monthlySold comps — $/sqft
last 12 mo · ≤1 miLoading sold comps…