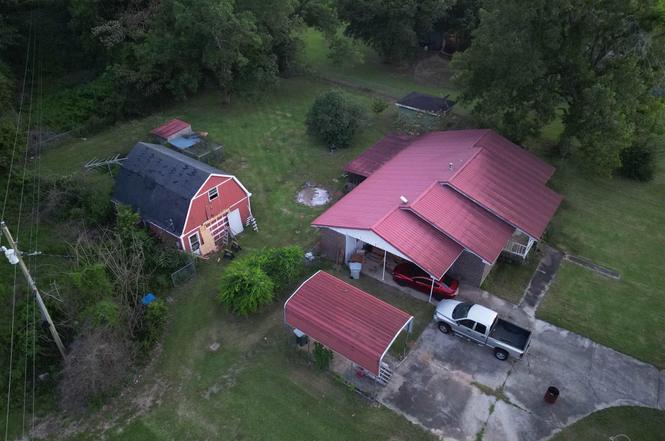
6693 Camp Henderson Rd · Dixonville, FL
Flood risk 1/10 · Minimal
- FEMA flood zone
- X (unshaded)
- Chance of flooding over 30 yrs
- 0.0%
- Est. flood insurance / yr
- $507 – $1,088
Fire risk 6/10 · Moderate
- Est. fire insurance / yr
- $947 – $1,759
Heat risk 8/10 · Major
- Hot days now (above 106°F)
- 7 days/yr
- Hot days in 30 yrs
- 19 days/yr
Wind risk 9/10 · Severe
- Chance of severe wind over 30 yrs
- 99.0%
Air-quality risk 2/10 · Minimal
- Unhealthy air days now
- 1 days/yr
- Unhealthy air days in 30 yrs
- 1 days/yr
Risk factors via First Street. Map © Google.
Why this score? — see what drove the C grade
The composite is a weighted blend of 9 inputs, each scored 0–100. Each bar is that input's sub-score; the figure is the points it added to the 100-point composite (weight × sub-score).
- Cash flow +19.0/30.0
- Appreciation +10.0/10.0
- ARV discount +7.5/15.0
- DSCR +6.0/10.0
- Schools +5.3/10.0
- 1% rule +4.2/10.0
- Livability +2.9/5.0
- Rent growth +2.5/5.0
- Condition / age +2.5/5.0
$125,000
🖨 Deal sheet 📄 Offer letter ✓ Due diligence
Listing remarks MLS
Jay, FL. Five (5) acres in beautiful Jay, FL. This home needs some work and is being sold "AS IS", but everything you need is already there. Covered carport leads you into the kitchen which has tons of counter space and totally open to the living areas. This home also features a foyer for those more formal occasions. The bedrooms are located on the opposite end of the home for maximum privacy and comfort. The land is partially cleared, with some timber remaining to the rear of the acreage. Apple trees, fig tree, and a host of pecan trees make this true country living. The rear yard is fenced and has a 20x26 workshop (currently being used for a dog grooming business) is easily convertible. There is also a separate RV cover or extra carport (easily converted into second workshop). This land incredibly comes with 2 more existing septic tanks and water alreadt ran to one of those locations. Plenty of room to expand, mother in law situation, place for adult children or income producing. If Jay is your destination and you are looking to acquire 5 acres and a home site, this one's for you.
Key facts
- Two outbuildings
- Fenced backyard
- Public water
Tags
Property features AI
Finance
- Other: Homestead indicated; Yard building on property; Directions: Take Hwy 87 North from Milton, turn right on Camp Henderson Rd; property on the right.
- HOA & community: No homeowners association
Exterior
- Parking: Carport with 1 covered space; RV access/parking; Total 1 parking space listed
- Utilities: Electric with circuit breakers; Septic tank for sewer; County-maintained road access
- Home design: Single-story (one level); Detached property (not attached); Resale condition; Allows exterior handicap access; Metal roof; Lot approximately 2.41 acres (dimensions ~211 x 500)
- Construction: Frame construction; Off-grade foundation; Built as one-level structure; Metal roof
- Exterior features: Partial fencing; Porch; Covered deck; Yard building (other structure); Interior lot
Interior
- Kitchen: Electric water heater
- Bedrooms: Primary bedroom on the first floor (approx. 14 x 15)
- Flooring: Simulated wood
- Bathrooms: 2 full bathrooms
- Heating & cooling: Space heater for heating; Wall/window cooling unit(s); Ceiling fans
- Interior features: Simulated wood flooring; Kitchen/dining combo
- Laundry & utility: Off-grade foundation (utility access); Septic tank
Neighborhood map
What this means for you Summary
Snapshot
- This is a 3-bed/1.0-bath single-family listed at $125k.
Deal economics
- At list price, monthly cash flow is $131 ($2k/yr) — positive.
- The deal already cash-flows at list — no discount required.
- To meet the 1% rule (rent ≥ 1% of price), the offer needs to be $116k (7.6% below list).
- Recommended offer: $116k (7.6% below list) — sets the bar for 1% rule.
Location & tenants
- Location reads 58/100 on livability (#846 in FL) — a working-class tenant base; expect higher turnover. Strengths: cost of living A+, housing A+, crime A; Watch: schools D, amenities F, commute F.
- Santa Rosa (suburban): math 63% / reading 60% proficiency, ranked #8 of 73 in FL (top 11%) — acceptable for families but not a draw, mixed tenant base, ~2y average lease.
- Market conditions: 129 active listings in the ZIP; 1,983 units permitted in Santa Rosa County in 2024 (128 in 5+ unit buildings).
Forward outlook
- In year one you build about $13k of equity ($864 loan paydown + $12k appreciation (10.0% local appreciation)).
- Santa Rosa County population projected at +31% by 2050 — long-run rental-demand tailwind backs the buy-and-hold thesis.
- At projected returns (10.0% appreciation + 3.0% rent growth), your $35k cash investment doubles in ~3 years — after that, you're playing with house money.
- By year 3, paydown + projected appreciation supports a ~$34k cash-out refi (75% LTV) — recoverable capital for the next deal without selling this one.
Negotiation context
- Only 7 days on market — expect competitive offers; lowballing is unlikely to land.
- 3 sale attempts since 8y ago with the ask held roughly flat each time — persistent listings suggest the price (not the market) is what's stuck; bring a comps-based counter.
- Current owner paid $100k; 25% above their basis — modest negotiation headroom, anchor on the comps not their cost.
Risks & watch-outs
- Watch-outs: built in 1954 — expect roof / HVAC / electrical / plumbing capex.
- Climate carrying-cost: severe wind risk, 99% chance of damaging wind over 30y; major wildfire risk; extreme-heat days projected 7→19/yr by 2055 (HVAC capex compounding) — expect insurance premiums to compound above CPI over the hold.
Questions for the listing agent
- Built in 1954 — when were the roof, HVAC, electrical panel, plumbing, and water heater last replaced?
- Is there a deadline driving the sale (1031 exchange, divorce, estate, relocation)? That informs how much negotiation room exists.
- Schools are D-rated, which usually means shorter tenancies and higher turnover. Who's the typical renter profile here, and what's been the actual vacancy rate?
- What's the average days-on-market for RENTAL listings here right now (not sales)? A rising rental-DOM trend means longer vacancies and softer asking-rent achievability than the comps imply.
- What's the recent tenant-quality profile in this submarket — average credit score on applications, eviction rate, late-payment / NSF rate, and stable-employment percentage? A property-management company in the area should have these aggregated.
- How much new for-sale + rental construction is in the pipeline within 1–3 miles? Heavy new supply typically softens prices + rents 12–24 months out; constrained supply supports both.
Investment metrics
- 1% rule
- 0.92% ✗
- Cap rate
- 7.55%
- Cash-on-cash
- 4.48%
- DSCR
- 1.20
- GRM
- 9.0
CMA / ARV
No comps found within radius.
Projected returns pro-forma
10.0% appreciation · 3.0% rent growth · sell at horizon
- IRR
- 27.5%
- Equity multiple
- 3.18×
- Total profit
- $76,363
- Equity at exit
- $112,610
- IRR
- 24.0%
- Equity multiple
- 7.24×
- Total profit
- $218,270
- Equity at exit
- $242,848
Cash invested: $35,000 (down + closing). Projections, not guarantees.
Landlord ↔ Tenant lean methodology
- Overall (STATE)
- 87 Strongly Landlord-Friendly
- State Florida
- 87 Strongly Landlord-Friendly · R+3
- County
- — inherits STATE
- City
- — inherits STATE
ZIP-level market 32565
- Home prices YoY
- 11.4%
- Active inventory
- 129
- Price-to-rent
- 9.0×
Monthly cashflow live
- Estimated rent
- $1,155 medium interval (Pro) →
- Mortgage (P&I)
- −$656
- Tax from tax record
- −$74 /mo · $892/yr
- Insurance
- −$52
- HOA
- −$0
- Vacancy / Maint / Mgmt
- −$243
- Net cashflow
- $131
Break-even live
UW: 25.0% down · 7.5% · 30yr · 1.5% tax · 5.0% vac · 8.0% maint · 8.0% mgmt
Financing live
Cash to close
- Down payment
- $31,250
- Closing costs
- $3,750
- Reserves months
- —
- Total cash needed
- —
Loan-product check · same deal, 3 products live
Conventional
25% down · 7.5% · 30yr
- Down + closing
- —
- Monthly P&I
- —
- Monthly cashflow
- —
- DSCR
- —
- Eligible?
- —
Personal DTI + credit; lowest rate.
DSCR
20% down · 8.5% · 30yr
- Down + closing
- —
- Monthly P&I
- —
- Monthly cashflow
- —
- DSCR
- —
- Eligible?
- —
No personal income docs; deal must DSCR.
Hard money
10% down · 12.0% · 12mo
- Down + closing
- —
- Monthly P&I
- —
- Monthly cashflow
- —
- DSCR
- —
- Eligible?
- —
Short-term bridge; refi at stabilization.
Listing history 8 events
-
2026-06-18days on market $125,000 Active 7 DOM
-
2026-06-18price $125,000 Active 6 DOM
-
2026-06-17days on market $130,000 Active 6 DOM
-
2026-06-16days on market $130,000 Active 5 DOM
-
2026-06-15days on market $130,000 Active 4 DOM
-
2026-06-14days on market $130,000 Active 2 DOM
-
2026-06-13remarks 699-char remark
-
2026-06-13$130,000 Active 1 DOM
ⓘ Source: listings_history table (triggers on properties + properties_extension) + one-shot
backfill from property_details.listing_events for pre-trigger history.
Tax reassessment forecast FL · Resets to sale price
- Current annual tax
- $892 · $74/mo
- Projected year-2 tax
- $1,038 · $86/mo
- Expected delta
- +$146/yr (+$12/mo · 16.3%)
ⓘ Screening estimate from a state-policy table — verify with the county assessor before closing.
Climate risk First Street
- Flood 1/10 Low FEMA zone X (unshaded) · 0% chance over 30 yrs
- Wildfire 6/10 Major
- Heat 8/10 Severe 7 d/yr ≥106°F today · 19 d/yr by 30 yrs out
- Wind 9/10 Extreme 99% chance of damaging wind over 30 yrs
- Air quality 2/10 Low 1 unhealthy d/yr today · 1 by 30 yrs out
Nearby sold comps map
Loading sold comps map…
Walkable amenities ~0.75 mi
Loading nearby amenities…
Taxation est. · year 1
- Rental income
- $13,861
- − Mortgage interest
- −$7,002
- − Property taxes
- −$892
- − Insurance
- −$625
- − Repairs & maintenance
- −$1,109
- − Management
- −$1,109
- − Depreciation
- −$3,636
- Taxable loss
- −$512
- Est. tax savings @ 24.0%
- +$123
- After-tax cash flow
- $1,690/yr
For passive investors: Depreciation is non-cash, so a rental often shows a tax loss while cash-flowing — sheltering income. Rental losses are passive: they offset passive income freely, and up to $25,000/yr can offset ordinary (W-2) income if you actively participate and your MAGI is under $100k (phasing out to $0 by $150k); unused losses carry forward. On sale, claimed depreciation is recaptured at up to 25%, and gains may owe capital-gains tax (a 1031 exchange can defer both). Figures are a year-1 estimate at your 24.0% rate — not tax advice; consult a CPA.
Schools (NCES district)
- District
- Santa Rosa
- NCES district ID
- 1201650
- Math proficiency
- 63% ▼ -6.00%
- Reading proficiency
- 60% ▼ -5.00%
- Median HH income
- $58,161
- Composite
- 53.12/100
- National rank
- #1511
- State rank
- #8 of 73 in FL
Livability — Dixonville
- Score
- 58/100
- State rank
- #846
- US rank
- #21205
Category grades
Schools grade is shown separately in the Schools card above.
Census & demographics
- Census place
- Dixonville, FL
- Population (ZIP)
- 5,653
Population outlook (Santa Rosa County) Hauer SSP2
- Today (2025)
- 195,978 people
- By 2030
- 209,782 · +7.0%
- By 2040
- 235,293 · +20.1%
- By 2050
- 256,408 · +30.8%
- By 2075
- 298,074 · +52.1%
- By 2100
- 303,216 · +54.7%
Race, ethnicity, and origin ACS 2023
- Neighborhood character
- Predominantly White (91%)
- Race & ethnicity
- White 91% Asian 5% Two or more races 3%
- Common ancestry
- Slovak 3% Lithuanian 2% Serbian 1%
- Foreign-born
- 3% · China, Vietnam
- Languages at home
- 94% English-only · Chinese 4% Spanish 1% Tagalog/Filipino 1%
Political lean MEDSL · Santa Rosa
- 2024 margin
- Solid R (+51.0) · D 24.1% · R 75.0%
- 2008→2024 swing
- -3.0pp toward R · 2008: -47.9pp · 2024: -51.0pp
- All cycles
- 2024: R+51.0 2020: R+46.5 2016: R+53.5 2012: R+52.6 2008: R+47.9
Not yet ingested
- Civics
- —
Market trends
- HPI YoY
- ▲ 33.17%
- Current HPI
- 324.7547
- Rent YoY
- —
- Metro
- —
- State GDP YoY
- ▲ 3.28%
- F500 in state
- 36
Industry mix (Fortune 500 HQ in FL)
| Industry | F500 HQs | Revenue |
|---|---|---|
| Industrial Technology | 2 | $29B |
|
||
| Insurance | 2 | $17B |
|
||
| Retail | 1 | $60B |
|
||
| Technology Distribution | 1 | $58B |
|
||
| Homebuilding | 1 | $35B |
|
||
| Technology Manufacturing | 1 | $35B |
|
||
Price history
+622.2% since first listed7 events — show timeline
- 2026-06-11 Listed $130,000 PARMLS
- 2018-09-10 Sold (Public Records) $100,000 Public Records
- 2018-09-07 Sold (MLS) $100,000 PARMLS
- 2018-09-07 Sold (MLS) $100,000 BCAR
- 2018-07-11 Listed $110,000 PARMLS
- 2018-07-11 Listed $110,000 BCAR
- 1990-09-01 Sold (Public Records) $18,000 Public Records
Property tax history
+4.7%/yrLatest (2025): $892 · +7.3% YoY. Source: county tax records.
Cash-flow waterfall
monthlySold comps — $/sqft
last 12 mo · ≤1 miLoading sold comps…