 Duplex
324A 14th Ave · Newark, NJ
Flood risk 1/10 · Minimal
- FEMA flood zone
- X (unshaded)
- Chance of flooding over 30 yrs
- 0.0%
- Est. flood insurance / yr
- $507 – $1,088
Fire risk 1/10 · Minimal
- Est. fire insurance / yr
- $526 – $976
Heat risk 7/10 · Major
- Hot days now (above 100°F)
- 7 days/yr
- Hot days in 30 yrs
- 14 days/yr
Wind risk 6/10 · Moderate
- Chance of severe wind over 30 yrs
- 27.0%
Air-quality risk 4/10 · Minor
- Unhealthy air days now
- 4 days/yr
- Unhealthy air days in 30 yrs
- 5 days/yr
Risk factors via First Street. Map © Google.
Why this score? — see what drove the D grade
The composite is a weighted blend of 9 inputs, each scored 0–100. Each bar is that input's sub-score; the figure is the points it added to the 100-point composite (weight × sub-score).
- Cash flow +11.0/30.0
- ARV discount +7.5/15.0
- Appreciation +6.1/10.0
- Condition / age +3.8/5.0
- Livability +3.4/5.0
- 1% rule +3.2/10.0
- DSCR +3.2/10.0
- Rent growth +2.6/5.0
- Schools +1.4/10.0
$599,900
🖨 Deal sheet (PDF) 📄 Offer letter ✓ Due diligence
Multi-family units
County records classify this as Multi-Family (2-4 Unit). Listing-text estimate: 2 units. confirmed
Listing remarks
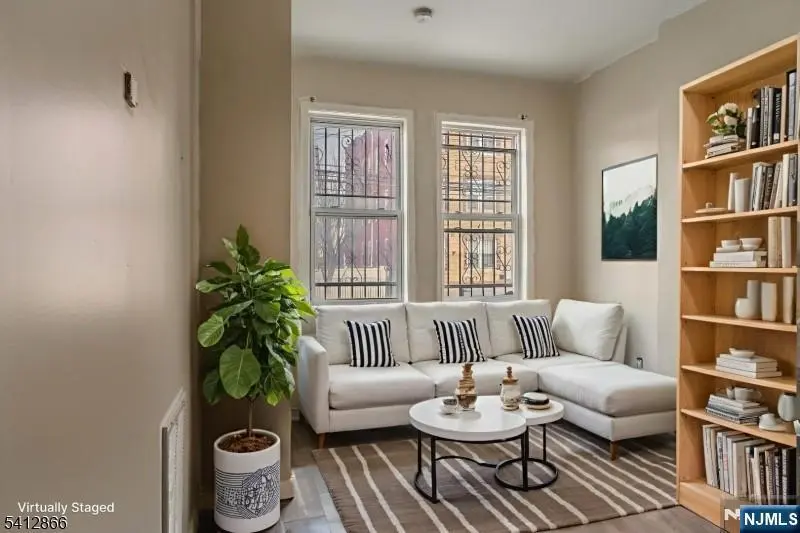
Spacious 2-family property featuring 6 bedrooms and 2 full baths, updated plumbing, and a separate basement entrance with additional potential. Ideal for owner-occupants or investors seeking strong rental income opportunities. Conveniently located near major transportation, schools, and local amenities. Will be delivered vacant!
Key facts
- Updated plumbing
- 1,498 sq ft lot
- Listed 30 days
Tags
Property features AI
Exterior
- Utilities: Natural gas available and connected; Electricity connected; Water connected
- Home design: Residential income property; Multi-family
Interior
- Bathrooms: 2 full bathrooms
- Interior features: 10 total rooms
- Laundry & utility: No laundry in unit (None listed)
Neighborhood map
What this means for you Summary
Snapshot
- This is a 2 × 3-bed/1.0-bath units multifamily listed at $600k. Condition is rated good.
Deal economics
- At list price, monthly cash flow is $-249 ($-3k/yr) — negative. Per door: $-124/mo.
- To cash-flow at today's rent, offer at most $564k (6.0% below list).
- To meet the 1% rule (rent ≥ 1% of price), the offer needs to be $493k (17.8% below list).
- Recommended offer: $493k (17.8% below list) — sets the bar for 1% rule.
- Cap rate 5.8% vs local median 3.0% in Newark — top-decile yield for the area; either an underpriced asset or a hidden risk that comps aren't pricing in. Stress-test before assuming the spread holds.
Location & tenants
- Location reads 67/100 on livability (#343 in NJ) — a middle-class / working-renter tenant base. Strengths: commute A+, amenities A-; Watch: schools D+, housing D+, crime F.
- Newark Public School District (urban): math 9% / reading 26% proficiency, ranked #452 of 472 in NJ (top 96%) — low school quality limits family demand, transient renter base, plan for 1-2y turnover; 79% free/reduced lunch — lower-income household profile, screen leases tightly.
- Market conditions: Rents flat; 61 active listings in the ZIP; 14 comparable units currently listed for rent nearby; rentals at typical pace (median 20d on market — plan ~3-4 weeks tenant-placement turnaround); 3,364 units permitted in Essex County in 2024 (2,551 in 5+ unit buildings).
- At $4,933/mo this rent would consume 115% of the median local household income ($52k/yr) (locally 2963% of renters already pay >50% of income on rent) — very limited rent-growth headroom before tenants either downsize or default.
Forward outlook
- In year one you build about $17k of equity ($4k loan paydown + $13k appreciation (2.2% local appreciation)).
- Essex County population projected at +3% by 2050 — modest demand growth; plan on rents tracking national, not racing it.
- By year 3, paydown + projected appreciation supports a ~$43k cash-out refi (75% LTV) — recoverable capital for the next deal without selling this one.
Negotiation context
- It's been on market 31 days — a 3% lower offer ($582k) is reasonable based on typical stale-listing flexibility.
- 5 sale attempts since 3y ago with the ask held roughly flat each time — persistent listings suggest the price (not the market) is what's stuck; bring a comps-based counter.
- Current owner paid $230k; list at $600k implies a 161% gain — meaningful room to come down on a strong offer.
Risks & watch-outs
- Climate carrying-cost: major wind risk, 27% chance of damaging wind over 30y; extreme-heat days projected 7→14/yr by 2055 (HVAC capex compounding) — expect insurance premiums to compound above CPI over the hold.
Questions for the listing agent
- What do current leases actually rent for vs. the listed asking? Can we see a recent rent roll and the last 12 months of T-12 income?
- It's been on market 31 days. Have you received any prior offers? Is the seller open to a 18% concession, seller financing, or rate buy-down credit?
- Can we see the unit-by-unit rent roll, current vacancy, and any below-market leases? What's the average tenancy length?
- What capital expenditures (roof, boiler, parking lot, exteriors) have been made in the last 5 years, and what's planned in the next 2?
- Is there a deadline driving the sale (1031 exchange, divorce, estate, relocation)? That informs how much negotiation room exists.
- Schools are D-rated, which usually means shorter tenancies and higher turnover. Who's the typical renter profile here, and what's been the actual vacancy rate?
- Crime grade is F in this area — have there been break-ins, vandalism, or insurance claims at this property in the last 3 years? What carrier currently insures it and at what premium?
- The area grade is low — what's the realistic commute time and amenity access for the typical tenant pool here? Any planned neighborhood developments (good or bad) we should know about?
- What's the average days-on-market for RENTAL listings here right now (not sales)? A rising rental-DOM trend means longer vacancies and softer asking-rent achievability than the comps imply.
- What's the recent tenant-quality profile in this submarket — average credit score on applications, eviction rate, late-payment / NSF rate, and stable-employment percentage? A property-management company in the area should have these aggregated.
- How much new apartment / multifamily construction is in the pipeline within 1–3 miles? Heavy new supply (>2% of stock underway) typically softens rents 12–24 months out; light construction supports rent growth.
Investment metrics
- 1% rule
- 0.82% ✗
- Cap rate
- 5.80%
- Cash-on-cash
- -1.78%
- DSCR
- 0.92
- GRM
- 10.1
CMA / ARV
No comps found within radius.
Show comp detail 12 sales within ~0.75 mi
| Address | Dist | Beds/Ba | Sqft | Sold | Price | $/sf | Match |
|---|---|---|---|---|---|---|---|
| 486 19th St | 0.11mi | 6/4.5 | — | 1mo | $820,000 | — | 71 |
| 484 19th St | 0.11mi | 6/5.0 | — | 1mo | $820,000 | — | 69 |
| 624 19th St | 0.42mi | 6/3.0 | — | 1mo | $650,000 | — | 64 |
| 524 S 15th St | 0.23mi | 7/5.5 (+1) | — | 1mo | $999,999 | — | 57 |
| 522 S 15th St | 0.22mi | 7/5.5 (+1) | — | 2mo | $970,000 | — | 56 |
| 50 Blum St | 0.51mi | 5/2.0 (-1) | — | 4mo | $240,000 | — | 56 |
| 78 Devine St | 0.46mi | 7/5.0 (+1) | — | 0mo | $655,000 | — | 49 |
| 225 9th St | 0.53mi | 7/4.0 (+1) | — | 3mo | $865,000 | — | 48 |
| 719 18th Ave | 0.63mi | 5/3.0 (-1) | — | 3mo | $425,000 | — | 46 |
| 721 S 19th St | 0.68mi | 6/5.0 | — | 0mo | $765,000 | — | 44 |
| 152 10th St | 0.75mi | 7/3.0 (+1) | — | 1mo | $547,000 | — | 43 |
| 29 Kent St | 0.72mi | 7/5.0 (+1) | — | 3mo | $850,000 | — | 34 |
Match score weights: distance 35% · size 25% · config 20% · recency 20%. Top-matched comps best support the ARV.
Projected returns pro-forma
2.18% appreciation · 0.35% rent growth · sell at horizon
- IRR
- 2.0%
- Equity multiple
- 1.11×
- Total profit
- $17,925
- Equity at exit
- $242,335
- IRR
- 4.6%
- Equity multiple
- 1.62×
- Total profit
- $103,958
- Equity at exit
- $353,413
Cash invested: $167,972 (down + closing). Projections, not guarantees.
Landlord ↔ Tenant lean methodology
- Overall (CITY)
- 0 Strongly Tenant-Friendly
- State New Jersey
- 21 Tenant-Leaning · D+6
- County
- — inherits STATE
- City Newark
- 0 Strongly Tenant-Friendly · D+59
ZIP-level market 07103
- Home prices YoY
- 0.7%
- Rents YoY
- 0.3%
- Active inventory
- 61
- Price-to-rent
- 20.3×
Monthly cashflow live
- Estimated rent
- $4,933 high interval (Pro) →
- Mortgage (P&I)
- −$3,146
- Tax est. 1.5%
- −$750 /mo · $8,998/yr
- Insurance
- −$250
- HOA
- −$0
- Vacancy / Maint / Mgmt
- −$1,036
- Net cashflow
- $-249
Break-even live
Sensitivity live
| Price | -10% $166 | -5% $-41 | +0% $-249 | +5% $-456 | +10% $-663 |
|---|---|---|---|---|---|
| Rent | -10% $-638 | -5% $-444 | +0% $-249 | +5% $-54 | +10% $141 |
| Rate | -1.0pp $53 | -0.5pp $-96 | base $-249 | +0.5pp $-404 | +1.0pp $-562 |
2-unit breakdown (identical units grouped — click to expand)
| Units | Beds | Baths | Est. rent |
|---|---|---|---|
| 2× units | 3 | 1 | $4,934 |
| #1 | 3 | 1 | $2,467 |
| #2 | 3 | 1 | $2,467 |
| Total (2 units) | $4,933 | ||
UW: 25.0% down · 7.5% · 30yr · 1.5% tax · 5.0% vac · 8.0% maint · 8.0% mgmt
Financing live
Cash to close
- Down payment
- $149,975
- Closing costs
- $17,997
- Reserves months
- —
- Total cash needed
- —
Loan-product check · same deal, 3 products live
Conventional
25% down · 7.5% · 30yr
- Down + closing
- —
- Monthly P&I
- —
- Monthly cashflow
- —
- DSCR
- —
- Eligible?
- —
Personal DTI + credit; lowest rate.
DSCR
20% down · 8.5% · 30yr
- Down + closing
- —
- Monthly P&I
- —
- Monthly cashflow
- —
- DSCR
- —
- Eligible?
- —
No personal income docs; deal must DSCR.
Hard money
10% down · 12.0% · 12mo
- Down + closing
- —
- Monthly P&I
- —
- Monthly cashflow
- —
- DSCR
- —
- Eligible?
- —
Short-term bridge; refi at stabilization.
Rent comps 14 comps
| Address | Beds | Baths | Sqft | Rent | $/sqft | DOM | Units | Dist |
|---|---|---|---|---|---|---|---|---|
| 294 S 7th St Unit 2 Newark, NJ | 5.0 | 2.0 | — | $2,050 | — | 21d | 1 | 0.47mi |
| 21 Chelsea Ave Newark, NJ | 5.0 | 1.5 | 1500 | $3,000 | $2.00 | 14d | 1 | 0.74mi |
| 142 Steuben St East Orange, NJ | 5.0 | 2.0 | — | $4,575 | — | 0d | 1 | 0.86mi |
| 44 Farley Ave Unit 2 Newark, NJ | 5.0 | 2.0 | — | $3,700 | — | 25d | 1 | 1.12mi |
| 12 Bruen Ave Irvington, NJ | 6.0 | 3.0 | — | $4,600 | — | 0d | 1 | 1.23mi |
| 808 Clinton Ave Unit G Newark, NJ | 5.0 | 2.0 | 1200 | $2,950 | $2.46 | 21d | 1 | 1.24mi |
| 808 Clinton Ave Unit G Newark, NJ | 5.0 | 2.0 | — | $2,950 | — | 22d | 1 | 1.24mi |
| 808 Clinton Ave Unit G Newark, NJ | 5.0 | 2.0 | — | $2,949 | — | 20d | 1 | 1.24mi |
| 46 Eppirt St East Orange, NJ | 7.0 | 3.0 | — | $6,450 | — | 0d | 1 | 1.26mi |
| 22 Rockland Ter Newark, NJ | 5.0 | 3.0 | 1440 | $4,495 | $3.12 | 0d | 1 | 1.27mi |
| 100 Smith St Unit 2 Newark, NJ | 5.0 | 1.5 | — | $2,595 | — | 18d | 1 | 1.32mi |
| 263 Amherst St East Orange, NJ | 5.0 | 1.0 | — | $2,800 | — | 21d | 1 | 1.40mi |
| 107 Palm St Newark, NJ | 5.0 | 2.0 | — | $3,495 | — | 25d | 1 | 1.40mi |
| 108 N Oraton Pkwy Fl 1 East Orange, NJ | 5.0 | 3.0 | 3289 | $4,500 | $1.37 | 2d | 1 | 1.50mi |
Listing history 28 events
-
2026-06-18days on market $599,900 Active 31 DOM
-
2026-06-17days on market $599,900 Active 30 DOM
-
2026-06-16days on market $599,900 Active 29 DOM
-
2026-06-15days on market $599,900 Active 28 DOM
-
2026-06-13days on market $599,900 Active 26 DOM
-
2026-06-13days on market $599,900 Active 25 DOM
-
2026-06-09days on market $599,900 Active 22 DOM
-
2026-06-08days on market $599,900 Active 21 DOM
-
2026-06-07days on market $599,900 Active 20 DOM
-
2026-06-04days on market $599,900 Active 17 DOM
-
2026-06-03days on market $599,900 Active 16 DOM
-
2026-06-02days on market $599,900 Active 15 DOM
-
2026-06-01days on market $599,900 Active 14 DOM
-
2026-05-31days on market $599,900 Active 13 DOM
-
2026-03-14price $550,000 330-char remark
-
2026-02-21$599,900 Active 330-char remark
-
2026-02-21$599,900 Active 330-char remark
-
2024-05-08historical
-
2024-04-24historical Under Contract
-
2024-02-26status Active
-
2024-02-22historical
-
2024-02-21$549,999 Active
-
2024-02-21historical
-
2024-02-07$575,000 Active
-
2023-09-11soldstatus $230,000 Sold
-
2023-08-16historical
-
2023-08-15status Under Contract
-
2023-07-13$239,999 Active
ⓘ Source: listings_history table (triggers on properties + properties_extension) + one-shot
backfill from property_details.listing_events for pre-trigger history.
Climate risk First Street
- Flood 1/10 Low FEMA zone X (unshaded) · 0% chance over 30 yrs
- Wildfire 1/10 Low
- Heat 7/10 Severe 7 d/yr ≥100°F today · 14 d/yr by 30 yrs out
- Wind 6/10 Major 27% chance of damaging wind over 30 yrs
- Air quality 4/10 Moderate 4 unhealthy d/yr today · 5 by 30 yrs out
Nearby sold comps map
Loading sold comps map…
Walkable amenities ~0.75 mi
Loading nearby amenities…
Taxation est. · year 1
- Rental income
- $59,196
- − Mortgage interest
- −$33,604
- − Property taxes
- −$8,998
- − Insurance
- −$3,000
- − Repairs & maintenance
- −$4,736
- − Management
- −$4,736
- − Depreciation
- −$17,452
- Taxable loss
- −$13,329
- Est. tax savings @ 24.0%
- +$3,199
- After-tax cash flow
- $214/yr
For passive investors: Depreciation is non-cash, so a rental often shows a tax loss while cash-flowing — sheltering income. Rental losses are passive: they offset passive income freely, and up to $25,000/yr can offset ordinary (W-2) income if you actively participate and your MAGI is under $100k (phasing out to $0 by $150k); unused losses carry forward. On sale, claimed depreciation is recaptured at up to 25%, and gains may owe capital-gains tax (a 1031 exchange can defer both). Figures are a year-1 estimate at your 24.0% rate — not tax advice; consult a CPA.
Condition & rehab AI · 1 photo
This 2-family property is in good condition with fresh paint and carpet, ideal for owner-occupants or investors seeking strong rental income opportunities.
Value-add opportunities
- Both Paint touch-ups — Fresh paint enhances curb appeal and interior aesthetics
- Both Deep cleaning — A thorough cleaning can make the property more appealing to potential buyers/tenants
- Both Landscaping — Landscaping can significantly improve curb appeal and attract more interest
Renovation cost estimate screening
Value-add ROI direction
- Both Paint touch-ups — Fresh paint enhances curb appeal and interior aesthetics ↑
- Both Deep cleaning — A thorough cleaning can make the property more appealing to potential buyers/tenants ↑
- Both Landscaping — Landscaping can significantly improve curb appeal and attract more interest ↑
ⓘ Cost ranges are severity-bucket heuristics (US national rule-of-thumb). Get contractor quotes + a written scope before underwriting a rehab budget.
Schools (NCES district)
- District
- Newark Public School District
- NCES district ID
- 3411340
- Math proficiency
- 9% ▼ -17.00%
- Reading proficiency
- 26% ▼ -10.00%
- Median HH income
- $33,891
- Composite
- 14.24/100
- National rank
- #9449
- State rank
- #452 of 472 in NJ
Livability — Newark
- Score
- 67/100
- State rank
- #343
- US rank
- #11138
Category grades
Schools grade is shown separately in the Schools card above.
Census & demographics
- Census place
- Newark, NJ
- County
- Essex County · 825,405 people
- City population
- 310,602
- Metro
- New York-Newark-Jersey City, NY-NJ-PA
- Population (ZIP)
- 37,293
- Household income
- $51,534
- Rent vs Own
- Severe rent burden
- 2963.0
Population outlook (Essex County) Hauer SSP2
- Today (2025)
- 825,042 people
- By 2030
- 834,010 · +1.1%
- By 2040
- 846,221 · +2.6%
- By 2050
- 850,047 · +3.0%
- By 2075
- 837,009 · +1.5%
- By 2100
- 784,345 · -4.9%
Race, ethnicity, and origin ACS 2023
- Neighborhood character
- Predominantly Black (71%)
- Race & ethnicity
- Black 71% Hispanic / Latino 18% Two or more races 10% White 4% Asian 4%
- Hispanic origin (detail)
- Puerto Rican 7% Dominican 7%
- Common ancestry
- Hispanic 2%
- Foreign-born
- 23% · Canada, South Korea, United Kingdom
- Languages at home
- 71% English-only · Spanish 14% French/Haitian/Cajun 4% Other Indo-European 2%
Political lean MEDSL · Essex
- 2024 margin
- Solid D (+44.9) · D 71.7% · R 26.8% · Other 1.5%
- 2008→2024 swing
- -7.7pp toward R · 2008: 52.6pp · 2024: 44.9pp
- All cycles
- 2024: D+44.9 2020: D+55.4 2016: D+56.4 2012: D+55.5 2008: D+52.6
Not yet ingested
- Civics
- —
Market trends
- HPI YoY
- ▲ 2.18%
- Current HPI
- 301.5896
- Rent YoY
- ▲ 0.35%
- Metro
- New York-Newark-Jersey City, NY-NJ-PA
- State GDP YoY
- ▲ 2.05%
- F500 in state
- 34
Industry mix (Fortune 500 HQ in NJ)
| Industry | F500 HQs | Revenue |
|---|---|---|
| Consumer Goods | 3 | $31B |
|
||
| Pharmaceuticals | 2 | $153B |
|
||
| Technology | 2 | $21B |
|
||
| Insurance | 2 | $20B |
|
||
| Healthcare | 2 | $19B |
|
||
| Financial Services | 1 | $70B |
|
||
Price history
+150.0% since first listed12 events — show timeline
- 2026-02-21 Listed $599,900 NJMLS
- 2024-05-08 Delisted — NJMLS
- 2024-04-24 Contingent — NJMLS
- 2024-02-26 Relisted — NJMLS
- 2024-02-22 Delisted — NJMLS
- 2024-02-21 Listed $549,999 NJMLS
- 2024-02-21 Delisted — NJMLS
- 2024-02-07 Listed $575,000 NJMLS
- 2023-09-11 Sold (MLS) $230,000 GSMLS
- 2023-08-16 Delisted — GSMLS
- 2023-08-15 Pending — GSMLS
- 2023-07-13 Listed $239,999 GSMLS
Cash-flow waterfall
monthlySold comps — $/sqft
last 12 mo · ≤1 miLoading sold comps…