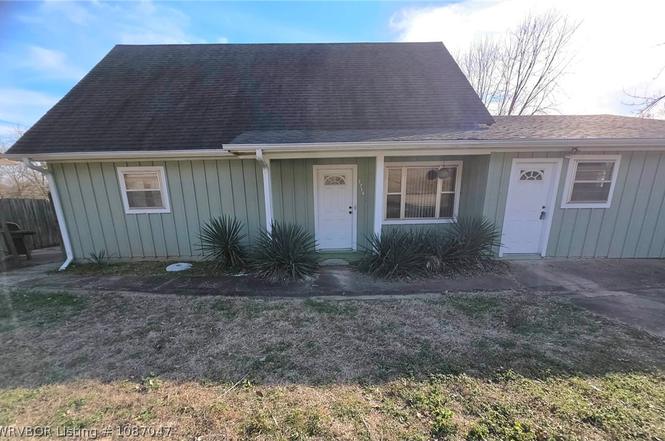
2714 Louisville St · Fort Smith, AR
Flood risk 1/10 · Minimal
- FEMA flood zone
- X (unshaded)
- Chance of flooding over 30 yrs
- 0.0%
- Est. flood insurance / yr
- $507 – $1,088
Fire risk 1/10 · Minimal
- Est. fire insurance / yr
- $1,499 – $2,785
Heat risk 6/10 · Moderate
- Hot days now (above 111°F)
- 7 days/yr
- Hot days in 30 yrs
- 19 days/yr
Wind risk 2/10 · Minimal
- Chance of severe wind over 30 yrs
- 3.0%
Air-quality risk 2/10 · Minimal
- Unhealthy air days now
- 0 days/yr
- Unhealthy air days in 30 yrs
- 1 days/yr
Risk factors via First Street. Map © Google.
Why this score? — see what drove the C grade
The composite is a weighted blend of 9 inputs, each scored 0–100. Each bar is that input's sub-score; the figure is the points it added to the 100-point composite (weight × sub-score).
- Cash flow +20.1/30.0
- ARV discount +15.0/15.0
- DSCR +6.4/10.0
- 1% rule +4.0/10.0
- Rent growth +3.6/5.0
- Livability +3.2/5.0
- Schools +3.1/10.0
- Condition / age +2.5/5.0
- Appreciation +0.0/10.0
$149,900
🖨 Deal sheet 📄 Offer letter ✓ Due diligence
Listing remarks
This home was built by the current seller and served his family well. It is spacious and has lots of potential for the next family to make it their own. It has some wonderful mid century features such as the family room fireplace, which is a must see! There is lots of storage space. The back yard features a large swimming pool with a pool house that includes a sauna and a full bathroom. There is even a treehouse/playhouse ready for a revamp for the next generation. The home is close to everything one could need in Fort Smith and minutes from the interstate for travel. Call today to see it all for yourself!
Key facts
- Sauna
- Pool house
- Treehouse/playhouse
Tags
Property features AI
Exterior
- Parking: Concrete parking
- Utilities: Public water; Public sewer; Electricity available; Natural gas available; Cable available; Sewer available; Water available
- Home design: Single-family residence; Two stories; House
- Construction: Cedar construction; Asphalt shingle roof; Slab foundation; Built as a residential house
- Exterior features: Patio; Back yard fencing; Private in-ground pool; Outbuilding; Sloped city lot; Public maintained road
Interior
- Kitchen: Dishwasher; Disposal
- Flooring: Carpet; Laminate
- Bathrooms: 2 full bathrooms
- Heating & cooling: Central heating; Central air; Ceiling fans
- Interior features: Sauna; Ceiling fans; Storage; Walk-in closets; Drapes; Gas water heater; Wood-burning stove (free standing) in family room; One fireplace
- Laundry & utility: Washer hookup; Electric dryer hookup
Neighborhood map
What this means for you Summary
Snapshot
- This is a 3-bed/2.0-bath single-family listed at $150k.
Deal economics
- At list price, monthly cash flow is $187 ($2k/yr) — positive.
- The deal already cash-flows at list — no discount required.
- To meet the 1% rule (rent ≥ 1% of price), the offer needs to be $134k (10.4% below list).
- Recommended offer: $132k (12.0% below list) — sets the bar for market timing.
- Cap rate 7.8% vs local median 4.3% in Fort Smith — top-decile yield for the area; either an underpriced asset or a hidden risk that comps aren't pricing in. Stress-test before assuming the spread holds.
Location & tenants
- Location reads 65/100 on livability (#151 in AR) — a middle-class / working-renter tenant base. Strengths: cost of living A+, housing A+, health & safety A+; Watch: crime F, amenities F, commute F.
- Fort Smith School District (urban): math 35% / reading 39% proficiency, ranked #106 of 238 in AR (top 44%) — families likely to look elsewhere, expect single-tenant / working-renter base with shorter leases; 64% free/reduced lunch — lower-income household profile, screen leases tightly.
- Zoned schools: Raymond F. Orr Elem. School (math 36% / reading 33%, grade F, #254 of 454 statewide, top 59%, 306 students, 77% FRL); Ramsey Junior High School (math 37% / reading 47%, grade D-, #78 of 201 statewide, top 40%, 832 students, 67% FRL); Southside High School (math 36% / reading 53%, grade F, #31 of 292 statewide, top 12%, 1,956 students, 47% FRL) — zoned schools at 64% FRL track the district average.
- Market conditions: Rents rising fast (+4.4%/yr); 174 active listings in the ZIP; 3 comparable units currently listed for rent nearby; rentals at typical pace (median 21d on market — plan ~3-4 weeks tenant-placement turnaround); lower-income renter base — watch delinquency; 388 units permitted in Sebastian County in 2024 (16 in 5+ unit buildings).
- This rent runs 38% of the median local income ($43k/yr) — at the standard rent-burdened threshold; future hikes will face affordability resistance.
Forward outlook
- Local home prices are declining (-3.0%/yr); year-one equity from $1k of loan paydown is wiped out by about $4k of value loss. Plan a longer hold.
- Sebastian County population projected at +7% by 2050 — modest demand growth; plan on rents tracking national, not racing it.
Negotiation context
- It's been on market 125 days — a 12% lower offer ($132k) is reasonable based on typical stale-listing flexibility.
Risks & watch-outs
- Climate carrying-cost: extreme-heat days projected 7→19/yr by 2055 (HVAC capex compounding) — expect insurance premiums to compound above CPI over the hold.
Questions for the listing agent
- It's been on market 125 days. Have you received any prior offers? Is the seller open to a 12% concession, seller financing, or rate buy-down credit?
- Built in 1968 — when were the roof, HVAC, electrical panel, plumbing, and water heater last replaced?
- Why hasn't it sold? Are there any deal-killer items the seller is aware of (foundation, flood, title, zoning, code violations)?
- Is there a deadline driving the sale (1031 exchange, divorce, estate, relocation)? That informs how much negotiation room exists.
- Schools are D-rated, which usually means shorter tenancies and higher turnover. Who's the typical renter profile here, and what's been the actual vacancy rate?
- Crime grade is F in this area — have there been break-ins, vandalism, or insurance claims at this property in the last 3 years? What carrier currently insures it and at what premium?
- What's the average days-on-market for RENTAL listings here right now (not sales)? A rising rental-DOM trend means longer vacancies and softer asking-rent achievability than the comps imply.
- What's the recent tenant-quality profile in this submarket — average credit score on applications, eviction rate, late-payment / NSF rate, and stable-employment percentage? A property-management company in the area should have these aggregated.
- How much new for-sale + rental construction is in the pipeline within 1–3 miles? Heavy new supply typically softens prices + rents 12–24 months out; constrained supply supports both.
Investment metrics
- 1% rule
- 0.90% ✗
- Cap rate
- 7.79%
- Cash-on-cash
- 5.33%
- DSCR
- 1.24
- GRM
- 9.3
CMA / ARV
- ARV (on-the-fly)
- $222,768
- Comps found
- 12
Show comp detail 12 sales within ~0.75 mi
| Address | Dist | Beds/Ba | Sqft | Sold | Price | $/sf | Match |
|---|---|---|---|---|---|---|---|
| 4308 S 25th St | 0.16mi | 4/2.5 (+1) | 1,958 (+3%) | 7mo | $193,000 | $99 | 75 |
| 2523 Independence St | 0.41mi | 3/2.5 | 1,933 (+2%) | 10mo | $205,000 | $106 | 68 |
| 2823 Jackson St | 0.31mi | 3/2.5 | 1,980 (+4%) | 12mo | $247,500 | $125 | 67 |
| 2800 Ionia St | 0.31mi | 3/2.0 | 2,002 (+5%) | 13mo | $90,000 | $45 | 66 |
| 3121 S Cliff Dr | 0.34mi | 3/2.0 | 2,034 (+7%) | 10mo | $225,000 | $111 | 65 |
| 3404 S 33rd Cir | 0.67mi | 3/2.0 | 1,850 (-3%) | 2mo | $219,000 | $118 | 62 |
| 2420 Independence St | 0.40mi | 4/3.0 (+1) | 2,011 (+6%) | 4mo | $249,900 | $124 | 60 |
| 4815 S 32nd St | 0.51mi | 3/2.0 | 1,730 (-9%) | 8mo | $168,000 | $97 | 54 |
| 5 Old Greenwood Ln | 0.70mi | 3/2.0 | 1,799 (-6%) | 5mo | $205,000 | $114 | 54 |
| 2516 Houston St | 0.47mi | 3/3.0 | 2,140 (+12%) | 8mo | $353,000 | $165 | 46 |
| 3215 S Fresno St | 0.73mi | 3/2.0 | 1,636 (-14%) | 13mo | $220,000 | $134 | 32 |
| 1922 Utica St | 0.75mi | 3/2.0 | 1,622 (-15%) | 11mo | $189,000 | $117 | 31 |
Match score weights: distance 35% · size 25% · config 20% · recency 20%. Top-matched comps best support the ARV.
Projected returns pro-forma
-3.0% appreciation · 4.37% rent growth · sell at horizon
- IRR
- -6.7%
- Equity multiple
- 0.75×
- Total profit
- $-10,610
- Equity at exit
- $22,351
- IRR
- 4.2%
- Equity multiple
- 1.33×
- Total profit
- $13,659
- Equity at exit
- $12,961
Cash invested: $41,972 (down + closing). Projections, not guarantees.
Landlord ↔ Tenant lean methodology
- Overall (STATE)
- 92 Strongly Landlord-Friendly
- State Arkansas
- 92 Strongly Landlord-Friendly · R+14
- County
- — inherits STATE
- City
- — inherits STATE
ZIP-level market 72901
- Rents YoY
- 4.4%
- Active inventory
- 174
- Price-to-rent
- 9.3×
Monthly cashflow live
- Estimated rent
- $1,343 medium interval (Pro) →
- Mortgage (P&I)
- −$786
- Tax from tax record
- −$26 /mo · $309/yr
- Insurance
- −$62
- HOA
- −$0
- Vacancy / Maint / Mgmt
- −$282
- Net cashflow
- $187
Break-even live
UW: 25.0% down · 7.5% · 30yr · 1.5% tax · 5.0% vac · 8.0% maint · 8.0% mgmt
Financing live
Cash to close
- Down payment
- $37,475
- Closing costs
- $4,497
- Reserves months
- —
- Total cash needed
- —
Loan-product check · same deal, 3 products live
Conventional
25% down · 7.5% · 30yr
- Down + closing
- —
- Monthly P&I
- —
- Monthly cashflow
- —
- DSCR
- —
- Eligible?
- —
Personal DTI + credit; lowest rate.
DSCR
20% down · 8.5% · 30yr
- Down + closing
- —
- Monthly P&I
- —
- Monthly cashflow
- —
- DSCR
- —
- Eligible?
- —
No personal income docs; deal must DSCR.
Hard money
10% down · 12.0% · 12mo
- Down + closing
- —
- Monthly P&I
- —
- Monthly cashflow
- —
- DSCR
- —
- Eligible?
- —
Short-term bridge; refi at stabilization.
Rent comps 3 comps
| Address | Beds | Baths | Sqft | Rent | $/sqft | DOM | Units | Dist |
|---|---|---|---|---|---|---|---|---|
| 3700 Dallas St Fort Smith, AR | 3.0 | 2.0 | 1544 | $1,795 | $1.16 | 21d | 1 | 1.01mi |
| 2800 Wharton Cir Unit 2323 Fort Smith, AR | 2.0 | 2.0 | 1240 | $925 | $0.75 | 13d | 1 | 1.20mi |
| 2307 S 23rd St Fort Smith, AR | 3.0 | 2.5 | 1356 | $1,595 | $1.18 | 21d | 1 | 1.34mi |
Listing history 18 events
-
2026-06-19days on market $149,900 Active 125 DOM
-
2026-06-18days on market $149,900 Active 124 DOM
-
2026-06-17days on market $149,900 Active 123 DOM
-
2026-06-16days on market $149,900 Active 122 DOM
-
2026-06-15days on market $149,900 Active 121 DOM
-
2026-06-14days on market $149,900 Active 119 DOM
-
2026-06-13days on market $149,900 Active 118 DOM
-
2026-06-10days on market $149,900 Active 116 DOM
-
2026-06-09days on market $149,900 Active 115 DOM
-
2026-06-08days on market $149,900 Active 114 DOM
-
2026-06-07days on market $149,900 Active 113 DOM
-
2026-06-03days on market $149,900 Active 109 DOM
-
2026-06-02days on market $149,900 Active 108 DOM
-
2026-06-01days on market $149,900 Active 107 DOM
-
2026-05-31days on market $149,900 Active 106 DOM
-
2026-05-30days on market $149,900 Active 105 DOM
-
2026-04-04price $199,900
-
2026-02-13$224,900 Active
ⓘ Source: listings_history table (triggers on properties + properties_extension) + one-shot
backfill from property_details.listing_events for pre-trigger history.
Tax reassessment forecast AR · Resets to sale price
- Current annual tax
- $309 · $26/mo
- Projected year-2 tax
- $959 · $80/mo
- Expected delta
- +$650/yr (+$54/mo · 210.5%)
ⓘ Screening estimate from a state-policy table — verify with the county assessor before closing.
Climate risk First Street
- Flood 1/10 Low FEMA zone X (unshaded) · 0% chance over 30 yrs
- Wildfire 1/10 Low
- Heat 6/10 Major 7 d/yr ≥111°F today · 19 d/yr by 30 yrs out
- Wind 2/10 Low 3% chance of damaging wind over 30 yrs
- Air quality 2/10 Low 0 unhealthy d/yr today · 1 by 30 yrs out
Nearby sold comps map
Loading sold comps map…
Walkable amenities ~0.75 mi
Loading nearby amenities…
Taxation est. · year 1
- Rental income
- $16,115
- − Mortgage interest
- −$8,397
- − Property taxes
- −$309
- − Insurance
- −$750
- − Repairs & maintenance
- −$1,289
- − Management
- −$1,289
- − Depreciation
- −$4,361
- Taxable loss
- −$280
- Est. tax savings @ 24.0%
- +$67
- After-tax cash flow
- $2,306/yr
For passive investors: Depreciation is non-cash, so a rental often shows a tax loss while cash-flowing — sheltering income. Rental losses are passive: they offset passive income freely, and up to $25,000/yr can offset ordinary (W-2) income if you actively participate and your MAGI is under $100k (phasing out to $0 by $150k); unused losses carry forward. On sale, claimed depreciation is recaptured at up to 25%, and gains may owe capital-gains tax (a 1031 exchange can defer both). Figures are a year-1 estimate at your 24.0% rate — not tax advice; consult a CPA.
Schools (NCES district)
- District
- Fort Smith School District
- NCES district ID
- 0506330
- Math proficiency
- 35% ▼ -11.00%
- Reading proficiency
- 39% ▼ -7.00%
- Median HH income
- $36,066
- Composite
- 30.66/100
- National rank
- #6183
- State rank
- #106 of 238 in AR
Livability — Fort Smith
- Score
- 65/100
- State rank
- #151
- US rank
- #13185
Category grades
Schools grade is shown separately in the Schools card above.
Census & demographics
- Census place
- Fort Smith, AR
- County
- Sebastian County · 99,312 people
- City population
- 94,356
- Metro
- Fort Smith, AR-OK
- Population (ZIP)
- 19,819
- Household income
- $42,851
- Rent vs Own
- Severe rent burden
- 1117.0
Population outlook (Sebastian County) Hauer SSP2
- Today (2025)
- 133,992 people
- By 2030
- 136,620 · +2.0%
- By 2040
- 140,832 · +5.1%
- By 2050
- 143,301 · +6.9%
- By 2075
- 147,964 · +10.4%
- By 2100
- 145,848 · +8.8%
Race, ethnicity, and origin ACS 2023
- Neighborhood character
- Diverse neighborhood (Simpson 0.60)
- Race & ethnicity
- White 60% Hispanic / Latino 17% Two or more races 12% Black 10% Asian 2%
- Hispanic origin (detail)
- Mexican 11% Puerto Rican 1%
- Common ancestry
- Slovak 2% Lithuanian 2% Italian 1%
- Foreign-born
- 9% · Canada, Vietnam, Guatemala
- Languages at home
- 83% English-only · Spanish 14% Other Asian/Pacific 1% Vietnamese 1%
Political lean MEDSL · Sebastian
- 2024 margin
- Solid R (+37.5) · D 30.0% · R 67.6% · Other 2.4%
- 2008→2024 swing
- -2.9pp toward R · 2008: -34.6pp · 2024: -37.5pp
- All cycles
- 2024: R+37.5 2020: R+35.5 2016: R+38.1 2012: R+37.1 2008: R+34.6
Not yet ingested
- Civics
- —
Market trends
- HPI YoY
- ▼ -173.82%
- Current HPI
- 172.3777
- Rent YoY
- ▲ 4.37%
- Metro
- Fort Smith, AR-OK
- State GDP YoY
- ▲ 3.80%
- F500 in state
- 10
Industry mix (Fortune 500 HQ in AR)
| Industry | F500 HQs | Revenue |
|---|---|---|
| Retail | 1 | $681B |
|
||
| Food / Agriculture | 1 | $53B |
|
||
| Retail / Energy | 1 | $22B |
|
||
| Transportation / Logistics | 1 | $12B |
|
||
| Energy | 1 | $4B |
|
||
Price history
-11.1% since first listed2 events — show timeline
- 2026-04-04 Price Changed $199,900 WRVBOR
- 2026-02-13 Listed $224,900 WRVBOR
Property tax history
+5.3%/yrLatest (2025): $309 · +7.7% YoY. Source: county tax records.
Cash-flow waterfall
monthlySold comps — $/sqft
last 12 mo · ≤1 miLoading sold comps…