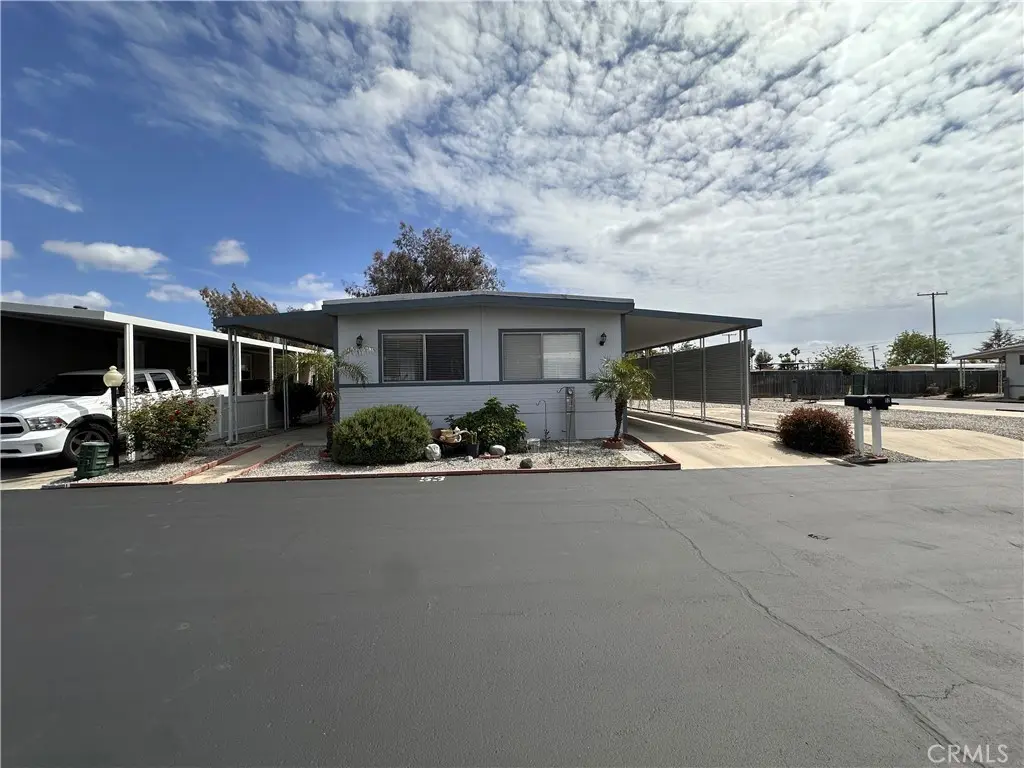
655 E Main #53 · San Jacinto, CA
Flood risk 4/10 · Minor
- FEMA flood zone
- X
- Chance of flooding over 30 yrs
- 0.22%
- Est. flood insurance / yr
- $507 – $1,088
Fire risk 8/10 · Major
- Est. fire insurance / yr
- $659 – $1,223
Heat risk 8/10 · Major
- Hot days now (above 103°F)
- 6 days/yr
- Hot days in 30 yrs
- 18 days/yr
Wind risk 1/10 · Minimal
- Chance of severe wind over 30 yrs
- —
Air-quality risk 6/10 · Moderate
- Unhealthy air days now
- 11 days/yr
- Unhealthy air days in 30 yrs
- 13 days/yr
Risk factors via First Street. Map © Google.
Why this score? — see what drove the C+ grade
The composite is a weighted blend of 9 inputs, each scored 0–100. Each bar is that input's sub-score; the figure is the points it added to the 100-point composite (weight × sub-score).
- Cash flow +30.0/30.0
- 1% rule +10.0/10.0
- DSCR +10.0/10.0
- Condition / age +3.8/5.0
- Rent growth +3.2/5.0
- Livability +3.2/5.0
- ARV discount +2.5/15.0
- Schools +2.1/10.0
- Appreciation +0.0/10.0
$80,000
🖨 Deal sheet (PDF) 📄 Offer letter ✓ Due diligence
Listing remarks
Beautiful and well-maintained manufactured home featuring 2 bedrooms and 2 bathrooms. This property offers a spacious interior with a convenient indoor laundry room. The home is clean and well cared for both inside and out, making it truly move-in ready. Ideally located just minutes from local schools (approximately 7 minutes) and close to shopping centers, dining, and everyday conveniences. A perfect opportunity for comfortable and affordable living—don’t miss out!
Key facts
- Close to dining
- Indoor laundry room
- Move in ready
Tags
Property features AI
Finance
- Other: Lot density: 0-1 unit per acre; Living area source: Assessor's data
- HOA & community: Senior community; Land lease of $660 per month
Exterior
- Parking: Located in Caravana Estates
- Utilities: Public sewer; District/public water
- Home design: Single-story mobile home (12' x 57'); Mobile home remains on site
- Construction: Year built (per assessor); Double-wide body type
- Exterior features: Community pool; Sidewalks
Interior
- Bathrooms: 2 full bathrooms
- Heating & cooling: Central furnace heating
- Interior features: One-level layout; Front entry
- Laundry & utility: Interior laundry
Neighborhood map
What this means for you Summary
Snapshot
- This is a 2-bed/2.0-bath manufactured listed at $80k. Condition is rated good.
Deal economics
- At list price, monthly cash flow is $1k ($14k/yr) — positive.
- The deal already cash-flows at list — no discount required.
- Meets the 1% rule at list price ($2k rent vs $80k).
- Recommended offer: $78k (3.0% below list) — sets the bar for market timing.
- Cap rate 23.6% vs local median 3.8% in San Jacinto — top-decile yield for the area; either an underpriced asset or a hidden risk that comps aren't pricing in. Stress-test before assuming the spread holds.
Location & tenants
- Location reads 63/100 on livability (#467 in CA) — a middle-class / working-renter tenant base. Strengths: housing A+; Watch: employment D+, amenities F, cost of living F.
- San Jacinto Unified (suburban): math 13% / reading 36% proficiency, ranked #421 of 517 in CA (top 81%) — low school quality limits family demand, transient renter base, plan for 1-2y turnover; 68% free/reduced lunch — lower-income household profile, screen leases tightly.
- Zoned schools: Estudillo Elementary (726 students, 82% FRL); North Mountain Middle (math 24% / reading 24%, grade F, #277 of 498 statewide, top 73%, 844 students, 90% FRL); San Jacinto High (math 14% / reading 38%, grade F, #807 of 1,170 statewide, top 69%, 2,617 students, 85% FRL) — zoned schools average 86% FRL vs 68% district-wide (18 pts higher); higher-poverty schools than district average — tighter screening recommended.
- Market conditions: Rents rising (+2.6%/yr); 160 active listings in the ZIP; 23 comparable units currently listed for rent nearby; rentals at typical pace (median 26d on market — plan ~3-4 weeks tenant-placement turnaround); 9,195 units permitted in Riverside County in 2024 (1,512 in 5+ unit buildings).
- This rent runs 38% of the median local income ($68k/yr) — at the standard rent-burdened threshold; future hikes will face affordability resistance.
Forward outlook
- Local home prices are declining (-3.0%/yr); year-one equity from $553 of loan paydown is wiped out by about $2k of value loss. Plan a longer hold.
- Riverside County population projected at +22% by 2050 — long-run rental-demand tailwind backs the buy-and-hold thesis.
- At projected returns (-3.0% appreciation + 2.6% rent growth), your $22k cash investment doubles in ~2 years — after that, you're playing with house money.
Negotiation context
- It's been on market 55 days — a 3% lower offer ($78k) is reasonable based on typical stale-listing flexibility.
Risks & watch-outs
- Climate carrying-cost: severe wildfire risk; extreme-heat days projected 6→18/yr by 2055 (HVAC capex compounding) — expect insurance premiums to compound above CPI over the hold.
Questions for the listing agent
- It's been on market 55 days. Have you received any prior offers? Is the seller open to a 3% concession, seller financing, or rate buy-down credit?
- Built in 1970 — when were the roof, HVAC, electrical panel, plumbing, and water heater last replaced?
- Is there a deadline driving the sale (1031 exchange, divorce, estate, relocation)? That informs how much negotiation room exists.
- Schools are D-rated, which usually means shorter tenancies and higher turnover. Who's the typical renter profile here, and what's been the actual vacancy rate?
- What's the average days-on-market for RENTAL listings here right now (not sales)? A rising rental-DOM trend means longer vacancies and softer asking-rent achievability than the comps imply.
- What's the recent tenant-quality profile in this submarket — average credit score on applications, eviction rate, late-payment / NSF rate, and stable-employment percentage? A property-management company in the area should have these aggregated.
- How much new for-sale + rental construction is in the pipeline within 1–3 miles? Heavy new supply typically softens prices + rents 12–24 months out; constrained supply supports both.
Investment metrics
- 1% rule
- 2.70% ✓
- Cap rate
- 23.60%
- Cash-on-cash
- 61.81%
- DSCR
- 3.75
- GRM
- 3.1
CMA / ARV
- ARV (median comp)
- $72,003
- List price
- $80,000
- Delta
- 11.11%
- Verdict
- OVERPRICED
- Comps
- 4 within 1.0 mi
Show comp detail 3 sales within ~0.75 mi
| Address | Dist | Beds/Ba | Sqft | Sold | Price | $/sf | Match |
|---|---|---|---|---|---|---|---|
| 655 E Main #83 | 0.05mi | 3/2.0 (+1) | 1,440 (+5%) | 1mo | $80,000 | $56 | 83 |
| 655 E Main St #1 | 0.05mi | 2/2.0 | 1,440 (+5%) | 19mo | $120,000 | $83 | 73 |
| 335 E Mead | 0.45mi | 3/2.0 (+1) | 1,426 (+4%) | 5mo | $385,000 | $270 | 63 |
Match score weights: distance 35% · size 25% · config 20% · recency 20%. Top-matched comps best support the ARV.
Projected returns pro-forma
-3.0% appreciation · 2.61% rent growth · sell at horizon
- IRR
- 60.3%
- Equity multiple
- 3.67×
- Total profit
- $59,714
- Equity at exit
- $11,928
- IRR
- 64.8%
- Equity multiple
- 7.40×
- Total profit
- $143,321
- Equity at exit
- $6,917
Cash invested: $22,400 (down + closing). Projections, not guarantees.
Landlord ↔ Tenant lean methodology
- Overall (STATE)
- 18 Strongly Tenant-Friendly
- State California
- 18 Strongly Tenant-Friendly · D+13
- County
- — inherits STATE
- City
- — inherits STATE
ZIP-level market 92583
- Home prices YoY
- -14.8%
- Rents YoY
- 2.6%
- Active inventory
- 160
- Price-to-rent
- 3.1×
Monthly cashflow live
- Estimated rent
- $2,160 high interval (Pro) →
- Mortgage (P&I)
- −$420
- Tax est. 1.5%
- −$100 /mo · $1,200/yr
- Insurance
- −$33
- HOA
- −$0
- Vacancy / Maint / Mgmt
- −$454
- Net cashflow
- $1,154
Break-even live
Sensitivity live
| Price | -10% $1,209 | -5% $1,181 | +0% $1,154 | +5% $1,126 | +10% $1,099 |
|---|---|---|---|---|---|
| Rent | -10% $983 | -5% $1,069 | +0% $1,154 | +5% $1,239 | +10% $1,325 |
| Rate | -1.0pp $1,194 | -0.5pp $1,174 | base $1,154 | +0.5pp $1,133 | +1.0pp $1,112 |
UW: 25.0% down · 7.5% · 30yr · 1.5% tax · 5.0% vac · 8.0% maint · 8.0% mgmt
Financing live
Cash to close
- Down payment
- $20,000
- Closing costs
- $2,400
- Reserves months
- —
- Total cash needed
- —
Loan-product check · same deal, 3 products live
Conventional
25% down · 7.5% · 30yr
- Down + closing
- —
- Monthly P&I
- —
- Monthly cashflow
- —
- DSCR
- —
- Eligible?
- —
Personal DTI + credit; lowest rate.
DSCR
20% down · 8.5% · 30yr
- Down + closing
- —
- Monthly P&I
- —
- Monthly cashflow
- —
- DSCR
- —
- Eligible?
- —
No personal income docs; deal must DSCR.
Hard money
10% down · 12.0% · 12mo
- Down + closing
- —
- Monthly P&I
- —
- Monthly cashflow
- —
- DSCR
- —
- Eligible?
- —
Short-term bridge; refi at stabilization.
Rent comps 23 comps
| Address | Beds | Baths | Sqft | Rent | $/sqft | DOM | Units | Dist |
|---|---|---|---|---|---|---|---|---|
| 620 E Main St San Jacinto, CA | 2.0 | 2.0 | 900 | $1,600 | $1.78 | 26d | 1 | 0.12mi |
| 621 S Mistletoe Ave San Jacinto, CA | 2.0 | 2.0 | 1500 | $2,000 | $1.33 | 45d | 1 | 0.34mi |
| 492 Foursquare Pl San Jacinto, CA | 3.0 | 2.0 | 1573 | $3,500 | $2.23 | 0d | 1 | 0.38mi |
| 700 Minor St San Jacinto, CA | 2.0 | 1.0 | 878 | $1,600 | $1.82 | 45d | 1 | 0.47mi |
| 700 Minor St San Jacinto, CA | 2.0 | 1.0 | 878 | $1,700 | $1.94 | 26d | 1 | 0.47mi |
| 344 E 6th St San Jacinto, CA | 2.0 | 1.0 | 900 | $1,900 | $2.11 | 26d | 1 | 0.49mi |
| 748 Minor St Apt F San Jacinto, CA | 2.0 | 1.0 | 878 | $1,600 | $1.82 | 45d | 1 | 0.49mi |
| 784 Minor St Unit B San Jacinto, CA | 2.0 | 1.0 | 878 | $1,700 | $1.94 | 26d | 1 | 0.51mi |
| 800 Minor St San Jacinto, CA | 2.0 | 1.0 | 878 | $1,600 | $1.82 | 0d | 1 | 0.53mi |
| 646 Field Maple Pl GLMN HOT SPGS, CA | 3.0–4.0 | 2.0–3.0 | 1825 | $2,850 | $1.56 | 0d | 9 | 0.57mi |
| 795 Minor St Unit A San Jacinto, CA | 2.0 | 1.0 | 878 | $1,700 | $1.94 | 26d | 1 | 0.58mi |
| 1129 Osprey St San Jacinto, CA | 3.0 | 2.0 | 1582 | $2,700 | $1.71 | 45d | 1 | 0.63mi |
| 1354 Yorktown Cir San Jacinto, CA | 2.0 | 2.0 | 1106 | $2,100 | $1.90 | 45d | 1 | 0.79mi |
| 249 Idyllwild Dr San Jacinto, CA | 3.0 | 2.0 | 1025 | $2,300 | $2.24 | 45d | 1 | 0.85mi |
| 289 Brown St San Jacinto, CA | 2.0 | 1.0 | 1400 | $2,300 | $1.64 | 45d | 1 | 0.94mi |
| 165 Tiger Ln San Jacinto, CA | 2.0 | 2.0 | 1339 | $2,150 | $1.61 | 4d | 1 | 1.17mi |
| 419 Angela Way San Jacinto, CA | 3.0 | 1.0 | 988 | $2,150 | $2.18 | 16d | 1 | 1.17mi |
| N Santa Fe St GLMN HOT SPGS, CA | 2.0–3.0 | 2.0 | 1053 | $2,350 | $2.23 | 0d | 2 | 1.20mi |
| 1569 Willowcreek Loop San Jacinto, CA | 2.0 | 1.5 | 921 | $2,100 | $2.28 | 26d | 1 | 1.22mi |
| 904 Bergamo Ave San Jacinto, CA | 2.0 | 2.0 | 1596 | $2,600 | $1.63 | 11d | 1 | 1.24mi |
| 1555 S Santa Fe Ave San Jacinto, CA | 3.0 | 2.0 | 1161 | $2,300 | $1.98 | 26d | 1 | 1.25mi |
| 1775 S Santa Fe Ave San Jacinto, CA | 3.0 | 2.0 | 1300 | $2,850 | $2.19 | 0d | 1 | 1.38mi |
| 905 Verona Ave San Jacinto, CA | 2.0 | 2.0 | 1417 | $2,300 | $1.62 | 19d | 1 | 1.38mi |
Listing history 16 events
-
2026-06-21days on market $80,000 Active 55 DOM
-
2026-06-18days on market $80,000 Active 52 DOM
-
2026-06-17days on market $80,000 Active 51 DOM
-
2026-06-16days on market $80,000 Active 50 DOM
-
2026-06-15days on market $80,000 Active 49 DOM
-
2026-06-13days on market $80,000 Active 47 DOM
-
2026-06-13days on market $80,000 Active 46 DOM
-
2026-06-09days on market $80,000 Active 43 DOM
-
2026-06-08days on market $80,000 Active 42 DOM
-
2026-06-07days on market $80,000 Active 41 DOM
-
2026-06-04days on market $80,000 Active 38 DOM
-
2026-06-03days on market $80,000 Active 37 DOM
-
2026-06-02days on market $80,000 Active 36 DOM
-
2026-06-01days on market $80,000 Active 35 DOM
-
2026-05-31days on market $80,000 Active 34 DOM
-
2026-04-27$80,000 Active 482-char remark
ⓘ Source: listings_history table (triggers on properties + properties_extension) + one-shot
backfill from property_details.listing_events for pre-trigger history.
Climate risk First Street
- Flood 4/10 Moderate FEMA zone X · 22% chance over 30 yrs
- Wildfire 8/10 Severe
- Heat 8/10 Severe 6 d/yr ≥103°F today · 18 d/yr by 30 yrs out
- Wind 1/10 Low
- Air quality 6/10 Major 11 unhealthy d/yr today · 13 by 30 yrs out
Nearby sold comps map
Loading sold comps map…
Walkable amenities ~0.75 mi
Loading nearby amenities…
Taxation est. · year 1
- Rental income
- $25,925
- − Mortgage interest
- −$4,481
- − Property taxes
- −$1,200
- − Insurance
- −$400
- − Repairs & maintenance
- −$2,074
- − Management
- −$2,074
- − Depreciation
- −$2,327
- Taxable income
- $13,368
- Est. tax owed @ 24.0%
- −$3,208
- After-tax cash flow
- $10,638/yr
For passive investors: Depreciation is non-cash, so a rental often shows a tax loss while cash-flowing — sheltering income. Rental losses are passive: they offset passive income freely, and up to $25,000/yr can offset ordinary (W-2) income if you actively participate and your MAGI is under $100k (phasing out to $0 by $150k); unused losses carry forward. On sale, claimed depreciation is recaptured at up to 25%, and gains may owe capital-gains tax (a 1031 exchange can defer both). Figures are a year-1 estimate at your 24.0% rate — not tax advice; consult a CPA.
Condition & rehab AI · 12 photos
This move-in ready manufactured home is in good condition with minimal repairs needed. Upgrades to the exterior and interior can significantly enhance its value.
Value-add opportunities
- Both Paint exterior and interior walls — Enhances curb appeal and interior aesthetics
- Both Replace carpet with hardwood or tile flooring — Improves durability and adds value
- Both Upgrade kitchen appliances — Modernizes the space and adds value
- Both Install new windows — Improves energy efficiency and adds value
Renovation cost estimate screening
Value-add ROI direction
- Both Paint exterior and interior walls — Enhances curb appeal and interior aesthetics ↑
- Both Replace carpet with hardwood or tile flooring — Improves durability and adds value ↑
- Both Upgrade kitchen appliances — Modernizes the space and adds value ↑
- Both Install new windows — Improves energy efficiency and adds value ↑
ⓘ Cost ranges are severity-bucket heuristics (US national rule-of-thumb). Get contractor quotes + a written scope before underwriting a rehab budget.
Schools (NCES district)
- District
- San Jacinto Unified
- NCES district ID
- 0634440
- Math proficiency
- 13% ▼ -9.00%
- Reading proficiency
- 36% ▬ 0.00%
- Median HH income
- $43,560
- Composite
- 20.94/100
- National rank
- #8478
- State rank
- #421 of 517 in CA
Livability — San Jacinto
- Score
- 63/100
- State rank
- #467
- US rank
- #15889
Category grades
Schools grade is shown separately in the Schools card above.
Census & demographics
- Census place
- San Jacinto, CA
- County
- Riverside County · 2,287,001 people
- City population
- 33,778
- Metro
- Riverside-San Bernardino-Ontario, CA
- Population (ZIP)
- 33,778
- Household income
- $68,351
- Rent vs Own
- Severe rent burden
- 747.0
Population outlook (Riverside County) Hauer SSP2
- Today (2025)
- 2,664,475 people
- By 2030
- 2,802,692 · +5.2%
- By 2040
- 3,050,904 · +14.5%
- By 2050
- 3,256,783 · +22.2%
- By 2075
- 3,655,058 · +37.2%
- By 2100
- 3,766,594 · +41.4%
Race, ethnicity, and origin ACS 2023
- Neighborhood character
- Diverse neighborhood (Simpson 0.57)
- Race & ethnicity
- Hispanic / Latino 60% White 26% Two or more races 23% Black 5% Asian 3% Native American 3%
- Hispanic origin (detail)
- Mexican 52%
- Common ancestry
- Lithuanian 1% Iranian 1% Portuguese 1%
- Foreign-born
- 20% · Canada
- Languages at home
- 56% English-only · Spanish 40% Tagalog/Filipino 2% Other Asian/Pacific 1%
Political lean MEDSL · Riverside
- 2024 margin
- Toss-up / Even · D 48.0% · R 49.3% · Other 2.6%
- 2008→2024 swing
- -3.6pp toward R · 2008: 2.3pp · 2024: -1.3pp
- All cycles
- 2024: R+1.3 2020: D+8.0 2016: D+4.3 2012: R+0.4 2008: D+2.3
Not yet ingested
- Civics
- —
Market trends
- HPI YoY
- ▼ -71.15%
- Current HPI
- 407.8584
- Rent YoY
- ▲ 2.61%
- Metro
- Riverside-San Bernardino-Ontario, CA
- State GDP YoY
- ▲ 3.21%
- F500 in state
- 116
Industry mix (Fortune 500 HQ in CA)
| Industry | F500 HQs | Revenue |
|---|---|---|
| Technology | 27 | $1,492B |
|
||
| Financial Services | 3 | $174B |
|
||
| Retail | 3 | $44B |
|
||
| Insurance | 3 | $26B |
|
||
| Media / Entertainment | 2 | $115B |
|
||
| Pharmaceuticals / Biotech | 2 | $62B |
|
||
Price history
1 event — show timeline
- 2026-04-27 Listed $80,000 CRMLS
Cash-flow waterfall
monthlySold comps — $/sqft
last 12 mo · ≤1 miLoading sold comps…