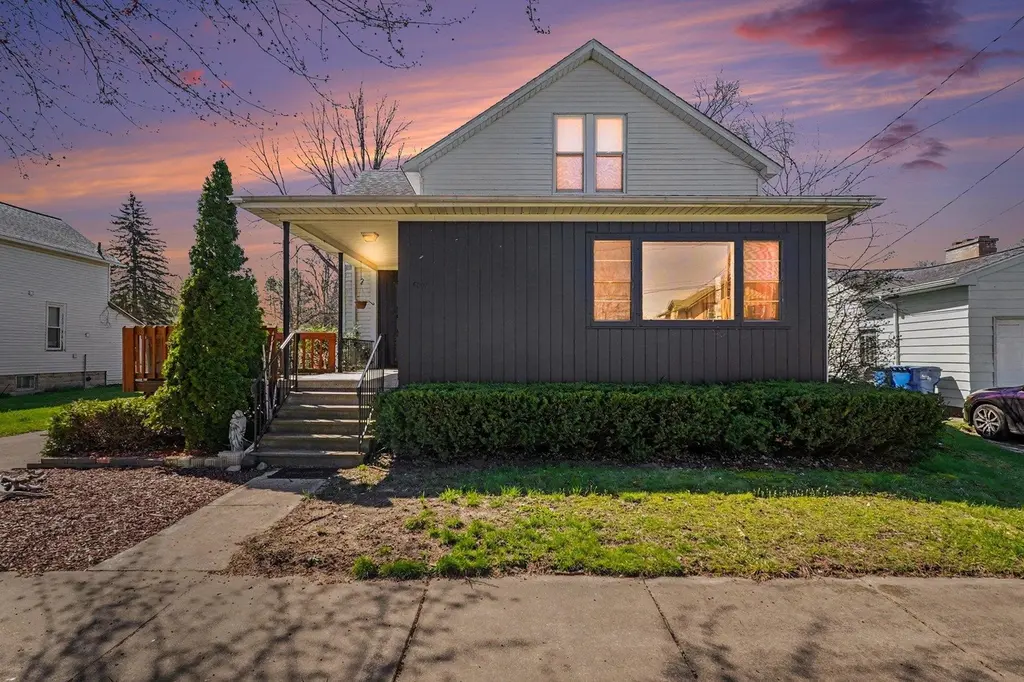
708 Nebobish Ave · Bay City, MI
Flood risk 1/10 · Minimal
- FEMA flood zone
- X (unshaded)
- Chance of flooding over 30 yrs
- 0.0%
- Est. flood insurance / yr
- $473 – $860
Fire risk 1/10 · Minimal
- Est. fire insurance / yr
- $784 – $1,456
Heat risk 3/10 · Minor
- Hot days now (above 97°F)
- 7 days/yr
- Hot days in 30 yrs
- 14 days/yr
Wind risk 1/10 · Minimal
- Chance of severe wind over 30 yrs
- —
Air-quality risk 2/10 · Minimal
- Unhealthy air days now
- 1 days/yr
- Unhealthy air days in 30 yrs
- 2 days/yr
Risk factors via First Street. Map © Google.
Why this score? — see what drove the D+ grade
The composite is a weighted blend of 9 inputs, each scored 0–100. Each bar is that input's sub-score; the figure is the points it added to the 100-point composite (weight × sub-score).
- Cash flow +13.9/30.0
- ARV discount +12.4/15.0
- DSCR +4.2/10.0
- 1% rule +3.8/10.0
- Livability +3.4/5.0
- Schools +2.8/10.0
- Rent growth +2.5/5.0
- Condition / age +2.5/5.0
- Appreciation +0.0/10.0
$139,900
🖨 Deal sheet 📄 Offer letter ✓ Due diligence
Listing remarks MLS
Four generations of the same family have enjoyed this home for holidays and gatherings. This Eastside home boasts three bedrooms, two full baths, basement, oversized yard and a garage. The living areas are quite spacious and extra rooms include an office and finished storage. For outdoor enjoyment there is a porch, patio and a deck! Also, room for a nice garden! Ideal location for the Rail trail and Carroll Park! New roof 2015
Key facts
- Wood flooring
- Dining area
- Large living room
Tags
Property features AI
Exterior
- Parking: Detached 1-car garage
- Utilities: Natural gas heating fuel; Forced air heating system; Central air conditioning; Public water; Public sanitary sewer
- Home design: Residential property; 1 1/2-story structure; Built in 1900
- Construction: Wood exterior; Basement foundation; 900 sq. ft. below grade
- Exterior features: Road frontage
Interior
- Kitchen: First-floor kitchen, approximately 16 x 8; Laminate floor in the kitchen; Dining area adjacent to kitchen, approximately 16 x 10 with wood flooring
- Bedrooms: Bedroom 1 (Second floor) — 10 x 11, carpet; Bedroom 2 (Second floor) — 6 x 13, other flooring; Bedroom 3 (First floor) — 11 (approx.), carpet
- Flooring: Wood floors in living and dining areas; Carpet in most bedrooms; Laminate in the kitchen
- Bathrooms: 2 full bathrooms; one on the first floor and one on the second floor
- Interior features: 8 total rooms; Full basement
- Laundry & utility: Basement provides utility/laundry space
Neighborhood map
What this means for you Summary
Snapshot
- This is a 2-bed/2.0-bath single-family listed at $140k.
Deal economics
- At list price, monthly cash flow is $16 ($193/yr) — positive.
- The deal already cash-flows at list — no discount required.
- To meet the 1% rule (rent ≥ 1% of price), the offer needs to be $123k (12.0% below list).
- Recommended offer: $123k (12.0% below list) — sets the bar for 1% rule.
Location & tenants
- Location reads 68/100 on livability (#360 in MI) — a middle-class / working-renter tenant base. Strengths: cost of living A+, housing A+, health & safety A+; Watch: schools D+, amenities D, crime F.
- Bay City School District (urban): math 27% / reading 40% proficiency, ranked #317 of 540 in MI (top 59%) — families likely to look elsewhere, expect single-tenant / working-renter base with shorter leases.
- Market conditions: 148 active listings in the ZIP; 1 comparable units currently listed for rent nearby; 39 units permitted in Bay County in 2024 (0 in 5+ unit buildings).
Forward outlook
- Local home prices are declining (-3.0%/yr); year-one equity from $967 of loan paydown is wiped out by about $4k of value loss. Plan a longer hold.
- Bay County population projected at -21% by 2050 — secular population decline; favor cash flow + early exit over multi-decade hold.
Negotiation context
- It's been on market 56 days — a 3% lower offer ($136k) is reasonable based on typical stale-listing flexibility.
- 2 sale attempts since 11y ago; this cycle's ask has dropped $10k (7%) from the opening price — seller is motivated, your offer sets the floor, not the list.
- Current owner paid $40k; list at $140k implies a 250% gain — meaningful room to come down on a strong offer.
Risks & watch-outs
- Watch-outs: built in 1900 — expect roof / HVAC / electrical / plumbing capex.
Questions for the listing agent
- It's been on market 56 days. Have you received any prior offers? Is the seller open to a 12% concession, seller financing, or rate buy-down credit?
- Built in 1900 — when were the roof, HVAC, electrical panel, plumbing, and water heater last replaced?
- Is there a deadline driving the sale (1031 exchange, divorce, estate, relocation)? That informs how much negotiation room exists.
- Schools are D-rated, which usually means shorter tenancies and higher turnover. Who's the typical renter profile here, and what's been the actual vacancy rate?
- Crime grade is F in this area — have there been break-ins, vandalism, or insurance claims at this property in the last 3 years? What carrier currently insures it and at what premium?
- The area grade is low — what's the realistic commute time and amenity access for the typical tenant pool here? Any planned neighborhood developments (good or bad) we should know about?
- What's the average days-on-market for RENTAL listings here right now (not sales)? A rising rental-DOM trend means longer vacancies and softer asking-rent achievability than the comps imply.
- What's the recent tenant-quality profile in this submarket — average credit score on applications, eviction rate, late-payment / NSF rate, and stable-employment percentage? A property-management company in the area should have these aggregated.
- How much new for-sale + rental construction is in the pipeline within 1–3 miles? Heavy new supply typically softens prices + rents 12–24 months out; constrained supply supports both.
Investment metrics
- 1% rule
- 0.88% ✗
- Cap rate
- 6.43%
- Cash-on-cash
- 0.49%
- DSCR
- 1.02
- GRM
- 9.5
CMA / ARV
- ARV (median comp)
- $157,093
- List price
- $139,900
- Delta
- -10.94%
- Verdict
- UNDERPRICED
- Comps
- 20 within 1.0 mi
Show comp detail 12 sales within ~0.75 mi
| Address | Dist | Beds/Ba | Sqft | Sold | Price | $/sf | Match |
|---|---|---|---|---|---|---|---|
| 714 Nebobish Ave | 0.01mi | 3/2.0 (+1) | 1,288 (+1%) | 4mo | $69,000 | $54 | 89 |
| 608 Woodside Ln | 0.20mi | 3/2.0 (+1) | 1,320 (+4%) | 4mo | $140,000 | $106 | 76 |
| 1316 N Trumbull St | 0.40mi | 3/1.5 (+1) | 1,312 (+3%) | 2mo | $118,303 | $90 | 67 |
| 500 Princeton St | 0.75mi | 3/2.0 (+1) | 1,260 (-1%) | 5mo | $145,000 | $115 | 54 |
| 310 Burns St | 0.75mi | 3/1.5 (+1) | 1,320 (+4%) | 4mo | $225,000 | $170 | 49 |
| 800 Woodside Ln | 0.27mi | 3/1.0 (+1) | 1,450 (+14%) | 8mo | $144,000 | $99 | 48 |
| 2121 7th St | 0.71mi | 3/1.5 (+1) | 1,182 (-7%) | 2mo | $175,000 | $148 | 46 |
| 502 Borton Ave | 0.47mi | 3/2.5 (+1) | 1,452 (+14%) | 6mo | $91,500 | $63 | 42 |
| 308 Borton Ave | 0.43mi | 3/1.0 (+1) | 1,100 (-14%) | 8mo | $144,900 | $132 | 42 |
| 2110 4th St | 0.52mi | 3/1.0 (+1) | 1,104 (-13%) | 9mo | $78,000 | $71 | 37 |
| 1009 N Hampton St | 0.73mi | 3/1.5 (+1) | 1,081 (-15%) | 0mo | $140,000 | $130 | 34 |
| 2131 7th St | 0.70mi | 3/1.0 (+1) | 1,436 (+13%) | 6mo | $134,000 | $93 | 32 |
Match score weights: distance 35% · size 25% · config 20% · recency 20%. Top-matched comps best support the ARV.
Projected returns pro-forma
-3.0% appreciation · 3.0% rent growth · sell at horizon
- IRR
- -15.5%
- Equity multiple
- 0.45×
- Total profit
- $-21,634
- Equity at exit
- $20,860
- IRR
- -7.0%
- Equity multiple
- 0.55×
- Total profit
- $-17,470
- Equity at exit
- $12,096
Cash invested: $39,172 (down + closing). Projections, not guarantees.
Landlord ↔ Tenant lean methodology
- Overall (STATE)
- 62 Landlord-Friendly
- State Michigan
- 62 Landlord-Friendly · EVEN
- County
- — inherits STATE
- City
- — inherits STATE
ZIP-level market 48708
- Home prices YoY
- -30.9%
- Active inventory
- 148
- Price-to-rent
- 9.5×
Monthly cashflow live
- Estimated rent
- $1,231 medium interval (Pro) →
- Mortgage (P&I)
- −$734
- Tax from tax record
- −$164 /mo · $1,973/yr
- Insurance
- −$58
- HOA
- −$0
- Vacancy / Maint / Mgmt
- −$259
- Net cashflow
- $16
Break-even live
UW: 25.0% down · 7.5% · 30yr · 1.5% tax · 5.0% vac · 8.0% maint · 8.0% mgmt
Financing live
Cash to close
- Down payment
- $34,975
- Closing costs
- $4,197
- Reserves months
- —
- Total cash needed
- —
Loan-product check · same deal, 3 products live
Conventional
25% down · 7.5% · 30yr
- Down + closing
- —
- Monthly P&I
- —
- Monthly cashflow
- —
- DSCR
- —
- Eligible?
- —
Personal DTI + credit; lowest rate.
DSCR
20% down · 8.5% · 30yr
- Down + closing
- —
- Monthly P&I
- —
- Monthly cashflow
- —
- DSCR
- —
- Eligible?
- —
No personal income docs; deal must DSCR.
Hard money
10% down · 12.0% · 12mo
- Down + closing
- —
- Monthly P&I
- —
- Monthly cashflow
- —
- DSCR
- —
- Eligible?
- —
Short-term bridge; refi at stabilization.
Rent comps 1 comps
| Address | Beds | Baths | Sqft | Rent | $/sqft | DOM | Units | Dist |
|---|---|---|---|---|---|---|---|---|
| 1305 Washington Ave Bay City, MI | 2.0 | 1.0 | 635 | $1,675 | $2.64 | 43d | 1 | 1.43mi |
Listing history 21 events
-
2026-06-19days on market $139,900 Active 56 DOM
-
2026-06-18days on market $139,900 Active 55 DOM
-
2026-06-17days on market $139,900 Active 54 DOM
-
2026-06-16days on market $139,900 Active 53 DOM
-
2026-06-15days on market $139,900 Active 52 DOM
-
2026-06-14days on market $139,900 Active 50 DOM
-
2026-06-12days on market $139,900 Active 49 DOM
-
2026-06-09days on market $139,900 Active 46 DOM
-
2026-06-08days on market $139,900 Active 45 DOM
-
2026-06-07days on market $139,900 Active 44 DOM
-
2026-06-05pricedays on market $139,900 Active 41 DOM
-
2026-06-03days on market $144,900 Active 40 DOM
-
2026-06-02days on market $144,900 Active 39 DOM
-
2026-06-01days on market $144,900 Active 38 DOM
-
2026-05-31days on market $144,900 Active 37 DOM
-
2026-05-30days on market $144,900 Active 36 DOM
-
2026-05-14price $144,900 825-char remark
-
2026-04-24$149,900 Active 825-char remark
-
2015-11-02soldstatus $40,000
-
2015-10-30soldstatus $40,000 430-char remark
Show marketing remark (430 chars)
Four generations of the same family have enjoyed this home for holidays and gatherings. This Eastside home boasts three bedrooms, two full baths, basement, oversized yard and a garage. The living areas are quite spacious and extra rooms include an office and finished storage. For outdoor enjoyment there is a porch, patio and a deck! Also, room for a nice garden! Ideal location for the Rail trail and Carroll Park! New roof 2015
-
2015-04-21$45,900 430-char remark
Show marketing remark (430 chars)
Four generations of the same family have enjoyed this home for holidays and gatherings. This Eastside home boasts three bedrooms, two full baths, basement, oversized yard and a garage. The living areas are quite spacious and extra rooms include an office and finished storage. For outdoor enjoyment there is a porch, patio and a deck! Also, room for a nice garden! Ideal location for the Rail trail and Carroll Park! New roof 2015
ⓘ Source: listings_history table (triggers on properties + properties_extension) + one-shot
backfill from property_details.listing_events for pre-trigger history.
Tax reassessment forecast MI · Partial reset (capped growth)
- Current annual tax
- $1,973 · $164/mo
- Projected year-2 tax
- $2,064 · $172/mo
- Expected delta
- +$91/yr (+$8/mo · 4.6%)
ⓘ Screening estimate from a state-policy table — verify with the county assessor before closing.
Climate risk First Street
- Flood 1/10 Low FEMA zone X (unshaded) · 0% chance over 30 yrs
- Wildfire 1/10 Low
- Heat 3/10 Moderate 7 d/yr ≥97°F today · 14 d/yr by 30 yrs out
- Wind 1/10 Low
- Air quality 2/10 Low 1 unhealthy d/yr today · 2 by 30 yrs out
Nearby sold comps map
Loading sold comps map…
Walkable amenities ~0.75 mi
Loading nearby amenities…
Taxation est. · year 1
- Rental income
- $14,772
- − Mortgage interest
- −$7,837
- − Property taxes
- −$1,973
- − Insurance
- −$700
- − Repairs & maintenance
- −$1,182
- − Management
- −$1,182
- − Depreciation
- −$4,070
- Taxable loss
- −$2,171
- Est. tax savings @ 24.0%
- +$521
- After-tax cash flow
- $714/yr
For passive investors: Depreciation is non-cash, so a rental often shows a tax loss while cash-flowing — sheltering income. Rental losses are passive: they offset passive income freely, and up to $25,000/yr can offset ordinary (W-2) income if you actively participate and your MAGI is under $100k (phasing out to $0 by $150k); unused losses carry forward. On sale, claimed depreciation is recaptured at up to 25%, and gains may owe capital-gains tax (a 1031 exchange can defer both). Figures are a year-1 estimate at your 24.0% rate — not tax advice; consult a CPA.
Schools (NCES district)
- District
- Bay City School District
- NCES district ID
- 2604260
- Math proficiency
- 27% ▼ -8.00%
- Reading proficiency
- 40% ▼ -4.00%
- Median HH income
- $43,833
- Composite
- 28.47/100
- National rank
- #6743
- State rank
- #317 of 540 in MI
Livability — Bay City
- Score
- 68/100
- State rank
- #360
- US rank
- #8912
Category grades
Schools grade is shown separately in the Schools card above.
Census & demographics
- Census place
- Bay City, MI
- County
- Bay County · 36,975 people
- City population
- 25,635
- Metro
- Bay City, MI
- Population (ZIP)
- 25,635
- Household income
- $50,518
- Rent vs Own
- Severe rent burden
- 528.0
Population outlook (Bay County) Hauer SSP2
- Today (2025)
- 101,476 people
- By 2030
- 98,152 · -3.3%
- By 2040
- 89,711 · -11.6%
- By 2050
- 80,614 · -20.6%
- By 2075
- 60,544 · -40.3%
- By 2100
- 41,603 · -59.0%
Race, ethnicity, and origin ACS 2023
- Neighborhood character
- Predominantly White (81%)
- Race & ethnicity
- White 81% Hispanic / Latino 11% Two or more races 10% Black 3%
- Hispanic origin (detail)
- Mexican 9%
- Common ancestry
- Romanian 17% Lithuanian 7% Slovak 2%
- Foreign-born
- 2% · Canada, South Korea
- Languages at home
- 96% English-only · Spanish 2% German/W. Germanic 1%
Political lean MEDSL · Bay
- 2024 margin
- R (+14.7) · D 42.0% · R 56.7% · Other 1.3%
- 2008→2024 swing
- -30.0pp toward R · 2008: 15.3pp · 2024: -14.7pp
- All cycles
- 2024: R+14.7 2020: R+11.6 2016: R+12.6 2012: D+6.0 2008: D+15.3
Not yet ingested
- Civics
- —
Market trends
- HPI YoY
- ▼ -82.21%
- Current HPI
- 183.5774
- Rent YoY
- —
- Metro
- Bay City, MI
- State GDP YoY
- ▲ 1.37%
- F500 in state
- 28
Industry mix (Fortune 500 HQ in MI)
| Industry | F500 HQs | Revenue |
|---|---|---|
| Automotive Parts | 3 | $48B |
|
||
| Automotive | 2 | $372B |
|
||
| Chemicals | 1 | $45B |
|
||
| Automotive Retail | 1 | $29B |
|
||
| Healthcare / Medical Devices | 1 | $23B |
|
||
| Automotive Technology | 1 | $20B |
|
||
Price history
+204.8% since first listed6 events — show timeline
- 2026-06-05 Price Changed $139,900 MiRealSource-MiMLS
- 2026-05-14 Price Changed $144,900 MiRealSource-MiMLS
- 2026-04-24 Listed $149,900 MiRealSource-MiMLS
- 2015-11-02 Sold (Public Records) $40,000 Public Records
- 2015-10-30 Sold (MLS) $40,000 MiRealSource-MiMLS
- 2015-04-21 Listed $45,900 MiRealSource-MiMLS
Property tax history
+3.8%/yrLatest (2025): $1,973 · +3.0% YoY. Source: county tax records.
Cash-flow waterfall
monthlySold comps — $/sqft
last 12 mo · ≤1 miLoading sold comps…