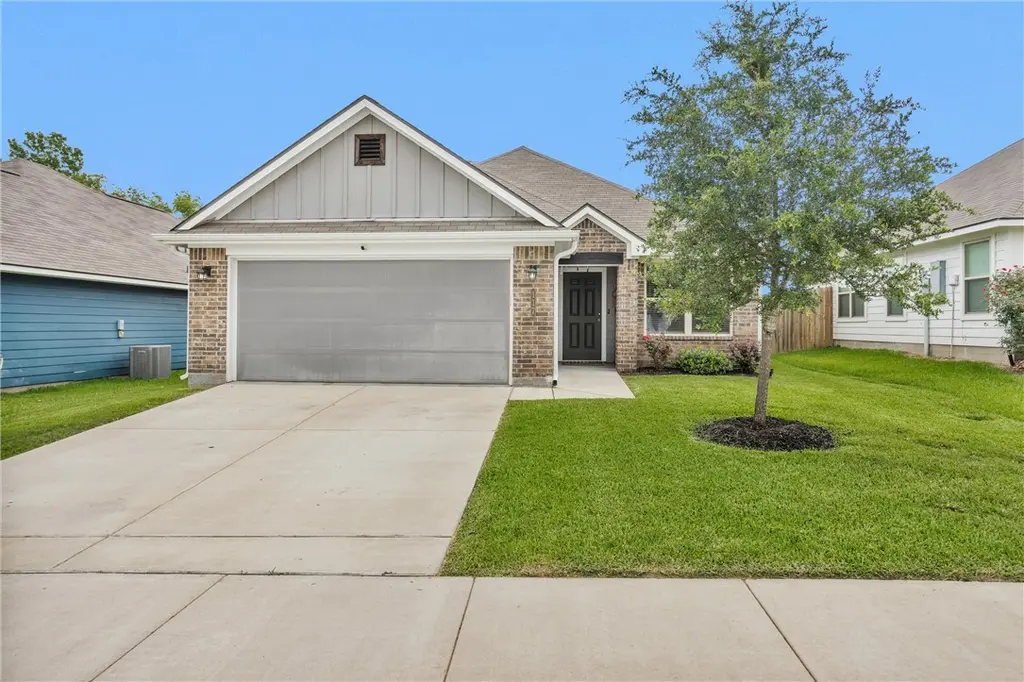
117 Dove Landing Ct · Navasota, TX
Flood risk 1/10 · Minimal
- FEMA flood zone
- X (unshaded)
- Chance of flooding over 30 yrs
- 0.0%
- Est. flood insurance / yr
- $507 – $1,088
Fire risk 5/10 · Moderate
- Est. fire insurance / yr
- $1,222 – $2,270
Heat risk 8/10 · Major
- Hot days now (above 111°F)
- 7 days/yr
- Hot days in 30 yrs
- 23 days/yr
Wind risk 8/10 · Major
- Chance of severe wind over 30 yrs
- 99.0%
Air-quality risk 2/10 · Minimal
- Unhealthy air days now
- 0 days/yr
- Unhealthy air days in 30 yrs
- 1 days/yr
Risk factors via First Street. Map © Google.
Why this score? — see what drove the D- grade
The composite is a weighted blend of 9 inputs, each scored 0–100. Each bar is that input's sub-score; the figure is the points it added to the 100-point composite (weight × sub-score).
- Cash flow +12.3/30.0
- ARV discount +4.0/15.0
- Condition / age +4.0/5.0
- 1% rule +3.9/10.0
- DSCR +3.7/10.0
- Livability +3.2/5.0
- Schools +2.7/10.0
- Rent growth +2.5/5.0
- Appreciation +0.0/10.0
$245,000
🖨 Deal sheet (PDF) 📄 Offer letter ✓ Due diligence
Listing remarks MLS
Custom finishes meet small-town charm in this beautifully maintained 3-bedroom, 2-bath home in desirable Dove Crossing. Built in 2021 (CAD) by Blackrock Homes and lovingly cared for by its original owners, this home showcases exceptional pride of ownership throughout. The open-concept layout is perfect for everyday living and entertaining, featuring a stunning kitchen with custom granite countertops, tile accents, and seamless flow into the living and dining areas. Farmhouse-inspired design elements add warmth and character throughout. Large secondary rooms and plenty of closet space, spacious laundry room, generously sized backyard, and lush, professionally maintained lawn elevate the home's appeal. Residents enjoy low HOA fees, abundant green space, and access to Patout Pond for fishing and outdoor enjoyment. With a location that offers the best of community living, this home is truly move-in ready. All info per Seller.
Key facts
- Open-concept layout
- 5,445 sq ft lot
- 2 garage spots
Tags
Property features AI
Finance
- HOA & community: Homeowners association (Association Services BCS); Annual association fee of $250 covering common areas; Community features include curbs and gutters
Exterior
- Parking: Attached 2-car garage; Additional parking; Garage door opener
- Security: Owned security system; Smoke detectors
- Utilities: Public water; Public sewer
- Home design: Residential property; Faces west; Built in 2021; Slab foundation; Full ownership
- Construction: Brick and cement siding construction; Composition roof
- Exterior features: Deck; Patio; Fenced backyard; Subdivision setting; Concrete road surface
Interior
- Kitchen: Dishwasher; Electric cooktop; Electric oven; Disposal; Microwave
- Bedrooms: 3 bedrooms (possible)
- Flooring: Carpet; Engineered hardwood
- Bathrooms: 2 full bathrooms
- Heating & cooling: Central electric heating; Central electric air conditioning; Energy-efficient HVAC and thermostat
- Interior features: Breakfast bar; High ceilings; Marble counters; Pantry; Window treatments; Ceiling fans; Kitchen/dining combo; Programmable thermostat; Ventilation (improved indoor air quality)
- Laundry & utility: Washer hookup; Electric dryer hookup
Neighborhood map
What this means for you Summary
Snapshot
- This is a 3-bed/2.0-bath single-family listed at $245k. Condition is rated good.
Deal economics
- At list price, monthly cash flow is $-44 ($-529/yr) — negative.
- To cash-flow at today's rent, offer at most $237k (3.2% below list).
- To meet the 1% rule (rent ≥ 1% of price), the offer needs to be $218k (11.1% below list).
- Recommended offer: $218k (11.1% below list) — sets the bar for 1% rule.
- Cap rate 6.1% vs local median 3.8% in Navasota — top-decile yield for the area; either an underpriced asset or a hidden risk that comps aren't pricing in. Stress-test before assuming the spread holds.
Location & tenants
- Location reads 63/100 on livability (#852 in TX) — a middle-class / working-renter tenant base. Strengths: cost of living A+, housing A+; Watch: crime F, amenities F, commute F.
- Navasota ISD (town): math 31% / reading 31% proficiency, ranked #600 of 826 in TX (top 73%) — families likely to look elsewhere, expect single-tenant / working-renter base with shorter leases; 68% free/reduced lunch — lower-income household profile, screen leases tightly.
- Zoned schools: John C Webb El (math 34% / reading 28%, grade F, #2,429 of 4,322 statewide, top 57%, 597 students, 80% FRL); Navasota J H (math 26% / reading 30%, grade F, #1,143 of 1,662 statewide, top 69%, 664 students, 82% FRL); Navasota H S (math 34% / reading 32%, grade F, #1,023 of 1,632 statewide, top 63%, 884 students, 73% FRL).
- Market conditions: 261 active listings in the ZIP; 3 comparable units currently listed for rent nearby; rentals leasing fast (median 7d on market — plan ~1-2 weeks tenant-placement turnaround); 110 units permitted in Grimes County in 2024 (0 in 5+ unit buildings).
Forward outlook
- Local home prices are declining (-3.0%/yr); year-one equity from $2k of loan paydown is wiped out by about $7k of value loss. Plan a longer hold.
- Grimes County population projected at +10% by 2050 — modest demand growth; plan on rents tracking national, not racing it.
Negotiation context
- Only 12 days on market — expect competitive offers; lowballing is unlikely to land.
- 2 sale attempts with the ask held roughly flat each time — persistent listings suggest the price (not the market) is what's stuck; bring a comps-based counter.
Risks & watch-outs
- Climate carrying-cost: severe wind risk, 99% chance of damaging wind over 30y; moderate wildfire risk; extreme-heat days projected 7→23/yr by 2055 (HVAC capex compounding) — expect insurance premiums to compound above CPI over the hold.
Questions for the listing agent
- What do current leases actually rent for vs. the listed asking? Can we see a recent rent roll and the last 12 months of T-12 income?
- What does the HOA fee cover, when was the last increase, and are there any pending special assessments or reserve-fund shortfalls?
- Is there a deadline driving the sale (1031 exchange, divorce, estate, relocation)? That informs how much negotiation room exists.
- Schools are F-rated, which usually means shorter tenancies and higher turnover. Who's the typical renter profile here, and what's been the actual vacancy rate?
- Crime grade is F in this area — have there been break-ins, vandalism, or insurance claims at this property in the last 3 years? What carrier currently insures it and at what premium?
- The area grade is low — what's the realistic commute time and amenity access for the typical tenant pool here? Any planned neighborhood developments (good or bad) we should know about?
- What's the average days-on-market for RENTAL listings here right now (not sales)? A rising rental-DOM trend means longer vacancies and softer asking-rent achievability than the comps imply.
- What's the recent tenant-quality profile in this submarket — average credit score on applications, eviction rate, late-payment / NSF rate, and stable-employment percentage? A property-management company in the area should have these aggregated.
- How much new for-sale + rental construction is in the pipeline within 1–3 miles? Heavy new supply typically softens prices + rents 12–24 months out; constrained supply supports both.
Investment metrics
- 1% rule
- 0.89% ✗
- Cap rate
- 6.08%
- Cash-on-cash
- -0.77%
- DSCR
- 0.97
- GRM
- 9.4
CMA / ARV
- ARV (on-the-fly)
- $227,286
- Comps found
- 10
Show comp detail 10 sales within ~0.75 mi
| Address | Dist | Beds/Ba | Sqft | Sold | Price | $/sf | Match |
|---|---|---|---|---|---|---|---|
| 115 Dove Ct | 0.05mi | 3/2.0 | 1,343 (-4%) | 2mo | $249,000 | $185 | 89 |
| 129 Dove Landing Court Ct | 0.05mi | 3/2.0 | 1,395 (-1%) | 10mo | $249,500 | $179 | 88 |
| 2309 White Wing | 0.25mi | 3/2.0 | 1,501 (+7%) | 1mo | $243,310 | $162 | 76 |
| 2306 White Wing | 0.28mi | 3/2.0 | 1,488 (+6%) | 4mo | $239,070 | $161 | 74 |
| 2308 White Wing | 0.28mi | 3/2.0 | 1,501 (+7%) | 3mo | $249,185 | $166 | 73 |
| 119 Dove Ct | 0.06mi | 3/2.0 | 1,279 (-9%) | 12mo | $225,000 | $176 | 72 |
| 2311 White Wing | 0.25mi | 3/2.0 | 1,540 (+10%) | 0mo | $239,710 | $156 | 72 |
| 2305 White Wing | 0.25mi | 3/2.0 | 1,540 (+10%) | 1mo | $245,655 | $160 | 71 |
| 2313 White Wing | 0.25mi | 3/2.0 | 1,540 (+10%) | 1mo | $237,605 | $154 | 71 |
| 2301 White Wing | 0.27mi | 3/2.0 | 1,542 (+10%) | 1mo | $220,000 | $143 | 70 |
Match score weights: distance 35% · size 25% · config 20% · recency 20%. Top-matched comps best support the ARV.
Projected returns pro-forma
-3.0% appreciation · 3.0% rent growth · sell at horizon
- IRR
- -17.5%
- Equity multiple
- 0.38×
- Total profit
- $-42,433
- Equity at exit
- $36,530
- IRR
- -9.5%
- Equity multiple
- 0.41×
- Total profit
- $-40,255
- Equity at exit
- $21,183
Cash invested: $68,600 (down + closing). Projections, not guarantees.
Landlord ↔ Tenant lean methodology
- Overall (STATE)
- 87 Strongly Landlord-Friendly
- State Texas
- 87 Strongly Landlord-Friendly · R+5
- County
- — inherits STATE
- City
- — inherits STATE
ZIP-level market 77868
- Home prices YoY
- -20.1%
- Active inventory
- 261
- Price-to-rent
- 9.4×
Monthly cashflow live
- Estimated rent
- $2,178 medium interval (Pro) →
- Mortgage (P&I)
- −$1,285
- Tax from tax record
- −$357 /mo · $4,287/yr
- Insurance
- −$102
- HOA
- −$21
- Vacancy / Maint / Mgmt
- −$457
- Net cashflow
- $-44
Break-even live
Sensitivity live
| Price | -10% $95 | -5% $25 | +0% $-44 | +5% $-113 | +10% $-183 |
|---|---|---|---|---|---|
| Rent | -10% $-216 | -5% $-130 | +0% $-44 | +5% $42 | +10% $128 |
| Rate | -1.0pp $79 | -0.5pp $18 | base $-44 | +0.5pp $-108 | +1.0pp $-172 |
UW: 25.0% down · 7.5% · 30yr · 1.5% tax · 5.0% vac · 8.0% maint · 8.0% mgmt
Financing live
Cash to close
- Down payment
- $61,250
- Closing costs
- $7,350
- Reserves months
- —
- Total cash needed
- —
Loan-product check · same deal, 3 products live
Conventional
25% down · 7.5% · 30yr
- Down + closing
- —
- Monthly P&I
- —
- Monthly cashflow
- —
- DSCR
- —
- Eligible?
- —
Personal DTI + credit; lowest rate.
DSCR
20% down · 8.5% · 30yr
- Down + closing
- —
- Monthly P&I
- —
- Monthly cashflow
- —
- DSCR
- —
- Eligible?
- —
No personal income docs; deal must DSCR.
Hard money
10% down · 12.0% · 12mo
- Down + closing
- —
- Monthly P&I
- —
- Monthly cashflow
- —
- DSCR
- —
- Eligible?
- —
Short-term bridge; refi at stabilization.
Rent comps 3 comps
| Address | Beds | Baths | Sqft | Rent | $/sqft | DOM | Units | Dist |
|---|---|---|---|---|---|---|---|---|
| 2301 White Wing Dr Navasota, TX | 3.0 | 2.0 | 1542 | $2,000 | $1.30 | 14d | 1 | 0.29mi |
| 2301 White Wing Dr Navasota, TX | 3.0 | 2.0 | 1542 | $2,000 | $1.30 | 7d | 1 | 0.29mi |
| 118 Miller St Unit 1328087P Navasota, TX | 2.0 | 1.0 | 904 | $3,765 | $4.16 | 1d | 1 | 0.93mi |
HOA detail
- Monthly dues
- $21 · $252/yr
Listing history 8 events
-
2026-06-21days on market $245,000 Active 12 DOM
-
2026-06-18days on market $245,000 Active 9 DOM
-
2026-06-17days on market $245,000 Active 8 DOM
-
2026-06-16days on market $245,000 Active 7 DOM
-
2026-06-15days on market $245,000 Active 6 DOM
-
2026-06-13days on market $245,000 Active 4 DOM
-
2026-06-10remarks 699-char remark
-
2026-06-10$245,000 Active 1 DOM
ⓘ Source: listings_history table (triggers on properties + properties_extension) + one-shot
backfill from property_details.listing_events for pre-trigger history.
Tax reassessment forecast TX · Resets to sale price
- Current annual tax
- $4,287 · $357/mo
- Projected year-2 tax
- $4,484 · $374/mo
- Expected delta
- +$197/yr (+$16/mo · 4.6%)
ⓘ Screening estimate from a state-policy table — verify with the county assessor before closing.
Climate risk First Street
- Flood 1/10 Low FEMA zone X (unshaded) · 0% chance over 30 yrs
- Wildfire 5/10 Major
- Heat 8/10 Severe 7 d/yr ≥111°F today · 23 d/yr by 30 yrs out
- Wind 8/10 Severe 99% chance of damaging wind over 30 yrs
- Air quality 2/10 Low 0 unhealthy d/yr today · 1 by 30 yrs out
Nearby sold comps map
Loading sold comps map…
Walkable amenities ~0.75 mi
Loading nearby amenities…
Taxation est. · year 1
- Rental income
- $26,142
- − Mortgage interest
- −$13,724
- − Property taxes
- −$4,287
- − Insurance
- −$1,225
- − Repairs & maintenance
- −$2,091
- − Management
- −$2,091
- − HOA
- −$252
- − Depreciation
- −$7,127
- Taxable loss
- −$4,656
- Est. tax savings @ 24.0%
- +$1,117
- After-tax cash flow
- $588/yr
For passive investors: Depreciation is non-cash, so a rental often shows a tax loss while cash-flowing — sheltering income. Rental losses are passive: they offset passive income freely, and up to $25,000/yr can offset ordinary (W-2) income if you actively participate and your MAGI is under $100k (phasing out to $0 by $150k); unused losses carry forward. On sale, claimed depreciation is recaptured at up to 25%, and gains may owe capital-gains tax (a 1031 exchange can defer both). Figures are a year-1 estimate at your 24.0% rate — not tax advice; consult a CPA.
Condition & rehab AI · 12 photos
This well-maintained, custom-built home in Dove Crossing offers a good condition with a good ROI potential for both resale and rental markets.
Value-add opportunities
- Resale Paint exterior trim — Enhances curb appeal
- Rental Replace window screens — Improves energy efficiency and reduces maintenance costs
Renovation cost estimate screening
Value-add ROI direction
- Resale Paint exterior trim — Enhances curb appeal ↑
- Rental Replace window screens — Improves energy efficiency and reduces maintenance costs ↑
ⓘ Cost ranges are severity-bucket heuristics (US national rule-of-thumb). Get contractor quotes + a written scope before underwriting a rehab budget.
Schools (NCES district)
- District
- Navasota ISD
- NCES district ID
- 4832190
- Math proficiency
- 31% ▲ 1.00%
- Reading proficiency
- 31% ▲ 1.00%
- Median HH income
- $44,326
- Composite
- 26.5/100
- National rank
- #7205
- State rank
- #600 of 826 in TX
Livability — Navasota
- Score
- 63/100
- State rank
- #852
- US rank
- #15344
Category grades
Schools grade is shown separately in the Schools card above.
Census & demographics
- Census place
- Navasota, TX
- Population (ZIP)
- 18,863
Population outlook (Grimes County) Hauer SSP2
- Today (2025)
- 28,910 people
- By 2030
- 29,539 · +2.2%
- By 2040
- 30,648 · +6.0%
- By 2050
- 31,698 · +9.6%
- By 2075
- 34,351 · +18.8%
- By 2100
- 33,565 · +16.1%
Race, ethnicity, and origin ACS 2023
- Neighborhood character
- Diverse neighborhood (Simpson 0.67)
- Race & ethnicity
- White 44% Hispanic / Latino 33% Two or more races 18% Black 17%
- Hispanic origin (detail)
- Mexican 30%
- Common ancestry
- Romanian 3% Lithuanian 2% Serbian 1%
- Foreign-born
- 9% · Canada
- Languages at home
- 71% English-only · Spanish 27% Russian/Polish/Slavic 1%
Political lean MEDSL · Grimes
- 2024 margin
- Solid R (+60.3) · D 19.5% · R 79.7%
- 2008→2024 swing
- -25.9pp toward R · 2008: -34.3pp · 2024: -60.3pp
- All cycles
- 2024: R+60.3 2020: R+53.2 2016: R+51.1 2012: R+44.2 2008: R+34.3
Not yet ingested
- Civics
- —
Market trends
- HPI YoY
- ▼ -52.02%
- Current HPI
- 206.7894
- Rent YoY
- —
- Metro
- —
- State GDP YoY
- ▲ 3.95%
- F500 in state
- 110
Industry mix (Fortune 500 HQ in TX)
| Industry | F500 HQs | Revenue |
|---|---|---|
| Energy | 16 | $1,198B |
|
||
| Technology | 5 | $198B |
|
||
| Engineering / Construction | 4 | $72B |
|
||
| Energy Services | 3 | $60B |
|
||
| Utilities | 3 | $41B |
|
||
| Healthcare | 2 | $330B |
|
||
Price history
+0.0% since first listed2 events — show timeline
- 2026-06-09 Listed $245,000 BCSRMLS
- 2026-06-09 Listed $245,000 HARMLS
Property tax history
+55.1%/yrLatest (2025): $4,287 · +8.1% YoY. Source: county tax records.
Cash-flow waterfall
monthlySold comps — $/sqft
last 12 mo · ≤1 miLoading sold comps…