2035 N US-31 N #2210 · Traverse City, MI
Flood risk No data
- FEMA flood zone
- —
- Chance of flooding over 30 yrs
- —
- Est. flood insurance / yr
- —
Fire risk No data
- Est. fire insurance / yr
- —
Heat risk No data
- Hot days now (above threshold)
- —
- Hot days in 30 yrs
- —
Wind risk No data
- Chance of severe wind over 30 yrs
- —
Air-quality risk No data
- Unhealthy air days now
- —
- Unhealthy air days in 30 yrs
- —
Risk factors via First Street. Map © Google.
Why this score? — see what drove the B- grade
The composite is a weighted blend of 9 inputs, each scored 0–100. Each bar is that input's sub-score; the figure is the points it added to the 100-point composite (weight × sub-score).
- Cash flow +25.4/30.0
- 1% rule +10.0/10.0
- DSCR +8.4/10.0
- ARV discount +7.5/15.0
- Condition / age +4.8/5.0
- Livability +4.5/5.0
- Schools +4.4/10.0
- Rent growth +2.4/5.0
- Appreciation +0.0/10.0
$124,900
🖨 Deal sheet 📄 Offer letter ✓ Due diligence
Listing remarks
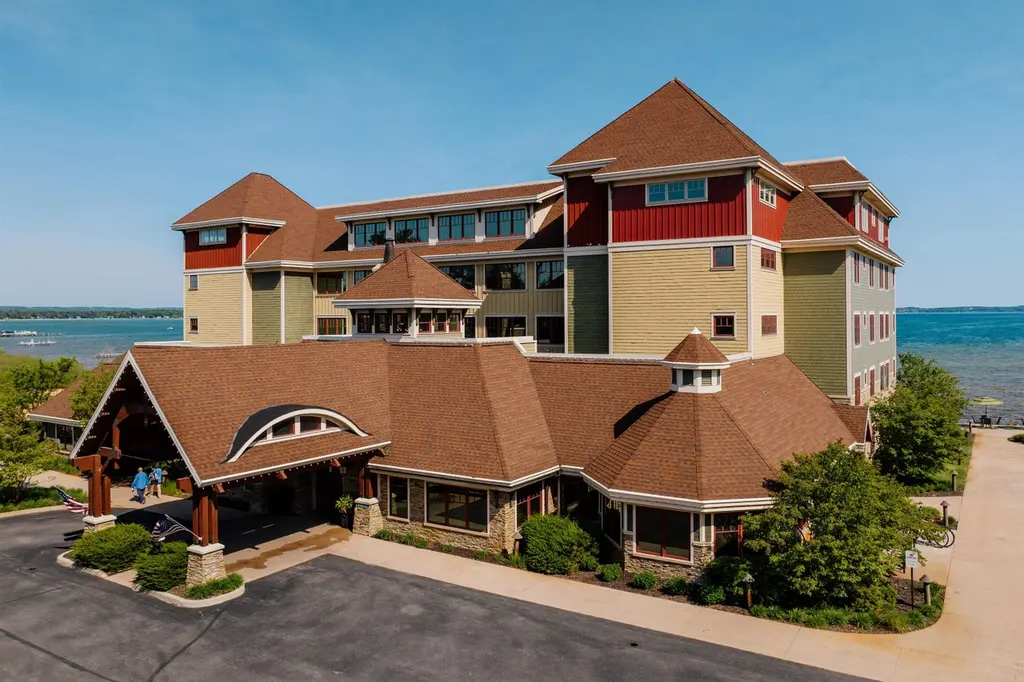
Tamarack Lodge! 3br 3ba 1,622 sq ft. Suite 2210 (Sugar Maple). An end unit located on the 2nd floor of a 5 story building that has an elevator. One of the bedrooms has a "Lock-off" which enables it to be its own suite if desired. Tamarack Lodge sells its units fractionally, similar to a timeshare. Absolutely outstanding water views and the best sugar sand beach imaginable from this 1/8th fractional ownership waterfront condo in Traverse City on Lake Michigan's East Grand Traverse Bay. See rotation D schedule for the 6 weeks that are included for the coming years (weeks change slightly each year). $465 per month association dues cover pretty much everything except for room cleaning
Key facts
- Sugar sand beach
- Water views
- End unit
Tags
Property features AI
Finance
- Other: Frontage approximately 450 feet; Located on East Bay (lake name)
- HOA & community: Monthly association fee of $465; Association covers lawn maintenance, snow removal, trash removal, exterior maintenance, water/sewer, heating; Community amenity: grounds maintenance
Exterior
- Utilities: Public water; Community sewer; Natural gas heating; Forced air heating system; Central air conditioning; Cable available
- Home design: Condominium; Built in 2006; Facing water (bay view)
- Construction: Stone and wood construction; Piers foundation; Basement materials: block, poured, and stone
- Exterior features: Exterior balcony; Sand shoreline; Bay view; Waterfront with shared access; All-sports lake frontage; Dock/pier facility; Sandy bottom
Interior
- Kitchen: Dishwasher; Disposal; Microwave; Refrigerator
- Bedrooms: Main level primary bedroom; First-floor bedroom; Bedroom sizes approximately 16 x 14, 14 x 13, and 13 (width)
- Bathrooms: Three full bathrooms; Primary bathroom included
- Interior features: Gas fireplace; Window treatments
- Laundry & utility: Washer; Dryer; Main-level laundry room
Neighborhood map
What this means for you Summary
Snapshot
- This is a 3-bed/3.0-bath condo listed at $125k. Condition is rated excellent.
Deal economics
- At list price, monthly cash flow is $287 ($3k/yr) — positive.
- The deal already cash-flows at list — no discount required.
- Meets the 1% rule at list price ($2k rent vs $125k).
- Recommended offer: $123k (1.5% below list) — sets the bar for market timing.
- Cap rate 9.1% vs local median 1.7% in Traverse City — top-decile yield for the area; either an underpriced asset or a hidden risk that comps aren't pricing in. Stress-test before assuming the spread holds.
Location & tenants
- Location reads 91/100 on livability (#4 in MI, #46 nationally) — a professional / high-income tenant draw. Strengths: amenities A+, commute A+, housing A+.
- Traverse City Area Public Schools (town): math 45% / reading 56% proficiency, ranked #94 of 540 in MI (top 17%) — acceptable for families but not a draw, mixed tenant base, ~2y average lease.
- Market conditions: Rents soft (-0.5%/yr); 322 active listings in the ZIP; 1 comparable units currently listed for rent nearby; 883 units permitted in Grand Traverse County in 2024 (501 in 5+ unit buildings).
- This rent runs 34% of the median local income ($72k/yr) — at the standard rent-burdened threshold; future hikes will face affordability resistance.
Forward outlook
- Local home prices are declining (-3.0%/yr); year-one equity from $864 of loan paydown is wiped out by about $4k of value loss. Plan a longer hold.
- Grand Traverse County population projected at +20% by 2050 — long-run rental-demand tailwind backs the buy-and-hold thesis.
Negotiation context
- It's been on market 17 days — a 2% lower offer ($123k) is reasonable based on typical stale-listing flexibility.
Risks & watch-outs
- Watch-outs: HOA is 23% of rent.
Questions for the listing agent
- What does the HOA fee cover, when was the last increase, and are there any pending special assessments or reserve-fund shortfalls?
- Any open or pending special assessments — roof, HVAC, plumbing, elevator, façade? What's the per-unit balance and payoff schedule, and is the seller paying it off at close or rolling it to the buyer?
- Is there a deadline driving the sale (1031 exchange, divorce, estate, relocation)? That informs how much negotiation room exists.
- Schools are A-rated — typically a magnet for longer-tenancy family renters. What's the average tenant stay here, and is there a school-zone premium baked into asking?
- What's the average days-on-market for RENTAL listings here right now (not sales)? A rising rental-DOM trend means longer vacancies and softer asking-rent achievability than the comps imply.
- What's the recent tenant-quality profile in this submarket — average credit score on applications, eviction rate, late-payment / NSF rate, and stable-employment percentage? A property-management company in the area should have these aggregated.
- How much new apartment / multifamily construction is in the pipeline within 1–3 miles? Heavy new supply (>2% of stock underway) typically softens rents 12–24 months out; light construction supports rent growth.
Investment metrics
- 1% rule
- 1.64% ✓
- Cap rate
- 9.05%
- Cash-on-cash
- 9.86%
- DSCR
- 1.44
- GRM
- 5.1
CMA / ARV
No comps found within radius.
Projected returns pro-forma
-3.0% appreciation · 0.0% rent growth · sell at horizon
- IRR
- -6.1%
- Equity multiple
- 0.78×
- Total profit
- $-7,619
- Equity at exit
- $18,623
- IRR
- -2.6%
- Equity multiple
- 0.86×
- Total profit
- $-4,949
- Equity at exit
- $10,799
Cash invested: $34,972 (down + closing). Projections, not guarantees.
Landlord ↔ Tenant lean methodology
- Overall (STATE)
- 62 Landlord-Friendly
- State Michigan
- 62 Landlord-Friendly · EVEN
- County
- — inherits STATE
- City
- — inherits STATE
ZIP-level market 49686
- Rents YoY
- -0.5%
- Active inventory
- 322
- Price-to-rent
- 5.1×
Monthly cashflow live
- Estimated rent
- $2,045 medium interval (Pro) →
- Mortgage (P&I)
- −$655
- Tax est. 1.5%
- −$156 /mo · $1,874/yr
- Insurance
- −$52
- HOA
- −$465
- Vacancy / Maint / Mgmt
- −$429
- Net cashflow
- $287
Break-even live
UW: 25.0% down · 7.5% · 30yr · 1.5% tax · 5.0% vac · 8.0% maint · 8.0% mgmt
Financing live
Cash to close
- Down payment
- $31,225
- Closing costs
- $3,747
- Reserves months
- —
- Total cash needed
- —
Loan-product check · same deal, 3 products live
Conventional
25% down · 7.5% · 30yr
- Down + closing
- —
- Monthly P&I
- —
- Monthly cashflow
- —
- DSCR
- —
- Eligible?
- —
Personal DTI + credit; lowest rate.
DSCR
20% down · 8.5% · 30yr
- Down + closing
- —
- Monthly P&I
- —
- Monthly cashflow
- —
- DSCR
- —
- Eligible?
- —
No personal income docs; deal must DSCR.
Hard money
10% down · 12.0% · 12mo
- Down + closing
- —
- Monthly P&I
- —
- Monthly cashflow
- —
- DSCR
- —
- Eligible?
- —
Short-term bridge; refi at stabilization.
Rent comps 1 comps
| Address | Beds | Baths | Sqft | Rent | $/sqft | DOM | Units | Dist |
|---|---|---|---|---|---|---|---|---|
| 4170 Lilac Ln Unit 905 Traverse City, MI | 3.0 | 2.0 | 1120 | $1,419 | $1.27 | 43d | 1 | 1.37mi |
HOA detail condo
- Monthly dues
- $465 · $5,580/yr
- Likely covers
- water
- Assessments
- None detected in remarks — confirm with the listing agent.
Listing history 12 events
-
2026-06-19days on market $124,900 Active 17 DOM
-
2026-06-18days on market $124,900 Active 16 DOM
-
2026-06-17days on market $124,900 Active 15 DOM
-
2026-06-16days on market $124,900 Active 14 DOM
-
2026-06-15days on market $124,900 Active 13 DOM
-
2026-06-14days on market $124,900 Active 11 DOM
-
2026-06-12days on market $124,900 Active 10 DOM
-
2026-06-09days on market $124,900 Active 7 DOM
-
2026-06-08days on market $124,900 Active 6 DOM
-
2026-06-07days on market $124,900 Active 5 DOM
-
2026-06-03remarks 689-char remark
-
2026-06-03$124,900 Active 1 DOM
ⓘ Source: listings_history table (triggers on properties + properties_extension) + one-shot
backfill from property_details.listing_events for pre-trigger history.
Nearby sold comps map
Loading sold comps map…
Walkable amenities ~0.75 mi
Loading nearby amenities…
Taxation est. · year 1
- Rental income
- $24,538
- − Mortgage interest
- −$6,996
- − Property taxes
- −$1,874
- − Insurance
- −$624
- − Repairs & maintenance
- −$1,963
- − Management
- −$1,963
- − HOA
- −$5,580
- − Depreciation
- −$3,633
- Taxable income
- $1,904
- Est. tax owed @ 24.0%
- −$457
- After-tax cash flow
- $2,990/yr
For passive investors: Depreciation is non-cash, so a rental often shows a tax loss while cash-flowing — sheltering income. Rental losses are passive: they offset passive income freely, and up to $25,000/yr can offset ordinary (W-2) income if you actively participate and your MAGI is under $100k (phasing out to $0 by $150k); unused losses carry forward. On sale, claimed depreciation is recaptured at up to 25%, and gains may owe capital-gains tax (a 1031 exchange can defer both). Figures are a year-1 estimate at your 24.0% rate — not tax advice; consult a CPA.
Condition & rehab AI · 6 photos
This waterfront condo is in excellent condition with beautiful water views and a well-maintained exterior. It is move-in ready and would benefit from a fresh coat of paint and some landscaping improvements to further enhance its value.
Value-add opportunities
- Both Painting the interior walls — Fresh paint can enhance the overall appearance and value of the property.
- Both Landscaping improvements — Enhanced landscaping can improve curb appeal and attract more potential buyers or renters.
- Rental Regular maintenance of the HVAC system — A well-maintained HVAC system ensures comfort and reduces energy costs, which is beneficial for rental properties.
Renovation cost estimate screening
Value-add ROI direction
- Both Painting the interior walls — Fresh paint can enhance the overall appearance and value of the property. ↑
- Both Landscaping improvements — Enhanced landscaping can improve curb appeal and attract more potential buyers or renters. ↑
- Rental Regular maintenance of the HVAC system — A well-maintained HVAC system ensures comfort and reduces energy costs, which is beneficial for rental properties. ↑
ⓘ Cost ranges are severity-bucket heuristics (US national rule-of-thumb). Get contractor quotes + a written scope before underwriting a rehab budget.
Schools (NCES district)
- District
- Traverse City Area Public Schools
- NCES district ID
- 2633870
- Math proficiency
- 45% ▼ -3.00%
- Reading proficiency
- 56% ▼ -6.00%
- Median HH income
- $53,645
- Composite
- 43.51/100
- National rank
- #2990
- State rank
- #94 of 540 in MI
Livability — Traverse City
- Score
- 91/100
- State rank
- #4
- US rank
- #46
Category grades
Schools grade is shown separately in the Schools card above.
Census & demographics
- County
- Grand Traverse County · 47,077 people
- City population
- 47,077
- Metro
- Traverse City, MI
- Population (ZIP)
- 25,492
- Household income
- $71,609
- Rent vs Own
- Severe rent burden
- 676.0
Population outlook (Grand Traverse County) Hauer SSP2
- Today (2025)
- 102,241 people
- By 2030
- 107,172 · +4.8%
- By 2040
- 115,676 · +13.1%
- By 2050
- 122,377 · +19.7%
- By 2075
- 136,554 · +33.6%
- By 2100
- 137,871 · +34.8%
Race, ethnicity, and origin ACS 2023
- Neighborhood character
- Predominantly White (91%)
- Race & ethnicity
- White 91% Two or more races 6% Hispanic / Latino 5% Native American 1%
- Hispanic origin (detail)
- Mexican 4%
- Common ancestry
- Romanian 11% Lithuanian 5% Slovak 4%
- Foreign-born
- 2% · Canada
- Languages at home
- 96% English-only · Spanish 3%
Political lean MEDSL · Grand Traverse
- 2024 margin
- Toss-up / Even · D 48.3% · R 50.1% · Other 1.6%
- 2008→2024 swing
- +1.3pp toward D · 2008: -3.0pp · 2024: -1.7pp
- All cycles
- 2024: R+1.7 2020: R+3.0 2016: R+12.5 2012: R+11.8 2008: R+3.0
Not yet ingested
- Civics
- —
Market trends
- HPI YoY
- ▼ -276.28%
- Current HPI
- 352.4866
- Rent YoY
- ▼ -0.49%
- Metro
- Traverse City, MI
- State GDP YoY
- ▲ 1.37%
- F500 in state
- 28
Industry mix (Fortune 500 HQ in MI)
| Industry | F500 HQs | Revenue |
|---|---|---|
| Automotive Parts | 3 | $48B |
|
||
| Automotive | 2 | $372B |
|
||
| Chemicals | 1 | $45B |
|
||
| Automotive Retail | 1 | $29B |
|
||
| Healthcare / Medical Devices | 1 | $23B |
|
||
| Automotive Technology | 1 | $20B |
|
||
Price history
1 event — show timeline
- 2026-06-02 Listed $124,900 MiRealSource-MiMLS
Cash-flow waterfall
monthlySold comps — $/sqft
last 12 mo · ≤1 miLoading sold comps…