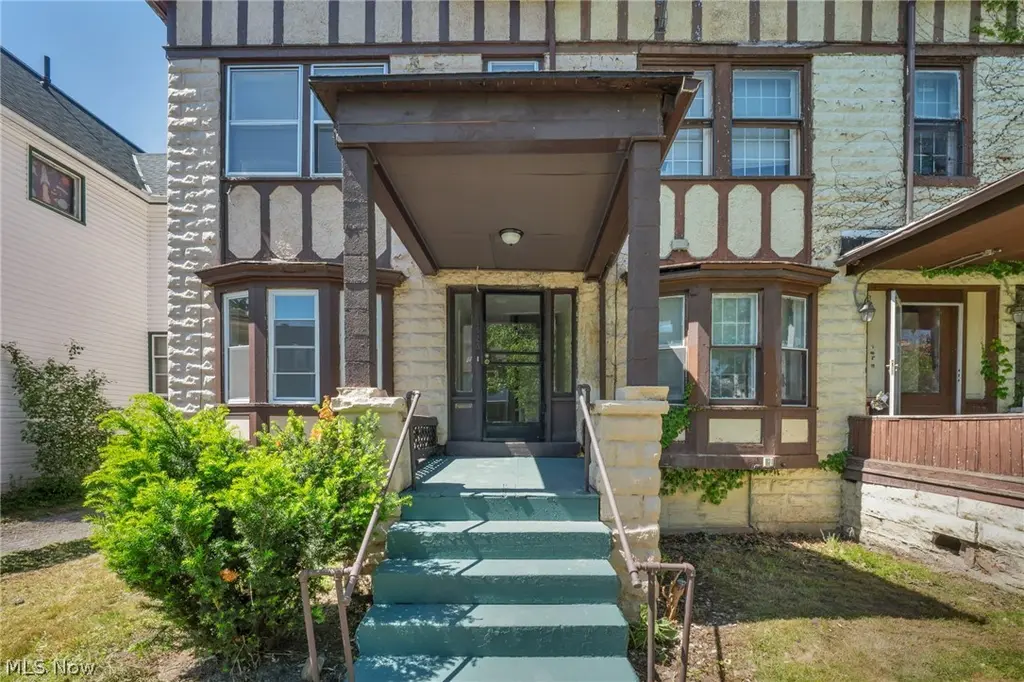
1726 Holyoke Ave · East Cleveland, OH
Flood risk 4/10 · Minor
- FEMA flood zone
- X (unshaded)
- Chance of flooding over 30 yrs
- 0.24%
- Est. flood insurance / yr
- $473 – $860
Fire risk 1/10 · Minimal
- Est. fire insurance / yr
- $713 – $1,323
Heat risk 3/10 · Minor
- Hot days now (above 95°F)
- 7 days/yr
- Hot days in 30 yrs
- 17 days/yr
Wind risk 1/10 · Minimal
- Chance of severe wind over 30 yrs
- —
Air-quality risk 3/10 · Minor
- Unhealthy air days now
- 3 days/yr
- Unhealthy air days in 30 yrs
- 5 days/yr
Risk factors via First Street. Map © Google.
Why this score? — see what drove the C grade
The composite is a weighted blend of 9 inputs, each scored 0–100. Each bar is that input's sub-score; the figure is the points it added to the 100-point composite (weight × sub-score).
- Cash flow +24.9/30.0
- DSCR +8.1/10.0
- ARV discount +7.5/15.0
- 1% rule +5.2/10.0
- Rent growth +3.8/5.0
- Livability +3.3/5.0
- Condition / age +2.5/5.0
- Schools +0.7/10.0
- Appreciation +0.0/10.0
$169,999
🖨 Deal sheet 📄 Offer letter ✓ Due diligence
Listing remarks MLS
Welcome to 1726 Holyoke Ave, a classic 5-bedroom, 2 full bath Colonial nestled in the heart of East Cleveland. This spacious property is a golden opportunity for savvy investors and homeowners alike, this property offers endless potential. Features include large bedrooms, beautiful fireplace, grand entryway, large windows, and a detached 2-car garage with additional driveway parking. For investors, the strategic layout is ideal for conversion into a group home or multi-unit rental, tapping into East Cleveland's growing demand for quality housing. Homeowners willing to provide some TLC will find the spacious layout and charming details perfect for creating their dream home. Don't miss out on this fantastic opportunity to own a piece of East Cleveland’s history and future. Contact us today to schedule a viewing and explore the potential of this charming Colonial home!
Key facts
- Large windows
- Formal dining room
- Tiled fireplace
Tags
Property features AI
Exterior
- Parking: Driveway
- Utilities: Public water; Public sewer
- Home design: Two-story home; Concrete and stucco construction; Asphalt/fiberglass roof
- Construction: Built (year source: public records)
- Exterior features: Public sewer; Public water
Interior
- Bedrooms: Total of 8 rooms (bedrooms included)
- Bathrooms: Two full bathrooms; One half bathroom; One main-level bathroom
- Heating & cooling: Forced air heating; Central air conditioning
- Interior features: Finished basement; One fireplace
- Laundry & utility: Laundry in basement
Neighborhood map
What this means for you Summary
Snapshot
- This is a 5-bed/2.0-bath single-family listed at $170k.
Deal economics
- At list price, monthly cash flow is $364 ($4k/yr) — positive.
- The deal already cash-flows at list — no discount required.
- Meets the 1% rule at list price ($2k rent vs $170k).
- Recommended offer: $167k (1.5% below list) — sets the bar for market timing.
- Cap rate 8.9% vs local median 17.4% in East Cleveland — below-typical yield; the buyer is paying a premium for something (appreciation thesis, condition, location) that the cap rate doesn't capture.
Location & tenants
- Location reads 66/100 on livability (#650 in OH) — a middle-class / working-renter tenant base. Strengths: commute A+, cost of living A+, health & safety A+; Watch: schools F, crime F, employment F.
- East Cleveland City School District (suburban): math 4% / reading 17% proficiency, ranked #652 of 656 in OH (top 99%) — low school quality limits family demand, transient renter base, plan for 1-2y turnover; 92% free/reduced lunch — lower-income household profile, screen leases tightly.
- Market conditions: Rents rising fast (+5.2%/yr); 99 active listings in the ZIP; 8 comparable units currently listed for rent nearby; rentals at typical pace (median 24d on market — plan ~3-4 weeks tenant-placement turnaround); lower-income renter base — watch delinquency; 1,441 units permitted in Cuyahoga County in 2024 (700 in 5+ unit buildings).
- At $1,733/mo this rent would consume 72% of the median local household income ($29k/yr) (locally 1702% of renters already pay >50% of income on rent) — very limited rent-growth headroom before tenants either downsize or default.
Forward outlook
- Local home prices are declining (-3.0%/yr); year-one equity from $1k of loan paydown is wiped out by about $5k of value loss. Plan a longer hold.
- Cuyahoga County population projected to shrink 8% by 2050 — rents likely to lag national; underwrite the cash flow, not the appreciation.
- At projected returns (-3.0% appreciation + 5.2% rent growth), your $48k cash investment doubles in ~10 years — after that, you're playing with house money.
Negotiation context
- It's been on market 20 days — a 2% lower offer ($167k) is reasonable based on typical stale-listing flexibility.
- 7 sale attempts since 2y ago with the ask held roughly flat each time — persistent listings suggest the price (not the market) is what's stuck; bring a comps-based counter.
- Current owner paid $20k; list at $170k implies a 750% gain — meaningful room to come down on a strong offer.
Risks & watch-outs
- Watch-outs: built in 1904 — expect roof / HVAC / electrical / plumbing capex.
Questions for the listing agent
- Built in 1904 — when were the roof, HVAC, electrical panel, plumbing, and water heater last replaced?
- Is there a deadline driving the sale (1031 exchange, divorce, estate, relocation)? That informs how much negotiation room exists.
- Schools are F-rated, which usually means shorter tenancies and higher turnover. Who's the typical renter profile here, and what's been the actual vacancy rate?
- Crime grade is F in this area — have there been break-ins, vandalism, or insurance claims at this property in the last 3 years? What carrier currently insures it and at what premium?
- What's the average days-on-market for RENTAL listings here right now (not sales)? A rising rental-DOM trend means longer vacancies and softer asking-rent achievability than the comps imply.
- What's the recent tenant-quality profile in this submarket — average credit score on applications, eviction rate, late-payment / NSF rate, and stable-employment percentage? A property-management company in the area should have these aggregated.
- How much new for-sale + rental construction is in the pipeline within 1–3 miles? Heavy new supply typically softens prices + rents 12–24 months out; constrained supply supports both.
Investment metrics
- 1% rule
- 1.02% ✓
- Cap rate
- 8.86%
- Cash-on-cash
- 9.18%
- DSCR
- 1.41
- GRM
- 8.2
CMA / ARV
- ARV (on-the-fly)
- $102,096
- Comps found
- 5
Show comp detail 5 sales within ~0.75 mi
| Address | Dist | Beds/Ba | Sqft | Sold | Price | $/sf | Match |
|---|---|---|---|---|---|---|---|
| 13600 Graham Rd | 0.54mi | 5/1.0 | 1,380 (-3%) | 10mo | $50,100 | $36 | 58 |
| 13411 6th Ave | 0.48mi | 4/1.0 (-1) | 1,468 (+4%) | 9mo | $113,000 | $77 | 55 |
| 1229 Melbourne Rd | 0.50mi | 5/1.5 | 1,600 (+13%) | 2mo | $115,000 | $72 | 51 |
| 1887 E Knowles St | 0.31mi | 6/1.0 (+1) | 1,605 (+13%) | 19mo | $118,900 | $74 | 39 |
| 1101 Carlyon Rd | 0.52mi | 4/1.5 (-1) | 1,570 (+11%) | 21mo | $79,900 | $51 | 33 |
Match score weights: distance 35% · size 25% · config 20% · recency 20%. Top-matched comps best support the ARV.
Projected returns pro-forma
-3.0% appreciation · 5.16% rent growth · sell at horizon
- IRR
- -0.3%
- Equity multiple
- 0.99×
- Total profit
- $-578
- Equity at exit
- $25,347
- IRR
- 11.2%
- Equity multiple
- 1.96×
- Total profit
- $45,557
- Equity at exit
- $14,698
Cash invested: $47,600 (down + closing). Projections, not guarantees.
Landlord ↔ Tenant lean methodology
- Overall (STATE)
- 73 Landlord-Friendly
- State Ohio
- 73 Landlord-Friendly · R+6
- County
- — inherits STATE
- City
- — inherits STATE
ZIP-level market 44112
- Rents YoY
- 5.2%
- Active inventory
- 99
- Price-to-rent
- 8.2×
Monthly cashflow live
- Estimated rent
- $1,733 high interval (Pro) →
- Mortgage (P&I)
- −$891
- Tax from tax record
- −$43 /mo · $513/yr
- Insurance
- −$71
- HOA
- −$0
- Vacancy / Maint / Mgmt
- −$364
- Net cashflow
- $364
Break-even live
UW: 25.0% down · 7.5% · 30yr · 1.5% tax · 5.0% vac · 8.0% maint · 8.0% mgmt
Financing live
Cash to close
- Down payment
- $42,500
- Closing costs
- $5,100
- Reserves months
- —
- Total cash needed
- —
Loan-product check · same deal, 3 products live
Conventional
25% down · 7.5% · 30yr
- Down + closing
- —
- Monthly P&I
- —
- Monthly cashflow
- —
- DSCR
- —
- Eligible?
- —
Personal DTI + credit; lowest rate.
DSCR
20% down · 8.5% · 30yr
- Down + closing
- —
- Monthly P&I
- —
- Monthly cashflow
- —
- DSCR
- —
- Eligible?
- —
No personal income docs; deal must DSCR.
Hard money
10% down · 12.0% · 12mo
- Down + closing
- —
- Monthly P&I
- —
- Monthly cashflow
- —
- DSCR
- —
- Eligible?
- —
Short-term bridge; refi at stabilization.
Rent comps 8 comps
| Address | Beds | Baths | Sqft | Rent | $/sqft | DOM | Units | Dist |
|---|---|---|---|---|---|---|---|---|
| 14009 Mayfair Ave Unit 2 East Cleveland, OH | 4.0 | 2.0 | 1144 | $1,390 | $1.22 | 43d | 1 | 0.48mi |
| 1229 Melbourne Rd Cleveland, OH | 5.0 | 1.5 | 1600 | $2,000 | $1.25 | 43d | 1 | 0.50mi |
| 12819 Edmonton Ave Cleveland, OH | 4.0 | 1.0 | 1423 | $1,795 | $1.26 | 16d | 1 | 0.63mi |
| 1339 E 115th St Cleveland, OH | 5.0 | 2.0 | 1550 | $2,000 | $1.29 | 16d | 1 | 1.01mi |
| 651 E 115th St Cleveland, OH | 4.0 | 2.0 | 1550 | $1,800 | $1.16 | 21d | 1 | 1.21mi |
| 910 Dresden Rd Cleveland, OH | 4.0 | 2.0 | 1839 | $1,800 | $0.98 | 16d | 1 | 1.25mi |
| 3201 Whitethorn Rd Unit 3203 Cleveland Heights, OH | 5.0 | 1.5 | 1485 | $1,725 | $1.16 | 23d | 1 | 1.40mi |
| 1024 Greyton Rd Cleveland, OH | 5.0 | 2.5 | 1800 | $2,500 | $1.39 | 43d | 1 | 1.46mi |
Listing history 14 events
-
2026-06-18days on market $169,999 Active 20 DOM
-
2026-06-17days on market $169,999 Active 19 DOM
-
2026-06-16days on market $169,999 Active 18 DOM
-
2026-06-15days on market $169,999 Active 17 DOM
-
2026-06-13days on market $169,999 Active 15 DOM
-
2026-06-13days on market $169,999 Active 14 DOM
-
2026-06-09days on market $169,999 Active 11 DOM
-
2026-06-08days on market $169,999 Active 10 DOM
-
2026-06-07days on market $169,999 Active 9 DOM
-
2026-06-05days on market $169,999 Active 6 DOM
-
2026-06-03days on market $169,999 Active 5 DOM
-
2026-06-02days on market $169,999 Active 4 DOM
-
2026-06-01days on market $169,999 Active 3 DOM
-
2026-05-31days on market $169,999 Active 2 DOM
ⓘ Source: listings_history table (triggers on properties + properties_extension) + one-shot
backfill from property_details.listing_events for pre-trigger history.
Tax reassessment forecast OH · Partial reset (capped growth)
- Current annual tax
- $513 · $43/mo
- Projected year-2 tax
- $1,582 · $132/mo
- Expected delta
- +$1,069/yr (+$89/mo · 208.5%)
ⓘ Screening estimate from a state-policy table — verify with the county assessor before closing.
Climate risk First Street
- Flood 4/10 Moderate FEMA zone X (unshaded) · 24% chance over 30 yrs
- Wildfire 1/10 Low
- Heat 3/10 Moderate 7 d/yr ≥95°F today · 17 d/yr by 30 yrs out
- Wind 1/10 Low
- Air quality 3/10 Moderate 3 unhealthy d/yr today · 5 by 30 yrs out
Nearby sold comps map
Loading sold comps map…
Walkable amenities ~0.75 mi
Loading nearby amenities…
Taxation est. · year 1
- Rental income
- $20,800
- − Mortgage interest
- −$9,523
- − Property taxes
- −$513
- − Insurance
- −$850
- − Repairs & maintenance
- −$1,664
- − Management
- −$1,664
- − Depreciation
- −$4,945
- Taxable income
- $1,641
- Est. tax owed @ 24.0%
- −$394
- After-tax cash flow
- $3,977/yr
For passive investors: Depreciation is non-cash, so a rental often shows a tax loss while cash-flowing — sheltering income. Rental losses are passive: they offset passive income freely, and up to $25,000/yr can offset ordinary (W-2) income if you actively participate and your MAGI is under $100k (phasing out to $0 by $150k); unused losses carry forward. On sale, claimed depreciation is recaptured at up to 25%, and gains may owe capital-gains tax (a 1031 exchange can defer both). Figures are a year-1 estimate at your 24.0% rate — not tax advice; consult a CPA.
Schools (NCES district)
- District
- East Cleveland City School District
- NCES district ID
- 3904390
- Math proficiency
- 4% ▼ -16.00%
- Reading proficiency
- 17% ▼ -13.00%
- Median HH income
- $22,726
- Composite
- 7.38/100
- National rank
- #9954
- State rank
- #652 of 656 in OH
Livability — East Cleveland
- Score
- 66/100
- State rank
- #650
- US rank
- #11510
Category grades
Schools grade is shown separately in the Schools card above.
Census & demographics
- Census place
- East Cleveland, OH
- County
- Cuyahoga County · 1,090,369 people
- City population
- 17,848
- Metro
- Cleveland-Elyria, OH
- Population (ZIP)
- 17,848
- Household income
- $28,799
- Rent vs Own
- Severe rent burden
- 1702.0
Population outlook (Cuyahoga County) Hauer SSP2
- Today (2025)
- 1,244,621 people
- By 2030
- 1,230,093 · -1.2%
- By 2040
- 1,189,108 · -4.5%
- By 2050
- 1,145,706 · -7.9%
- By 2075
- 1,076,557 · -13.5%
- By 2100
- 978,987 · -21.3%
Race, ethnicity, and origin ACS 2023
- Neighborhood character
- Predominantly Black (89%)
- Race & ethnicity
- Black 89% White 7% Two or more races 2% Hispanic / Latino 1%
- Common ancestry
- Lithuanian 1%
- Foreign-born
- 4% · Canada
- Languages at home
- 93% English-only · French/Haitian/Cajun 3% Spanish 2% Russian/Polish/Slavic 1%
Political lean MEDSL · Cuyahoga
- 2024 margin
- Solid D (+31.5) · D 65.4% · R 33.9%
- 2008→2024 swing
- -7.4pp toward R · 2008: 38.9pp · 2024: 31.5pp
- All cycles
- 2024: D+31.5 2020: D+34.1 2016: D+35.0 2012: D+38.7 2008: D+38.9
Not yet ingested
- Civics
- —
Market trends
- HPI YoY
- ▼ -115.61%
- Current HPI
- 67.2162
- Rent YoY
- ▲ 5.16%
- Metro
- Cleveland-Elyria, OH
- State GDP YoY
- ▲ 1.98%
- F500 in state
- 48
Industry mix (Fortune 500 HQ in OH)
| Industry | F500 HQs | Revenue |
|---|---|---|
| Insurance | 3 | $145B |
|
||
| Industrial Machinery | 3 | $49B |
|
||
| Financial Services | 3 | $24B |
|
||
| Consumer Goods | 2 | $93B |
|
||
| Aerospace / Defense | 2 | $47B |
|
||
| Utilities | 2 | $33B |
|
||
Price history
+325.0% since first listed18 events — show timeline
- 2026-05-29 Listed $169,999 MLSNOW
- 2025-02-24 Sold (MLS) $20,000 MLSNOW
- 2025-01-08 Pending — MLSNOW
- 2025-01-07 Listing Removed — MLSNOW
- 2025-01-02 Listed $20,000 MLSNOW
- 2024-12-31 Listing Removed — MLSNOW
- 2024-11-25 Price Changed $25,000 MLSNOW
- 2024-11-01 Relisted — MLSNOW
- 2024-10-18 Pending — MLSNOW
- 2024-10-10 Relisted — MLSNOW
- 2024-10-10 Price Changed $30,000 MLSNOW
- 2024-09-10 Pending — MLSNOW
- 2024-08-13 Relisted — MLSNOW
- 2024-07-17 Contingent — MLSNOW
- 2024-07-11 Price Changed $37,000 MLSNOW
- 2024-06-26 Relisted — MLSNOW
- 2024-06-08 Contingent — MLSNOW
- 2024-05-31 Listed $40,000 MLSNOW
Property tax history
-5.3%/yrLatest (2025): $513 · +0.0% YoY. Source: county tax records.
Cash-flow waterfall
monthlySold comps — $/sqft
last 12 mo · ≤1 miLoading sold comps…