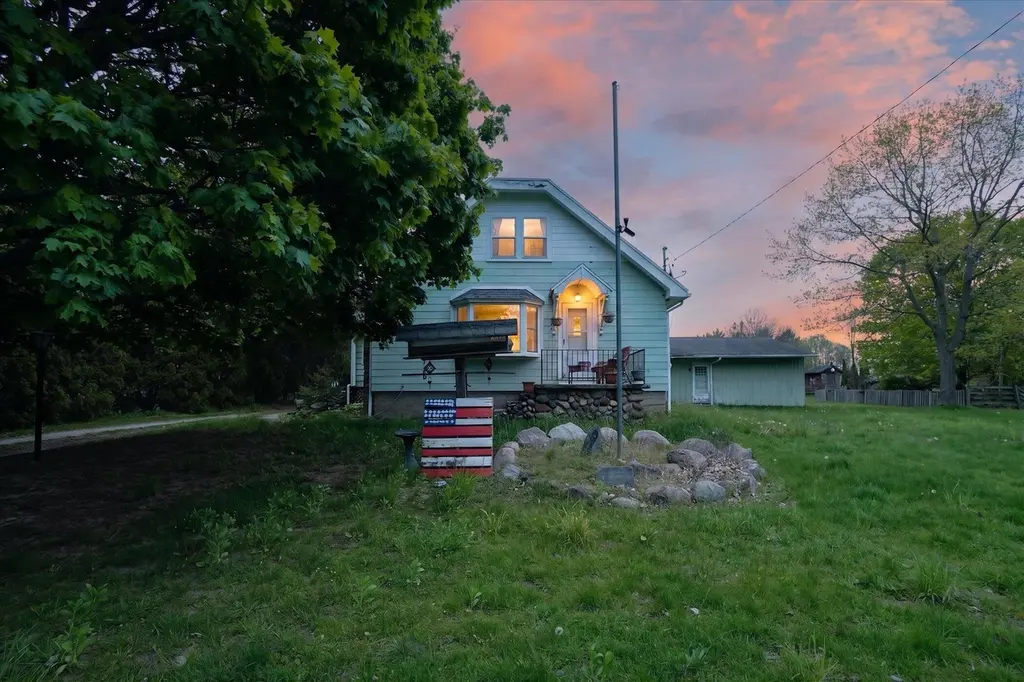
12940 Northland Dr NE · Cedar Springs, MI
Flood risk 1/10 · Minimal
- FEMA flood zone
- X (unshaded)
- Chance of flooding over 30 yrs
- 0.0%
- Est. flood insurance / yr
- $473 – $860
Fire risk 1/10 · Minimal
- Est. fire insurance / yr
- $784 – $1,456
Heat risk 2/10 · Minimal
- Hot days now (above 96°F)
- 7 days/yr
- Hot days in 30 yrs
- 15 days/yr
Wind risk 2/10 · Minimal
- Chance of severe wind over 30 yrs
- —
Air-quality risk 2/10 · Minimal
- Unhealthy air days now
- 1 days/yr
- Unhealthy air days in 30 yrs
- 1 days/yr
Risk factors via First Street. Map © Google.
Why this score? — see what drove the D grade
The composite is a weighted blend of 9 inputs, each scored 0–100. Each bar is that input's sub-score; the figure is the points it added to the 100-point composite (weight × sub-score).
- ARV discount +15.0/15.0
- Cash flow +9.0/30.0
- Livability +3.7/5.0
- Schools +3.6/10.0
- DSCR +2.5/10.0
- Rent growth +2.5/5.0
- Condition / age +2.5/5.0
- 1% rule +2.1/10.0
- Appreciation +0.0/10.0
$250,000
🖨 Deal sheet (PDF) 📄 Offer letter ✓ Due diligence
Listing remarks MLS
Opportunity awaits at 12940 Northland Dr. in Cedar Springs! Situated on beautiful acreage with multiple large farm barns and outbuildings, this property is full of potential for the right buyer. Whether you're looking for a hobby farm, investment opportunity, storage space, or a country fixer-upper to make your own, this property offers endless possibilities. The home needs work but provides a great opportunity to build equity and create your dream rural retreat. Enjoy the peaceful setting and wide-open space while still being conveniently located just minutes from downtown Cedar Springs and less than 2 miles from US-131 for an easy commute. With versatile barns perfect for equipment storage, workshops, animals, or future projects, this property combines rural charm with incredible convenience. Bring your vision and unlock the potential this unique property has to offer!No showings until Monday! 05/18/26
Key facts
- Hobby farm
- Large farm barns
- Outbuildings
Tags
Property features AI
Exterior
- Parking: Attached garage; 4-car garage
- Utilities: Well water
- Home design: Single-family residence; Residential property; Built in 1940
- Construction: Wood siding construction; Shingle roof; Built in 1940
- Exterior features: Paved road access; Well water
Interior
- Bathrooms: One full bathroom; One half bathroom
- Heating & cooling: Forced air heating
- Interior features: Fireplace; Total of 8 rooms; Crawl space and Michigan-style basement
Neighborhood map
What this means for you Summary
Snapshot
- This is a 3-bed/1.0-bath single-family listed at $250k.
Deal economics
- At list price, monthly cash flow is $-196 ($-2k/yr) — negative.
- To cash-flow at today's rent, offer at most $215k (13.9% below list).
- To meet the 1% rule (rent ≥ 1% of price), the offer needs to be $178k (28.7% below list).
- Recommended offer: $178k (28.7% below list) — sets the bar for 1% rule.
- Cap rate 5.4% vs local median 3.6% in Cedar Springs — top-decile yield for the area; either an underpriced asset or a hidden risk that comps aren't pricing in. Stress-test before assuming the spread holds.
Location & tenants
- Location reads 74/100 on livability (#180 in MI, #4,617 nationally) — a middle-class / working-renter tenant base. Strengths: cost of living A+, housing A+, crime A-; Watch: amenities D, commute F, employment D-.
- Cedar Springs Public Schools (town): math 35% / reading 48% proficiency, ranked #175 of 540 in MI (top 32%) — families likely to look elsewhere, expect single-tenant / working-renter base with shorter leases.
- Market conditions: 115 active listings in the ZIP; 2,253 units permitted in Kent County in 2024 (969 in 5+ unit buildings).
Forward outlook
- Local home prices are declining (-3.0%/yr); year-one equity from $2k of loan paydown is wiped out by about $8k of value loss. Plan a longer hold.
- Kent County population projected at +22% by 2050 — long-run rental-demand tailwind backs the buy-and-hold thesis.
Negotiation context
- Only 13 days on market — expect competitive offers; lowballing is unlikely to land.
- 3 sale attempts with the ask held roughly flat each time — persistent listings suggest the price (not the market) is what's stuck; bring a comps-based counter.
Risks & watch-outs
- Watch-outs: built in 1940 — expect roof / HVAC / electrical / plumbing capex.
Questions for the listing agent
- What do current leases actually rent for vs. the listed asking? Can we see a recent rent roll and the last 12 months of T-12 income?
- Built in 1940 — when were the roof, HVAC, electrical panel, plumbing, and water heater last replaced?
- Is there a deadline driving the sale (1031 exchange, divorce, estate, relocation)? That informs how much negotiation room exists.
- Schools are B-rated — typically a magnet for longer-tenancy family renters. What's the average tenant stay here, and is there a school-zone premium baked into asking?
- The area grade is low — what's the realistic commute time and amenity access for the typical tenant pool here? Any planned neighborhood developments (good or bad) we should know about?
- What's the average days-on-market for RENTAL listings here right now (not sales)? A rising rental-DOM trend means longer vacancies and softer asking-rent achievability than the comps imply.
- What's the recent tenant-quality profile in this submarket — average credit score on applications, eviction rate, late-payment / NSF rate, and stable-employment percentage? A property-management company in the area should have these aggregated.
- How much new for-sale + rental construction is in the pipeline within 1–3 miles? Heavy new supply typically softens prices + rents 12–24 months out; constrained supply supports both.
Investment metrics
- 1% rule
- 0.71% ✗
- Cap rate
- 5.35%
- Cash-on-cash
- -3.36%
- DSCR
- 0.85
- GRM
- 11.7
CMA / ARV
- ARV (median comp)
- $321,111
- List price
- $250,000
- Delta
- -22.15%
- Verdict
- UNDERPRICED
- Comps
- 12 within 1.0 mi
Show comp detail 2 sales within ~0.75 mi
| Address | Dist | Beds/Ba | Sqft | Sold | Price | $/sf | Match |
|---|---|---|---|---|---|---|---|
| 12984 Northland Dr NE | 0.11mi | 4/2.0 (+1) | 1,524 (+4%) | 13mo | $360,000 | $236 | 68 |
| 5177 Indian Lakes Rd NE | 0.46mi | 3/1.5 | 1,616 (+11%) | 6mo | $365,000 | $226 | 54 |
Match score weights: distance 35% · size 25% · config 20% · recency 20%. Top-matched comps best support the ARV.
Projected returns pro-forma
-3.0% appreciation · 3.0% rent growth · sell at horizon
- IRR
- -22.0%
- Equity multiple
- 0.24×
- Total profit
- $-53,055
- Equity at exit
- $37,276
- IRR
- -15.9%
- Equity multiple
- 0.11×
- Total profit
- $-62,488
- Equity at exit
- $21,615
Cash invested: $70,000 (down + closing). Projections, not guarantees.
Landlord ↔ Tenant lean methodology
- Overall (STATE)
- 62 Landlord-Friendly
- State Michigan
- 62 Landlord-Friendly · EVEN
- County
- — inherits STATE
- City
- — inherits STATE
ZIP-level market 49319
- Home prices YoY
- -31.2%
- Active inventory
- 115
- Price-to-rent
- 11.7×
Monthly cashflow live
- Estimated rent
- $1,783 medium interval (Pro) →
- Mortgage (P&I)
- −$1,311
- Tax from tax record
- −$189 /mo · $2,271/yr
- Insurance
- −$104
- HOA
- −$0
- Vacancy / Maint / Mgmt
- −$374
- Net cashflow
- $-196
Break-even live
Sensitivity live
| Price | -10% $-55 | -5% $-125 | +0% $-196 | +5% $-267 | +10% $-338 |
|---|---|---|---|---|---|
| Rent | -10% $-337 | -5% $-267 | +0% $-196 | +5% $-126 | +10% $-55 |
| Rate | -1.0pp $-70 | -0.5pp $-133 | base $-196 | +0.5pp $-261 | +1.0pp $-327 |
UW: 25.0% down · 7.5% · 30yr · 1.5% tax · 5.0% vac · 8.0% maint · 8.0% mgmt
Financing live
Cash to close
- Down payment
- $62,500
- Closing costs
- $7,500
- Reserves months
- —
- Total cash needed
- —
Loan-product check · same deal, 3 products live
Conventional
25% down · 7.5% · 30yr
- Down + closing
- —
- Monthly P&I
- —
- Monthly cashflow
- —
- DSCR
- —
- Eligible?
- —
Personal DTI + credit; lowest rate.
DSCR
20% down · 8.5% · 30yr
- Down + closing
- —
- Monthly P&I
- —
- Monthly cashflow
- —
- DSCR
- —
- Eligible?
- —
No personal income docs; deal must DSCR.
Hard money
10% down · 12.0% · 12mo
- Down + closing
- —
- Monthly P&I
- —
- Monthly cashflow
- —
- DSCR
- —
- Eligible?
- —
Short-term bridge; refi at stabilization.
Listing history 3 events
-
2026-05-14$250,000 Active 925-char remark
Show marketing remark (917 chars)
Opportunity awaits at 12940 Northland Dr. in Cedar Springs! Situated on beautiful acreage with multiple large farm barns and outbuildings, this property is full of potential for the right buyer. Whether you're looking for a hobby farm, investment opportunity, storage space, or a country fixer-upper to make your own, this property offers endless possibilities. The home needs work but provides a great opportunity to build equity and create your dream rural retreat. Enjoy the peaceful setting and wide-open space while still being conveniently located just minutes from downtown Cedar Springs and less than 2 miles from US-131 for an easy commute. With versatile barns perfect for equipment storage, workshops, animals, or future projects, this property combines rural charm with incredible convenience. Bring your vision and unlock the potential this unique property has to offer!No showings until Monday! 05/18/26
-
2026-05-14$250,000 Active 917-char remark
Show marketing remark (917 chars)
Opportunity awaits at 12940 Northland Dr. in Cedar Springs! Situated on beautiful acreage with multiple large farm barns and outbuildings, this property is full of potential for the right buyer. Whether you're looking for a hobby farm, investment opportunity, storage space, or a country fixer-upper to make your own, this property offers endless possibilities. The home needs work but provides a great opportunity to build equity and create your dream rural retreat. Enjoy the peaceful setting and wide-open space while still being conveniently located just minutes from downtown Cedar Springs and less than 2 miles from US-131 for an easy commute. With versatile barns perfect for equipment storage, workshops, animals, or future projects, this property combines rural charm with incredible convenience. Bring your vision and unlock the potential this unique property has to offer!No showings until Monday! 05/18/26
-
2026-05-14$250,000 Active
Show marketing remark (917 chars)
Opportunity awaits at 12940 Northland Dr. in Cedar Springs! Situated on beautiful acreage with multiple large farm barns and outbuildings, this property is full of potential for the right buyer. Whether you're looking for a hobby farm, investment opportunity, storage space, or a country fixer-upper to make your own, this property offers endless possibilities. The home needs work but provides a great opportunity to build equity and create your dream rural retreat. Enjoy the peaceful setting and wide-open space while still being conveniently located just minutes from downtown Cedar Springs and less than 2 miles from US-131 for an easy commute. With versatile barns perfect for equipment storage, workshops, animals, or future projects, this property combines rural charm with incredible convenience. Bring your vision and unlock the potential this unique property has to offer!No showings until Monday! 05/18/26
ⓘ Source: listings_history table (triggers on properties + properties_extension) + one-shot
backfill from property_details.listing_events for pre-trigger history.
Tax reassessment forecast MI · Partial reset (capped growth)
- Current annual tax
- $2,271 · $189/mo
- Projected year-2 tax
- $3,060 · $255/mo
- Expected delta
- +$790/yr (+$66/mo · 34.8%)
ⓘ Screening estimate from a state-policy table — verify with the county assessor before closing.
Climate risk First Street
- Flood 1/10 Low FEMA zone X (unshaded) · 0% chance over 30 yrs
- Wildfire 1/10 Low
- Heat 2/10 Low 7 d/yr ≥96°F today · 15 d/yr by 30 yrs out
- Wind 2/10 Low
- Air quality 2/10 Low 1 unhealthy d/yr today · 1 by 30 yrs out
Nearby sold comps map
Loading sold comps map…
Walkable amenities ~0.75 mi
Loading nearby amenities…
Taxation est. · year 1
- Rental income
- $21,391
- − Mortgage interest
- −$14,004
- − Property taxes
- −$2,271
- − Insurance
- −$1,250
- − Repairs & maintenance
- −$1,711
- − Management
- −$1,711
- − Depreciation
- −$7,273
- Taxable loss
- −$6,829
- Est. tax savings @ 24.0%
- +$1,639
- After-tax cash flow
- $-715/yr
For passive investors: Depreciation is non-cash, so a rental often shows a tax loss while cash-flowing — sheltering income. Rental losses are passive: they offset passive income freely, and up to $25,000/yr can offset ordinary (W-2) income if you actively participate and your MAGI is under $100k (phasing out to $0 by $150k); unused losses carry forward. On sale, claimed depreciation is recaptured at up to 25%, and gains may owe capital-gains tax (a 1031 exchange can defer both). Figures are a year-1 estimate at your 24.0% rate — not tax advice; consult a CPA.
Schools (NCES district)
- District
- Cedar Springs Public Schools
- NCES district ID
- 2608520
- Math proficiency
- 35% ▼ -11.00%
- Reading proficiency
- 48% ▼ -8.00%
- Median HH income
- $57,632
- Composite
- 36.42/100
- National rank
- #4675
- State rank
- #175 of 540 in MI
Livability — Cedar Springs
- Score
- 74/100
- State rank
- #180
- US rank
- #4617
Category grades
Schools grade is shown separately in the Schools card above.
Census & demographics
- Population (ZIP)
- 18,725
Population outlook (Kent County) Hauer SSP2
- Today (2025)
- 712,484 people
- By 2030
- 748,618 · +5.1%
- By 2040
- 814,777 · +14.4%
- By 2050
- 868,556 · +21.9%
- By 2075
- 966,487 · +35.7%
- By 2100
- 967,975 · +35.9%
Race, ethnicity, and origin ACS 2023
- Neighborhood character
- Predominantly White (89%)
- Race & ethnicity
- White 89% Two or more races 8% Hispanic / Latino 6%
- Hispanic origin (detail)
- Mexican 4% Cuban 1%
- Common ancestry
- Iranian 14% Romanian 9% Slovak 4%
- Foreign-born
- 1% · Canada
- Languages at home
- 98% English-only · Spanish 1%
Political lean MEDSL · Kent
- 2024 margin
- Lean D (+5.4) · D 51.8% · R 46.5% · Other 1.7%
- 2008→2024 swing
- +4.8pp toward D · 2008: 0.5pp · 2024: 5.4pp
- All cycles
- 2024: D+5.4 2020: D+6.1 2016: R+3.1 2012: R+7.9 2008: D+0.5
Not yet ingested
- Civics
- —
Market trends
- HPI YoY
- ▼ -124.04%
- Current HPI
- 273.4453
- Rent YoY
- —
- Metro
- —
- State GDP YoY
- ▲ 1.37%
- F500 in state
- 28
Industry mix (Fortune 500 HQ in MI)
| Industry | F500 HQs | Revenue |
|---|---|---|
| Automotive Parts | 3 | $48B |
|
||
| Automotive | 2 | $372B |
|
||
| Chemicals | 1 | $45B |
|
||
| Automotive Retail | 1 | $29B |
|
||
| Healthcare / Medical Devices | 1 | $23B |
|
||
| Automotive Technology | 1 | $20B |
|
||
Price history
+0.0% since first listed9 events — show timeline
- 2026-05-28 Pending — REALCOMP
- 2026-05-28 Pending — MiRealSource-MiMLS
- 2026-05-28 Pending — SW Michigan MLS
- 2026-05-27 Contingent — MiRealSource-MiMLS
- 2026-05-27 Contingent — REALCOMP
- 2026-05-27 Contingent — SW Michigan MLS
- 2026-05-14 Listed $250,000 SW Michigan MLS
- 2026-05-14 Listed $250,000 MiRealSource-MiMLS
- 2026-05-14 Listed $250,000 REALCOMP
Property tax history
+2.5%/yrLatest (2025): $2,271 · +2.6% YoY. Source: county tax records.
Cash-flow waterfall
monthlySold comps — $/sqft
last 12 mo · ≤1 miLoading sold comps…