 Multi-family
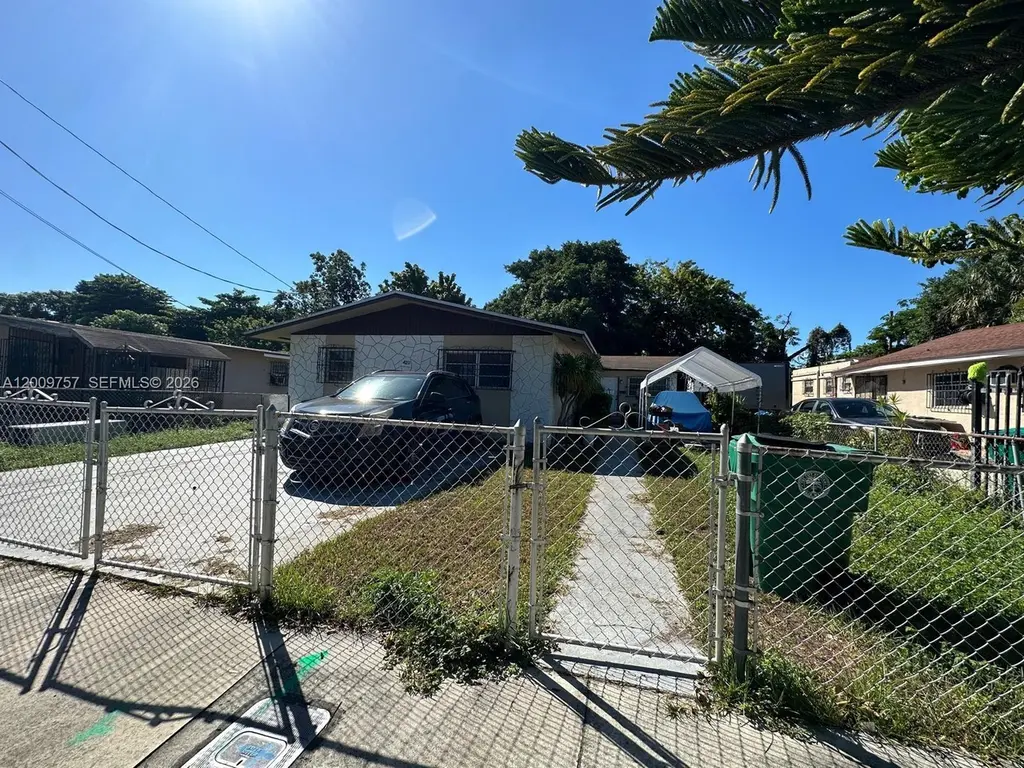
420 NW 32nd St · Miami, FL
Flood risk 1/10 · Minimal
- FEMA flood zone
- AH
- Chance of flooding over 30 yrs
- 0.0%
- Est. flood insurance / yr
- $1,142 – $2,507
Fire risk 1/10 · Minimal
- Est. fire insurance / yr
- $947 – $1,759
Heat risk 10/10 · Severe
- Hot days now (above 103°F)
- 7 days/yr
- Hot days in 30 yrs
- 30 days/yr
Wind risk 10/10 · Severe
- Chance of severe wind over 30 yrs
- 99.0%
Air-quality risk 2/10 · Minimal
- Unhealthy air days now
- 1 days/yr
- Unhealthy air days in 30 yrs
- 1 days/yr
Risk factors via First Street. Map © Google.
Why this score? — see what drove the F grade
The composite is a weighted blend of 9 inputs, each scored 0–100. Each bar is that input's sub-score; the figure is the points it added to the 100-point composite (weight × sub-score).
- ARV discount +7.5/15.0
- Schools +4.2/10.0
- Livability +3.9/5.0
- Rent growth +3.1/5.0
- Condition / age +2.5/5.0
- Cash flow +1.2/30.0
- 1% rule +0.0/10.0
- DSCR +0.0/10.0
- Appreciation +0.0/10.0
$1,676,767
🖨 Deal sheet (PDF) 📄 Offer letter ✓ Due diligence
Multi-family units
County records classify this as Multi-Family (2-4 Unit). Listing-text estimate: 1 unit. estimate disagrees with records
Listing remarks
Development opportunity in the heart of Wynwood. Property currently configured as a duplex but being marketed for its redevelopment potential. Existing structures are being sold in as-is condition with no representation as to current use or improvements. Situated on a 7,200 SF lot within a rapidly transforming corridor surrounded by new construction and major developments. Area may support multifamily development under current zoning overlays—buyer to verify zoning, density, and allowable uses. Lot dimensions are approximate and subject to verification. Ideal for investors or developers seeking to capitalize on Wynwood’s continued growth and strong demand. Property can generate
Key facts
- 200 sf lot
- 7
- 7,200 sq ft lot
Tags
Property features AI
Exterior
- Utilities: Cable available; Electricity available; Public water; Public sewer
- Home design: Facing direction not provided; Entry level not provided; Property type not provided; Stories not provided
- Construction: Zoning: 3900
- Exterior features: Rectangular lot; Publicly maintained road
Interior
- Interior features: Virtual tour available
Neighborhood map
What this means for you Summary
Snapshot
- This is a 5-bed/3.0-bath multifamily listed at $1.68M.
Deal economics
- At list price, monthly cash flow is $-7k ($-83k/yr) — negative.
- To cash-flow at today's rent, offer at most $453k (73.0% below list).
- To meet the 1% rule (rent ≥ 1% of price), the offer needs to be $572k (65.9% below list).
- Recommended offer: $453k (73.0% below list) — sets the bar for cash-flow.
- Cap rate 1.4% vs local median 1.9% in Miami — below-typical yield; the buyer is paying a premium for something (appreciation thesis, condition, location) that the cap rate doesn't capture.
Location & tenants
- Location reads 78/100 on livability (#177 in FL, #2,724 nationally) — a middle-class / working-renter tenant base. Strengths: amenities A+, commute A+, health & safety A+; Watch: employment C-, crime F, cost of living F.
- Miami-Dade (suburban): math 45% / reading 54% proficiency, ranked #40 of 73 in FL (top 55%) — families likely to look elsewhere, expect single-tenant / working-renter base with shorter leases; 64% free/reduced lunch — lower-income household profile, screen leases tightly.
- Zoned schools: Eneida M. Hartner Elementary School (math 42% / reading 37%, grade F, #1,513 of 2,144 statewide, top 73%, 377 students, 72% FRL); Jose De Diego Middle School (math 20% / reading 24%, grade F, #549 of 571 statewide, top 97%, 868 students, 68% FRL); Booker T. Washington Senior High (math 12% / reading 19%, grade F, #604 of 667 statewide, top 91%, 1,014 students, 60% FRL) — zoned schools at 67% FRL track the district average.
- Zoned-school proficiency averages 26% at this address vs 50% district-wide (-24 pts) — the specific schools serving this property underperform the Miami-Dade average; the district grade overstates school quality for this exact location.
- Market conditions: Rents rising (+2.3%/yr); 296 active listings in the ZIP; 11 comparable units currently listed for rent nearby; rentals at typical pace (median 26d on market — plan ~3-4 weeks tenant-placement turnaround); lower-income renter base — watch delinquency; 10,051 units permitted in Miami-Dade County in 2024 (7,758 in 5+ unit buildings).
- At $5,719/mo this rent would consume 166% of the median local household income ($41k/yr) (locally 2523% of renters already pay >50% of income on rent) — very limited rent-growth headroom before tenants either downsize or default.
Forward outlook
- Local home prices are declining (-3.0%/yr); year-one equity from $12k of loan paydown is wiped out by about $50k of value loss. Plan a longer hold.
- Miami-Dade County population projected at +28% by 2050 — long-run rental-demand tailwind backs the buy-and-hold thesis.
Negotiation context
- It's been on market 51 days — a 3% lower offer ($1.63M) is reasonable based on typical stale-listing flexibility.
- 3 sale attempts with the ask held roughly flat each time — persistent listings suggest the price (not the market) is what's stuck; bring a comps-based counter.
Risks & watch-outs
- Watch-outs: flood insurance adds $152/mo.
- Climate carrying-cost: in FEMA flood zone AH (mandatory federal flood insurance); severe wind risk, 99% chance of damaging wind over 30y; extreme-heat days projected 7→30/yr by 2055 (HVAC capex compounding) — expect insurance premiums to compound above CPI over the hold.
Questions for the listing agent
- What do current leases actually rent for vs. the listed asking? Can we see a recent rent roll and the last 12 months of T-12 income?
- It's been on market 51 days. Have you received any prior offers? Is the seller open to a 73% concession, seller financing, or rate buy-down credit?
- Built in 1971 — when were the roof, HVAC, electrical panel, plumbing, and water heater last replaced?
- What's the actual annual flood-insurance premium (NFIP or private), and is the property in a SFHA with mandatory coverage?
- Is there a deadline driving the sale (1031 exchange, divorce, estate, relocation)? That informs how much negotiation room exists.
- Schools are B-rated — typically a magnet for longer-tenancy family renters. What's the average tenant stay here, and is there a school-zone premium baked into asking?
- Crime grade is F in this area — have there been break-ins, vandalism, or insurance claims at this property in the last 3 years? What carrier currently insures it and at what premium?
- The area grade is low — what's the realistic commute time and amenity access for the typical tenant pool here? Any planned neighborhood developments (good or bad) we should know about?
- What's the average days-on-market for RENTAL listings here right now (not sales)? A rising rental-DOM trend means longer vacancies and softer asking-rent achievability than the comps imply.
- What's the recent tenant-quality profile in this submarket — average credit score on applications, eviction rate, late-payment / NSF rate, and stable-employment percentage? A property-management company in the area should have these aggregated.
- How much new apartment / multifamily construction is in the pipeline within 1–3 miles? Heavy new supply (>2% of stock underway) typically softens rents 12–24 months out; light construction supports rent growth.
Investment metrics
- 1% rule
- 0.34% ✗
- Cap rate
- 1.44%
- Cash-on-cash
- -17.32%
- DSCR
- 0.23
- GRM
- 24.4
CMA / ARV
No comps found within radius.
Projected returns pro-forma
-3.0% appreciation · 2.26% rent growth · sell at horizon
- IRR
- -52.4%
- Equity multiple
- -0.53×
- Total profit
- $-717,187
- Equity at exit
- $250,011
- IRR
- —
- Equity multiple
- -1.58×
- Total profit
- $-1,209,786
- Equity at exit
- $144,976
Cash invested: $469,495 (down + closing). Projections, not guarantees.
Landlord ↔ Tenant lean methodology
- Overall (STATE)
- 87 Strongly Landlord-Friendly
- State Florida
- 87 Strongly Landlord-Friendly · R+3
- County
- — inherits STATE
- City
- — inherits STATE
ZIP-level market 33127
- Home prices YoY
- -30.1%
- Rents YoY
- 2.3%
- Active inventory
- 296
- Price-to-rent
- 48.9×
Monthly cashflow live
- Estimated rent
- $5,719 medium interval (Pro) →
- Mortgage (P&I)
- −$8,793
- Tax from tax record
- −$1,802 /mo · $21,626/yr
- Insurance
- −$699
- Flood insurance flood zone
- −$152 /mo · $1,824/yr
- HOA
- −$0
- Vacancy / Maint / Mgmt
- −$1,201
- Net cashflow
- $-6,928
Break-even live
Sensitivity live
| Price | -10% $-5,979 | -5% $-6,453 | +0% $-6,928 | +5% $-7,403 | +10% $-7,877 |
|---|---|---|---|---|---|
| Rent | -10% $-7,380 | -5% $-7,154 | +0% $-6,928 | +5% $-6,702 | +10% $-6,476 |
| Rate | -1.0pp $-6,084 | -0.5pp $-6,502 | base $-6,928 | +0.5pp $-7,363 | +1.0pp $-7,805 |
2-unit breakdown (identical units grouped — click to expand)
| Units | Beds | Baths | Est. rent |
|---|---|---|---|
| 2× units | 2 | 1 | $5,718 |
| #1 | 2 | 1 | $2,859 |
| #2 | 2 | 1 | $2,859 |
| Total (2 units) | $5,719 | ||
UW: 25.0% down · 7.5% · 30yr · 1.5% tax · 5.0% vac · 8.0% maint · 8.0% mgmt
Financing live
Cash to close
- Down payment
- $419,192
- Closing costs
- $50,303
- Reserves months
- —
- Total cash needed
- —
Loan-product check · same deal, 3 products live
Conventional
25% down · 7.5% · 30yr
- Down + closing
- —
- Monthly P&I
- —
- Monthly cashflow
- —
- DSCR
- —
- Eligible?
- —
Personal DTI + credit; lowest rate.
DSCR
20% down · 8.5% · 30yr
- Down + closing
- —
- Monthly P&I
- —
- Monthly cashflow
- —
- DSCR
- —
- Eligible?
- —
No personal income docs; deal must DSCR.
Hard money
10% down · 12.0% · 12mo
- Down + closing
- —
- Monthly P&I
- —
- Monthly cashflow
- —
- DSCR
- —
- Eligible?
- —
Short-term bridge; refi at stabilization.
Rent comps 11 comps
| Address | Beds | Baths | Sqft | Rent | $/sqft | DOM | Units | Dist |
|---|---|---|---|---|---|---|---|---|
| 121 NE 34th St Miami, FL | 4.0 | 5.0 | 2648 | $25,000 | $9.44 | 26d | 1 | 0.69mi |
| 480 NE 31st St Miami, FL | 4.0 | 4.5 | 2379 | $19,000 | $7.99 | 26d | 1 | 1.00mi |
| 555 NE 34th St Miami, FL | 1.0–4.0 | 1.5–4.0 | 2653 | $18,997 | $7.16 | 0d | 19 | 1.06mi |
| 700 NE 26th Ter #2901 Miami, FL | 4.0 | 4.5 | 2368 | $25,500 | $10.77 | 26d | 1 | 1.10mi |
| 4675 NE 2nd Ave Miami, FL | 5.0 | 3.0 | 2248 | $27,500 | $12.23 | 4d | 1 | 1.12mi |
| 4675 NE 2nd Ave Miami, FL | 5.0 | 3.0 | 2248 | $27,500 | $12.23 | 4d | 1 | 1.12mi |
| 700 NE 24th St Unit 1601 Miami, FL | 4.0 | 5.5 | 2530 | $29,995 | $11.86 | 26d | 1 | 1.14mi |
| 725 NE 24th St #4007 Miami, FL | 4.0 | 5.5 | 2582 | $20,000 | $7.75 | 16d | 1 | 1.14mi |
| 711 NE 23rd Ter Unit 607 Miami, FL | 4.0 | 5.5 | 2216 | $19,500 | $8.80 | 26d | 1 | 1.16mi |
| 711 NE 23rd Ter Unit 607 Miami, FL | 4.0 | 5.5 | 2216 | $19,500 | $8.80 | 0d | 1 | 1.16mi |
| 788 NE 23rd St Miami, FL | 3.0–4.0 | 4.0–4.5 | 2322 | $26,000 | $11.20 | 26d | 2 | 1.19mi |
Listing history 20 events
-
2026-06-21days on market $1,676,767 Active 51 DOM
-
2026-06-18days on market $1,676,767 Active 48 DOM
-
2026-06-17days on market $1,676,767 Active 47 DOM
-
2026-06-16days on market $1,676,767 Active 46 DOM
-
2026-06-15days on market $1,676,767 Active 45 DOM
-
2026-06-13days on market $1,676,767 Active 43 DOM
-
2026-06-09days on market $1,676,767 Active 39 DOM
-
2026-06-08days on market $1,676,767 Active 38 DOM
-
2026-06-07days on market $1,676,767 Active 37 DOM
-
2026-06-04days on market $1,676,767 Active 34 DOM
-
2026-06-03days on market $1,676,767 Active 33 DOM
-
2026-06-02days on market $1,676,767 Active 32 DOM
-
2026-06-01days on market $1,676,767 Active 31 DOM
-
2026-05-31days on market $1,676,767 Active 30 DOM
-
2026-05-01$1,676,767 Active
-
2025-11-06historical
-
2025-08-15status Active
-
2025-08-15price $1,749,000
-
2025-07-11status Pending
-
2025-03-15$1,900,000 Active
ⓘ Source: listings_history table (triggers on properties + properties_extension) + one-shot
backfill from property_details.listing_events for pre-trigger history.
Tax reassessment forecast FL · Resets to sale price
- Current annual tax
- $21,626 · $1,802/mo
- Projected year-2 tax
- $21,626 · $1,802/mo
- Expected delta
- $0/yr ($0/mo · 0.0%)
ⓘ Screening estimate from a state-policy table — verify with the county assessor before closing.
Climate risk First Street
- Flood 1/10 Low FEMA zone AH · 0% chance over 30 yrs
- Wildfire 1/10 Low
- Heat 10/10 Extreme 7 d/yr ≥103°F today · 30 d/yr by 30 yrs out
- Wind 10/10 Extreme 99% chance of damaging wind over 30 yrs
- Air quality 2/10 Low 1 unhealthy d/yr today · 1 by 30 yrs out
Nearby sold comps map
Loading sold comps map…
Walkable amenities ~0.75 mi
Loading nearby amenities…
Taxation est. · year 1
- Rental income
- $68,628
- − Mortgage interest
- −$93,925
- − Property taxes
- −$21,626
- − Insurance
- −$10,208
- − Repairs & maintenance
- −$5,490
- − Management
- −$5,490
- − Depreciation
- −$48,779
- Taxable loss
- −$116,891
- Est. tax savings @ 24.0%
- +$28,054
- After-tax cash flow
- $-55,083/yr
For passive investors: Depreciation is non-cash, so a rental often shows a tax loss while cash-flowing — sheltering income. Rental losses are passive: they offset passive income freely, and up to $25,000/yr can offset ordinary (W-2) income if you actively participate and your MAGI is under $100k (phasing out to $0 by $150k); unused losses carry forward. On sale, claimed depreciation is recaptured at up to 25%, and gains may owe capital-gains tax (a 1031 exchange can defer both). Figures are a year-1 estimate at your 24.0% rate — not tax advice; consult a CPA.
Schools (NCES district)
- District
- Miami-Dade
- NCES district ID
- 1200390
- Math proficiency
- 45% ▼ -16.00%
- Reading proficiency
- 54% ▼ -5.00%
- Median HH income
- $43,928
- Composite
- 41.76/100
- National rank
- #3397
- State rank
- #40 of 73 in FL
Livability — Miami
- Score
- 78/100
- State rank
- #177
- US rank
- #2724
Category grades
Schools grade is shown separately in the Schools card above.
Census & demographics
- Census place
- Miami, FL
- County
- Miami-Dade County · 2,697,751 people
- City population
- 827,308
- Metro
- Miami-Fort Lauderdale-Pompano Beach, FL
- Population (ZIP)
- 26,786
- Household income
- $41,230
- Rent vs Own
- Severe rent burden
- 2523.0
Population outlook (Miami-Dade County) Hauer SSP2
- Today (2025)
- 3,126,439 people
- By 2030
- 3,325,765 · +6.4%
- By 2040
- 3,697,561 · +18.3%
- By 2050
- 4,012,134 · +28.3%
- By 2075
- 4,605,612 · +47.3%
- By 2100
- 4,866,598 · +55.7%
Race, ethnicity, and origin ACS 2023
- Neighborhood character
- Majority Hispanic (55%)
- Race & ethnicity
- Hispanic / Latino 55% Black 39% Two or more races 30% White 4%
- Hispanic origin (detail)
- Mexican 2% Puerto Rican 6% Cuban 9% Dominican 5%
- Common ancestry
- Hispanic 11%
- Foreign-born
- 43% · Canada, Jamaica, Dominican Republic
- Languages at home
- 34% English-only · Spanish 53% French/Haitian/Cajun 12%
Political lean MEDSL · Miami-Dade
- 2024 margin
- R (+11.4) · D 43.9% · R 55.4%
- 2008→2024 swing
- -27.6pp toward R · 2008: 16.1pp · 2024: -11.4pp
- All cycles
- 2024: R+11.4 2020: D+7.3 2016: D+29.6 2012: D+23.7 2008: D+16.1
Not yet ingested
- Civics
- —
Market trends
- HPI YoY
- ▼ -293.00%
- Current HPI
- 680.1845
- Rent YoY
- ▲ 2.26%
- Metro
- Miami-Fort Lauderdale-Pompano Beach, FL
- State GDP YoY
- ▲ 3.28%
- F500 in state
- 36
Industry mix (Fortune 500 HQ in FL)
| Industry | F500 HQs | Revenue |
|---|---|---|
| Industrial Technology | 2 | $29B |
|
||
| Insurance | 2 | $17B |
|
||
| Retail | 1 | $60B |
|
||
| Technology Distribution | 1 | $58B |
|
||
| Homebuilding | 1 | $35B |
|
||
| Technology Manufacturing | 1 | $35B |
|
||
Price history
-11.7% since first listed6 events — show timeline
- 2026-05-01 Listed $1,676,767 MARMLS
- 2025-11-06 Listing Removed — MARMLS
- 2025-08-15 Relisted — MARMLS
- 2025-08-15 Price Changed $1,749,000 MARMLS
- 2025-07-11 Pending — MARMLS
- 2025-03-15 Listed $1,900,000 MARMLS
Property tax history
+17.6%/yrLatest (2025): $21,626 · +32.0% YoY. Source: county tax records.
Cash-flow waterfall
monthlySold comps — $/sqft
last 12 mo · ≤1 miLoading sold comps…