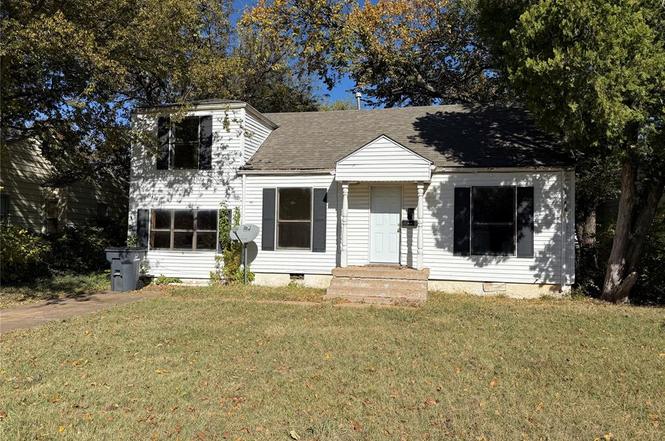
1711 NW Liberty Ave · Lawton, OK
Flood risk 1/10 · Minimal
- FEMA flood zone
- X (unshaded)
- Chance of flooding over 30 yrs
- 0.0%
- Est. flood insurance / yr
- $507 – $1,088
Fire risk 2/10 · Minimal
- Est. fire insurance / yr
- $2,463 – $4,575
Heat risk 6/10 · Moderate
- Hot days now (above 108°F)
- 7 days/yr
- Hot days in 30 yrs
- 18 days/yr
Wind risk 3/10 · Minor
- Chance of severe wind over 30 yrs
- 5.0%
Air-quality risk 1/10 · Minimal
- Unhealthy air days now
- 0 days/yr
- Unhealthy air days in 30 yrs
- 0 days/yr
Risk factors via First Street. Map © Google.
Why this score? — see what drove the B- grade
The composite is a weighted blend of 9 inputs, each scored 0–100. Each bar is that input's sub-score; the figure is the points it added to the 100-point composite (weight × sub-score).
- Cash flow +30.0/30.0
- 1% rule +10.0/10.0
- DSCR +10.0/10.0
- ARV discount +7.5/15.0
- Livability +3.2/5.0
- Rent growth +2.6/5.0
- Condition / age +2.5/5.0
- Schools +2.0/10.0
- Appreciation +0.0/10.0
$69,000
🖨 Deal sheet 📄 Offer letter ✓ Due diligence
Listing remarks
CALLING ALL INVESTORS! This 3-bedroom home offers endless potential and is ready for your personal touch. It’s the perfect blank canvas for a full remodel, rental, or flip project. Conveniently located near Liberty Lake and Liberty Park, this property provides easy access to outdoor recreation, shopping, and major highways. Bring your vision and make this one shine again!
Key facts
- 8,660 sq ft lot
- Built 1941
- Listed 113 days
Tags
Property features AI
Finance
- Other: Homestead exemption indicated; Located in Liberty Heights addition; Directions: From NW Victory Blvd, head east on NW Liberty. Home is on the left
- Financial info: Not assumable
- HOA & community: No mandatory association dues
Exterior
- Home design: Single family residence; One-level property; Residential property
- Construction: Brick and frame construction; Shingle roof; Conventional foundation; Existing property
- Exterior features: Interior lot; No additional exterior features listed
Interior
- Bedrooms: 3 bedrooms
- Bathrooms: 1 full bath; 1 half bath
- Interior features: One living area; No fireplace
Neighborhood map
What this means for you Summary
Snapshot
- This is a 3-bed/2.0-bath single-family listed at $69k.
Deal economics
- At list price, monthly cash flow is $473 ($6k/yr) — positive.
- The deal already cash-flows at list — no discount required.
- Meets the 1% rule at list price ($1k rent vs $69k).
- Recommended offer: $63k (9.0% below list) — sets the bar for market timing.
- Cap rate 14.5% vs local median 6.1% in Lawton — top-decile yield for the area; either an underpriced asset or a hidden risk that comps aren't pricing in. Stress-test before assuming the spread holds.
Location & tenants
- Location reads 63/100 on livability (#206 in OK) — a middle-class / working-renter tenant base. Strengths: cost of living A+, housing A+; Watch: employment D, crime F, commute F.
- Lawton (urban): math 20% / reading 26% proficiency, ranked #137 of 270 in OK (top 51%) — low school quality limits family demand, transient renter base, plan for 1-2y turnover.
- Zoned schools: Whittier Es (math 22% / reading 17%, grade F, #479 of 845 statewide, top 63%, 351 students, 0% FRL); Lawton Hs (math 16% / reading 21%, grade F, #302 of 447 statewide, top 68%, 1,417 students, 0% FRL) — zoned schools average 0% FRL vs 54% district-wide (54 pts lower); this property's tenant base skews higher-income than the district average.
- Market conditions: Rents flat; 208 active listings in the ZIP; 133 units permitted in Comanche County in 2024 (0 in 5+ unit buildings).
Forward outlook
- Local home prices are declining (-3.0%/yr); year-one equity from $477 of loan paydown is wiped out by about $2k of value loss. Plan a longer hold.
- Comanche County population projected to shrink 3% by 2050 — rents likely to lag national; underwrite the cash flow, not the appreciation.
- At projected returns (-3.0% appreciation + 0.2% rent growth), your $19k cash investment doubles in ~5 years — after that, you're playing with house money.
Negotiation context
- It's been on market 113 days — a 9% lower offer ($63k) is reasonable based on typical stale-listing flexibility.
- 2 sale attempts; this cycle's ask has dropped $16k (19%) from the opening price — seller is motivated, your offer sets the floor, not the list.
Risks & watch-outs
- Watch-outs: built in 1941 — expect roof / HVAC / electrical / plumbing capex.
- Climate carrying-cost: extreme-heat days projected 7→18/yr by 2055 (HVAC capex compounding) — expect insurance premiums to compound above CPI over the hold.
Questions for the listing agent
- It's been on market 113 days. Have you received any prior offers? Is the seller open to a 9% concession, seller financing, or rate buy-down credit?
- Built in 1941 — when were the roof, HVAC, electrical panel, plumbing, and water heater last replaced?
- Why hasn't it sold? Are there any deal-killer items the seller is aware of (foundation, flood, title, zoning, code violations)?
- Is there a deadline driving the sale (1031 exchange, divorce, estate, relocation)? That informs how much negotiation room exists.
- Schools are D-rated, which usually means shorter tenancies and higher turnover. Who's the typical renter profile here, and what's been the actual vacancy rate?
- Crime grade is F in this area — have there been break-ins, vandalism, or insurance claims at this property in the last 3 years? What carrier currently insures it and at what premium?
- What's the average days-on-market for RENTAL listings here right now (not sales)? A rising rental-DOM trend means longer vacancies and softer asking-rent achievability than the comps imply.
- What's the recent tenant-quality profile in this submarket — average credit score on applications, eviction rate, late-payment / NSF rate, and stable-employment percentage? A property-management company in the area should have these aggregated.
- How much new for-sale + rental construction is in the pipeline within 1–3 miles? Heavy new supply typically softens prices + rents 12–24 months out; constrained supply supports both.
Investment metrics
- 1% rule
- 1.72% ✓
- Cap rate
- 14.52%
- Cash-on-cash
- 29.37%
- DSCR
- 2.31
- GRM
- 4.8
CMA / ARV
- ARV (on-the-fly)
- $167,232
- Comps found
- 12
Show comp detail 12 sales within ~0.75 mi
| Address | Dist | Beds/Ba | Sqft | Sold | Price | $/sf | Match |
|---|---|---|---|---|---|---|---|
| 1711 NW Liberty Ave | 0.00mi | 3/1.5 | 1,608 (0%) | 1mo | $55,000 | $34 | 97 |
| 1718 NW Maple Ave | 0.05mi | 4/2.0 (+1) | 1,500 (-7%) | 1mo | $165,000 | $110 | 81 |
| 1710 NW Kinyon Ave | 0.09mi | 3/2.0 | 1,400 (-13%) | 0mo | $130,000 | $93 | 74 |
| 1315 NW Ash Ave | 0.37mi | 3/2.0 | 1,400 (-13%) | 1mo | $150,000 | $107 | 60 |
| 1106 NW Elm Ave | 0.55mi | 3/2.0 | 1,500 (-7%) | 4mo | $149,000 | $99 | 60 |
| 1712 NW Bell Ave | 0.57mi | 3/2.0 | 1,500 (-7%) | 6mo | $100,000 | $67 | 57 |
| 1616 NW Taylor Ave | 0.46mi | 3/2.0 | 1,400 (-13%) | 5mo | $145,000 | $104 | 52 |
| 1705 NW Lake Ave | 0.62mi | 3/2.0 | 1,416 (-12%) | 1mo | $179,000 | $126 | 50 |
| 1118 NW Elm Ave | 0.49mi | 4/2.0 (+1) | 1,800 (+12%) | 4mo | $85,000 | $47 | 50 |
| 652 NW Waterford Dr | 0.68mi | 3/2.0 | 1,800 (+12%) | 1mo | $245,000 | $136 | 48 |
| 1505 NW Lake Ave | 0.65mi | 3/2.0 | 1,400 (-13%) | 4mo | $61,001 | $44 | 45 |
| 1516 NW Lake Ave | 0.67mi | 4/2.0 (+1) | 1,800 (+12%) | 4mo | $225,000 | $125 | 40 |
Match score weights: distance 35% · size 25% · config 20% · recency 20%. Top-matched comps best support the ARV.
Projected returns pro-forma
-3.0% appreciation · 0.25% rent growth · sell at horizon
- IRR
- 20.7%
- Equity multiple
- 1.81×
- Total profit
- $15,742
- Equity at exit
- $10,288
- IRR
- 27.0%
- Equity multiple
- 3.07×
- Total profit
- $40,089
- Equity at exit
- $5,966
Cash invested: $19,320 (down + closing). Projections, not guarantees.
Landlord ↔ Tenant lean methodology
- Overall (STATE)
- 83 Strongly Landlord-Friendly
- State Oklahoma
- 83 Strongly Landlord-Friendly · R+20
- County
- — inherits STATE
- City
- — inherits STATE
ZIP-level market 73507
- Home prices YoY
- -23.2%
- Rents YoY
- 0.2%
- Active inventory
- 208
- Price-to-rent
- 4.8×
Monthly cashflow live
- Estimated rent
- $1,190 medium interval (Pro) →
- Mortgage (P&I)
- −$362
- Tax from tax record
- −$77 /mo · $922/yr
- Insurance
- −$29
- HOA
- −$0
- Vacancy / Maint / Mgmt
- −$250
- Net cashflow
- $473
Break-even live
UW: 25.0% down · 7.5% · 30yr · 1.5% tax · 5.0% vac · 8.0% maint · 8.0% mgmt
Financing live
Cash to close
- Down payment
- $17,250
- Closing costs
- $2,070
- Reserves months
- —
- Total cash needed
- —
Loan-product check · same deal, 3 products live
Conventional
25% down · 7.5% · 30yr
- Down + closing
- —
- Monthly P&I
- —
- Monthly cashflow
- —
- DSCR
- —
- Eligible?
- —
Personal DTI + credit; lowest rate.
DSCR
20% down · 8.5% · 30yr
- Down + closing
- —
- Monthly P&I
- —
- Monthly cashflow
- —
- DSCR
- —
- Eligible?
- —
No personal income docs; deal must DSCR.
Hard money
10% down · 12.0% · 12mo
- Down + closing
- —
- Monthly P&I
- —
- Monthly cashflow
- —
- DSCR
- —
- Eligible?
- —
Short-term bridge; refi at stabilization.
Listing history 7 events
-
2026-04-30status Pending
-
2026-03-25price $69,000
-
2026-02-13price $79,000
-
2026-01-16status Active
-
2025-11-19status Pending
-
2025-11-09$85,000 Active
-
2022-09-27soldstatus $70,000
ⓘ Source: listings_history table (triggers on properties + properties_extension) + one-shot
backfill from property_details.listing_events for pre-trigger history.
Tax reassessment forecast OK · Resets to sale price
- Current annual tax
- $922 · $77/mo
- Projected year-2 tax
- $922 · $77/mo
- Expected delta
- $0/yr ($0/mo · 0.0%)
ⓘ Screening estimate from a state-policy table — verify with the county assessor before closing.
Climate risk First Street
- Flood 1/10 Low FEMA zone X (unshaded) · 0% chance over 30 yrs
- Wildfire 2/10 Low
- Heat 6/10 Major 7 d/yr ≥108°F today · 18 d/yr by 30 yrs out
- Wind 3/10 Moderate 5% chance of damaging wind over 30 yrs
- Air quality 1/10 Low 0 unhealthy d/yr today · 0 by 30 yrs out
Nearby sold comps map
Loading sold comps map…
Walkable amenities ~0.75 mi
Loading nearby amenities…
Taxation est. · year 1
- Rental income
- $14,283
- − Mortgage interest
- −$3,865
- − Property taxes
- −$922
- − Insurance
- −$345
- − Repairs & maintenance
- −$1,143
- − Management
- −$1,143
- − Depreciation
- −$2,007
- Taxable income
- $4,858
- Est. tax owed @ 24.0%
- −$1,166
- After-tax cash flow
- $4,508/yr
For passive investors: Depreciation is non-cash, so a rental often shows a tax loss while cash-flowing — sheltering income. Rental losses are passive: they offset passive income freely, and up to $25,000/yr can offset ordinary (W-2) income if you actively participate and your MAGI is under $100k (phasing out to $0 by $150k); unused losses carry forward. On sale, claimed depreciation is recaptured at up to 25%, and gains may owe capital-gains tax (a 1031 exchange can defer both). Figures are a year-1 estimate at your 24.0% rate — not tax advice; consult a CPA.
Schools (NCES district)
- District
- Lawton
- NCES district ID
- 4017250
- Math proficiency
- 20% ▼ -12.00%
- Reading proficiency
- 26% ▼ -9.00%
- Median HH income
- $42,618
- Composite
- 19.68/100
- National rank
- #8732
- State rank
- #137 of 270 in OK
Livability — Lawton
- Score
- 63/100
- State rank
- #206
- US rank
- #15131
Category grades
Schools grade is shown separately in the Schools card above.
Census & demographics
- Census place
- Lawton, OK
- County
- Comanche County · 96,361 people
- City population
- 89,233
- Metro
- Lawton, OK
- Population (ZIP)
- 21,046
- Household income
- $62,132
- Rent vs Own
- Severe rent burden
- 979.0
Population outlook (Comanche County) Hauer SSP2
- Today (2025)
- 124,518 people
- By 2030
- 124,231 · -0.2%
- By 2040
- 122,193 · -1.9%
- By 2050
- 120,368 · -3.3%
- By 2075
- 120,492 · -3.2%
- By 2100
- 123,113 · -1.1%
Race, ethnicity, and origin ACS 2023
- Neighborhood character
- Diverse neighborhood (Simpson 0.65)
- Race & ethnicity
- White 56% Hispanic / Latino 14% Two or more races 13% Black 13% Native American 7% Asian 2%
- Hispanic origin (detail)
- Mexican 7% Puerto Rican 4%
- Common ancestry
- Lithuanian 2% Slovak 2% Italian 1%
- Foreign-born
- 5% · Canada, South Korea
- Languages at home
- 89% English-only · Spanish 6% German/W. Germanic 1% Other Asian/Pacific 1%
Political lean MEDSL · Comanche
- 2024 margin
- Strong R (+23.3) · D 37.4% · R 60.7% · Other 1.9%
- 2008→2024 swing
- -5.8pp toward R · 2008: -17.5pp · 2024: -23.3pp
- All cycles
- 2024: R+23.3 2020: R+20.1 2016: R+23.7 2012: R+17.0 2008: R+17.5
Not yet ingested
- Civics
- —
Market trends
- HPI YoY
- ▼ -38.48%
- Current HPI
- 127.057
- Rent YoY
- ▲ 0.25%
- Metro
- Lawton, OK
- State GDP YoY
- ▲ 1.55%
- F500 in state
- 6
Industry mix (Fortune 500 HQ in OK)
| Industry | F500 HQs | Revenue |
|---|---|---|
| Energy | 3 | $48B |
|
||
Price history
-1.4% since first listed7 events — show timeline
- 2026-04-30 Pending — MLSOK
- 2026-03-25 Price Changed $69,000 MLSOK
- 2026-02-13 Price Changed $79,000 MLSOK
- 2026-01-16 Relisted — MLSOK
- 2025-11-19 Pending — MLSOK
- 2025-11-09 Listed $85,000 MLSOK
- 2022-09-27 Sold (Public Records) $70,000 Public Records
Property tax history
+0.3%/yrLatest (2025): $922 · +4.8% YoY. Source: county tax records.
Cash-flow waterfall
monthlySold comps — $/sqft
last 12 mo · ≤1 miLoading sold comps…