7823 Appleton St · Houston, TX
Flood risk 1/10 · Minimal
- FEMA flood zone
- X (unshaded)
- Chance of flooding over 30 yrs
- 0.0%
- Est. flood insurance / yr
- $507 – $1,088
Fire risk 1/10 · Minimal
- Est. fire insurance / yr
- $1,222 – $2,270
Heat risk 9/10 · Severe
- Hot days now (above 109°F)
- 7 days/yr
- Hot days in 30 yrs
- 24 days/yr
Wind risk 9/10 · Severe
- Chance of severe wind over 30 yrs
- 99.0%
Air-quality risk 3/10 · Minor
- Unhealthy air days now
- 2 days/yr
- Unhealthy air days in 30 yrs
- 3 days/yr
Risk factors via First Street. Map © Google.
Why this score? — see what drove the C+ grade
The composite is a weighted blend of 9 inputs, each scored 0–100. Each bar is that input's sub-score; the figure is the points it added to the 100-point composite (weight × sub-score).
- Cash flow +26.2/30.0
- DSCR +8.9/10.0
- 1% rule +8.7/10.0
- ARV discount +7.5/15.0
- Livability +3.7/5.0
- Rent growth +3.6/5.0
- Schools +2.7/10.0
- Condition / age +2.5/5.0
- Appreciation +0.0/10.0
$120,000
🖨 Deal sheet 📄 Offer letter ✓ Due diligence
Listing remarks
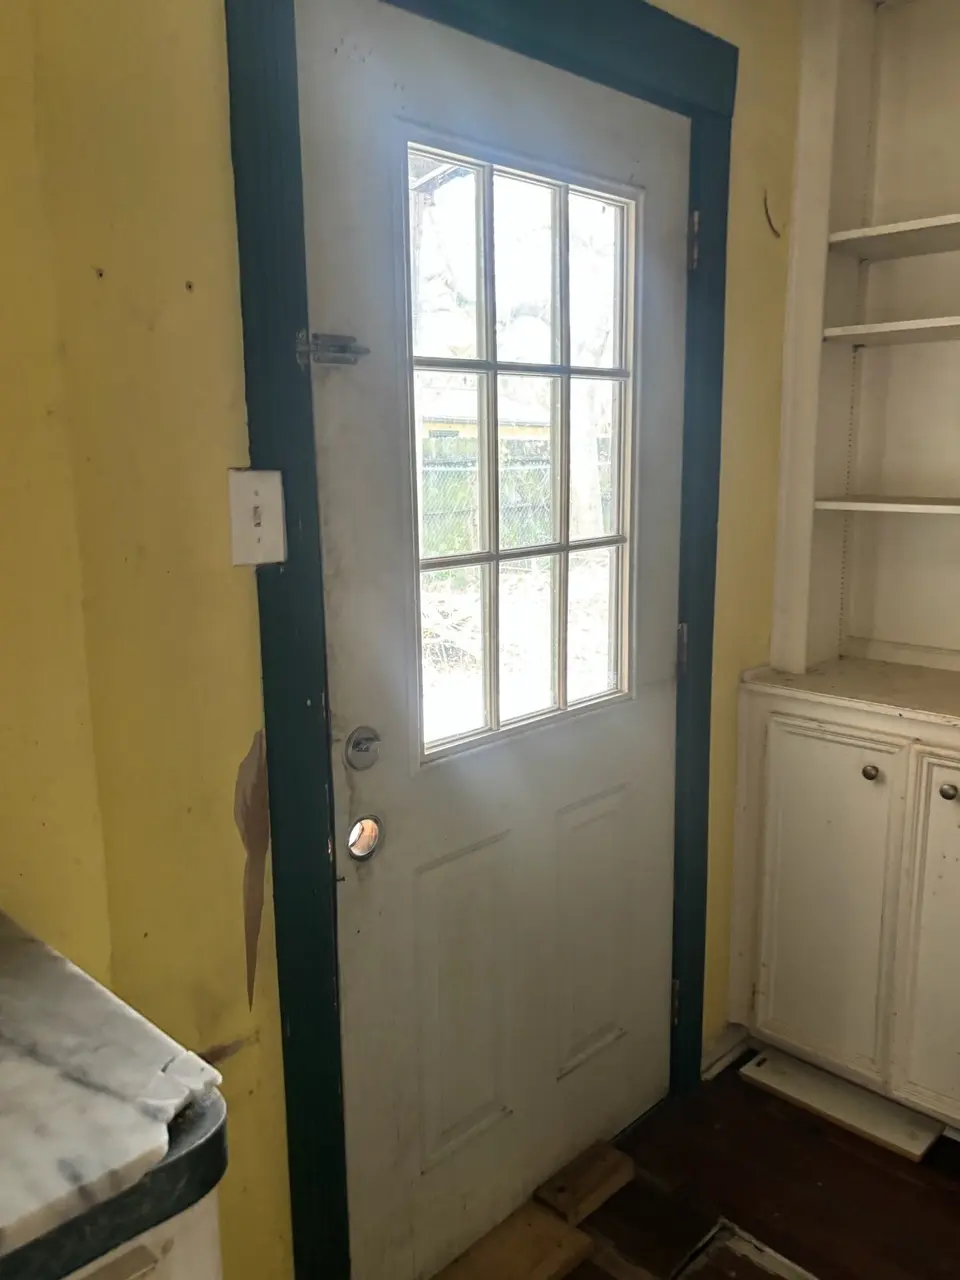
This property, sold AS-IS, holds unlimited potential in a sought-after investor neighborhood. With one of the larger lots and a prime location, it presents a promising opportunity. While not a complete tear down, the building requires some work, making it ideal for a DIY enthusiast or investor. This Single-Family home at 7823 Appleton offers 2 bedrooms, 1 bathroom, 1568 square feet of living space, and a 7250 square foot lot. Built in 1940, it is ripe for transformation and growth.
Key facts
- Larger lots
- Prime location
- 7,248 sq ft lot
Tags
Property features AI
Finance
- Other: Seller disclosure available
Exterior
- Utilities: Public water; Public sewer
- Home design: Residential property; One-story layout; Built in 1940
- Construction: Brick and stucco exterior; Shingle and wood roof; Slab foundation
- Exterior features: Subdivision lot
Interior
- Bedrooms: Two bedrooms on the first floor (approx. 11x10 and 9x10)
- Bathrooms: One full bathroom
- Interior features: Two total rooms
Neighborhood map
What this means for you Summary
Snapshot
- This is a 2-bed/1.0-bath single-family listed at $120k.
Deal economics
- At list price, monthly cash flow is $306 ($4k/yr) — positive.
- The deal already cash-flows at list — no discount required.
- Meets the 1% rule at list price ($2k rent vs $120k).
- Recommended offer: $118k (1.5% below list) — sets the bar for market timing.
- Cap rate 9.3% vs local median 3.2% in Houston — top-decile yield for the area; either an underpriced asset or a hidden risk that comps aren't pricing in. Stress-test before assuming the spread holds.
Location & tenants
- Location reads 74/100 on livability (#184 in TX, #4,771 nationally) — a middle-class / working-renter tenant base. Strengths: amenities A+, cost of living A+, housing A+; Watch: crime F.
- Houston ISD (urban): math 27% / reading 35% proficiency, ranked #593 of 826 in TX (top 72%) — families likely to look elsewhere, expect single-tenant / working-renter base with shorter leases; 71% free/reduced lunch — lower-income household profile, screen leases tightly.
- Zoned schools: Burbank Middle (math 37% / reading 42%, grade F, #660 of 1,662 statewide, top 41%, 1,417 students, 96% FRL); Houston Math Science And Technology Center (math 9% / reading 21%, grade F, #1,507 of 1,632 statewide, top 93%, 2,779 students, 95% FRL) — zoned schools average 96% FRL vs 71% district-wide (24 pts higher); higher-poverty schools than district average — tighter screening recommended.
- Market conditions: Rents rising fast (+4.5%/yr); 285 active listings in the ZIP; 15 comparable units currently listed for rent nearby; rentals at typical pace (median 24d on market — plan ~3-4 weeks tenant-placement turnaround); 29,883 units permitted in Harris County in 2024 (8,621 in 5+ unit buildings).
- This rent runs 37% of the median local income ($53k/yr) — at the standard rent-burdened threshold; future hikes will face affordability resistance.
Forward outlook
- Local home prices are declining (-3.0%/yr); year-one equity from $830 of loan paydown is wiped out by about $4k of value loss. Plan a longer hold.
- Harris County population projected at +47% by 2050 — long-run rental-demand tailwind backs the buy-and-hold thesis.
- At projected returns (-3.0% appreciation + 4.5% rent growth), your $34k cash investment doubles in ~9 years — after that, you're playing with house money.
Negotiation context
- It's been on market 25 days — a 2% lower offer ($118k) is reasonable based on typical stale-listing flexibility.
Risks & watch-outs
- Watch-outs: property tax is 3.2% of price; built in 1940 — expect roof / HVAC / electrical / plumbing capex.
- Climate carrying-cost: severe wind risk, 99% chance of damaging wind over 30y; extreme-heat days projected 7→24/yr by 2055 (HVAC capex compounding) — expect insurance premiums to compound above CPI over the hold.
Questions for the listing agent
- Built in 1940 — when were the roof, HVAC, electrical panel, plumbing, and water heater last replaced?
- Property tax is high relative to price — has the assessment been appealed recently, and will the sale trigger a re-assessment?
- Is there a deadline driving the sale (1031 exchange, divorce, estate, relocation)? That informs how much negotiation room exists.
- Schools are D-rated, which usually means shorter tenancies and higher turnover. Who's the typical renter profile here, and what's been the actual vacancy rate?
- Crime grade is F in this area — have there been break-ins, vandalism, or insurance claims at this property in the last 3 years? What carrier currently insures it and at what premium?
- What's the average days-on-market for RENTAL listings here right now (not sales)? A rising rental-DOM trend means longer vacancies and softer asking-rent achievability than the comps imply.
- What's the recent tenant-quality profile in this submarket — average credit score on applications, eviction rate, late-payment / NSF rate, and stable-employment percentage? A property-management company in the area should have these aggregated.
- How much new for-sale + rental construction is in the pipeline within 1–3 miles? Heavy new supply typically softens prices + rents 12–24 months out; constrained supply supports both.
Investment metrics
- 1% rule
- 1.37% ✓
- Cap rate
- 9.35%
- Cash-on-cash
- 10.92%
- DSCR
- 1.49
- GRM
- 6.1
CMA / ARV
- ARV (on-the-fly)
- $315,168
- Comps found
- 12
Show comp detail 12 sales within ~0.75 mi
| Address | Dist | Beds/Ba | Sqft | Sold | Price | $/sf | Match |
|---|---|---|---|---|---|---|---|
| 243 Rebecca St Unit E | 0.22mi | 3/2.5 (+1) | 1,536 (-2%) | 1mo | $289,990 | $189 | 75 |
| 241 Rebecca St Unit A | 0.22mi | 3/2.5 (+1) | 1,536 (-2%) | 3mo | $309,990 | $202 | 73 |
| 1017 Yorkshire St | 0.75mi | 2/2.0 | 1,561 (-0%) | 13mo | $295,000 | $189 | 50 |
| 702 Pennington St | 0.72mi | 3/2.0 (+1) | 1,616 (+3%) | 6mo | $289,000 | $179 | 48 |
| 249 De Boll Ave | 0.65mi | 3/3.5 (+1) | 1,616 (+3%) | 7mo | $319,000 | $197 | 44 |
| 727 Yorkshire St | 0.54mi | 3/2.0 (+1) | 1,680 (+7%) | 12mo | $289,000 | $172 | 44 |
| 320 Charlock St | 0.70mi | 3/2.5 (+1) | 1,605 (+2%) | 11mo | $329,900 | $206 | 44 |
| 269 De Boll Ave | 0.66mi | 3/3.5 (+1) | 1,616 (+3%) | 13mo | $325,000 | $201 | 38 |
| 271 De Boll Ave | 0.66mi | 3/3.5 (+1) | 1,616 (+3%) | 14mo | $335,000 | $207 | 38 |
| 813 Mcdaniel St | 0.51mi | 3/2.0 (+1) | 1,344 (-14%) | 8mo | $315,000 | $234 | 37 |
| 715 Hohl St | 0.71mi | 3/2.0 (+1) | 1,655 (+6%) | 15mo | $337,999 | $204 | 36 |
| 60 Farrell St | 0.72mi | 3/2.0 (+1) | 1,471 (-6%) | 13mo | $254,000 | $173 | 36 |
Match score weights: distance 35% · size 25% · config 20% · recency 20%. Top-matched comps best support the ARV.
Projected returns pro-forma
-3.0% appreciation · 4.47% rent growth · sell at horizon
- IRR
- 2.0%
- Equity multiple
- 1.08×
- Total profit
- $2,623
- Equity at exit
- $17,892
- IRR
- 13.2%
- Equity multiple
- 2.14×
- Total profit
- $38,326
- Equity at exit
- $10,375
Cash invested: $33,600 (down + closing). Projections, not guarantees.
Landlord ↔ Tenant lean methodology
- Overall (STATE)
- 87 Strongly Landlord-Friendly
- State Texas
- 87 Strongly Landlord-Friendly · R+5
- County
- — inherits STATE
- City
- — inherits STATE
ZIP-level market 77022
- Home prices YoY
- -33.2%
- Rents YoY
- 4.5%
- Active inventory
- 285
- Price-to-rent
- 6.1×
Monthly cashflow live
- Estimated rent
- $1,648 high interval (Pro) →
- Mortgage (P&I)
- −$629
- Tax from tax record
- −$317 /mo · $3,802/yr
- Insurance
- −$50
- HOA
- −$0
- Vacancy / Maint / Mgmt
- −$346
- Net cashflow
- $306
Break-even live
UW: 25.0% down · 7.5% · 30yr · 1.5% tax · 5.0% vac · 8.0% maint · 8.0% mgmt
Financing live
Cash to close
- Down payment
- $30,000
- Closing costs
- $3,600
- Reserves months
- —
- Total cash needed
- —
Loan-product check · same deal, 3 products live
Conventional
25% down · 7.5% · 30yr
- Down + closing
- —
- Monthly P&I
- —
- Monthly cashflow
- —
- DSCR
- —
- Eligible?
- —
Personal DTI + credit; lowest rate.
DSCR
20% down · 8.5% · 30yr
- Down + closing
- —
- Monthly P&I
- —
- Monthly cashflow
- —
- DSCR
- —
- Eligible?
- —
No personal income docs; deal must DSCR.
Hard money
10% down · 12.0% · 12mo
- Down + closing
- —
- Monthly P&I
- —
- Monthly cashflow
- —
- DSCR
- —
- Eligible?
- —
Short-term bridge; refi at stabilization.
Rent comps 15 comps
| Address | Beds | Baths | Sqft | Rent | $/sqft | DOM | Units | Dist |
|---|---|---|---|---|---|---|---|---|
| 139 Van Molan St Houston, TX | 1.0 | 1.0 | 1056 | $925 | $0.88 | 43d | 1 | 0.42mi |
| 534 Firnat St Houston, TX | 3.0 | 2.0 | 1397 | $1,900 | $1.36 | 43d | 1 | 0.54mi |
| 534 Firnat St Unit NA Houston, TX | 3.0 | 2.0 | 1397 | $1,900 | $1.36 | 24d | 1 | 0.54mi |
| 819 Tidwell Rd #819 Houston, TX | 2.0 | 1.5 | 1100 | $1,300 | $1.18 | 43d | 1 | 0.92mi |
| 6918 Irvington Blvd Houston, TX | 2.0 | 2.0 | 1100 | $1,550 | $1.41 | 43d | 1 | 0.93mi |
| 965 Tidwell Rd Houston, TX | 3.0 | 2.0 | 1145 | $1,309 | $1.14 | 20d | 1 | 0.93mi |
| 815 Cravens St Apt F2 Houston, TX | 2.0 | 1.5 | 1100 | $1,300 | $1.18 | 18d | 1 | 1.01mi |
| 815 Cravens St Apt C1 Houston, TX | 2.0 | 1.5 | 1100 | $1,300 | $1.18 | 4d | 1 | 1.01mi |
| 207 Lindale St Unit 1316403P Houston, TX | 2.0 | 1.0 | 1119 | $3,182 | $2.84 | 2d | 1 | 1.09mi |
| 4132 Europa St Houston, TX | 3.0 | 2.0 | 1259 | $1,430 | $1.14 | 12d | 1 | 1.20mi |
| 9910 Clark Rd Unit B Houston, TX | 3.0 | 2.5 | 1695 | $1,900 | $1.12 | 7d | 1 | 1.26mi |
| 209 Clark Meadows Ln Houston, TX | 3.0 | 2.5 | 1620 | $2,399 | $1.48 | 12d | 1 | 1.27mi |
| 1420 E 31st St Houston, TX | 3.0 | 2.5 | 1790 | $2,600 | $1.45 | 24d | 1 | 1.47mi |
| 1420 E 31st St Houston, TX | 3.0 | 2.5 | 1980 | $2,600 | $1.31 | 43d | 1 | 1.47mi |
| 2623 Huntington Creek Ln Houston, TX | 3.0 | 2.5 | 1553 | $2,299 | $1.48 | 24d | 1 | 1.48mi |
Listing history 16 events
-
2026-06-18days on market $120,000 Pending 25 DOM
-
2026-06-17days on market $120,000 Pending 24 DOM
-
2026-06-16days on market $120,000 Pending 23 DOM
-
2026-06-15days on market $120,000 Pending 22 DOM
-
2026-06-13statusdays on market $120,000 Pending 20 DOM
-
2026-06-09days on market $120,000 Active 16 DOM
-
2026-06-08days on market $120,000 Active 15 DOM
-
2026-06-07days on market $120,000 Active 14 DOM
-
2026-06-04days on market $120,000 Active 11 DOM
-
2026-06-03days on market $120,000 Active 10 DOM
-
2026-06-02days on market $120,000 Active 9 DOM
-
2026-06-01days on market $120,000 Active 8 DOM
-
2026-05-31days on market $120,000 Active 7 DOM
-
2026-05-24$120,000 Active
-
2023-10-06soldstatus
-
1988-05-01soldstatus
ⓘ Source: listings_history table (triggers on properties + properties_extension) + one-shot
backfill from property_details.listing_events for pre-trigger history.
Tax reassessment forecast TX · Resets to sale price
- Current annual tax
- $3,802 · $317/mo
- Projected year-2 tax
- $3,802 · $317/mo
- Expected delta
- $0/yr ($0/mo · 0.0%)
ⓘ Screening estimate from a state-policy table — verify with the county assessor before closing.
Climate risk First Street
- Flood 1/10 Low FEMA zone X (unshaded) · 0% chance over 30 yrs
- Wildfire 1/10 Low
- Heat 9/10 Extreme 7 d/yr ≥109°F today · 24 d/yr by 30 yrs out
- Wind 9/10 Extreme 99% chance of damaging wind over 30 yrs
- Air quality 3/10 Moderate 2 unhealthy d/yr today · 3 by 30 yrs out
Nearby sold comps map
Loading sold comps map…
Walkable amenities ~0.75 mi
Loading nearby amenities…
Taxation est. · year 1
- Rental income
- $19,773
- − Mortgage interest
- −$6,722
- − Property taxes
- −$3,802
- − Insurance
- −$600
- − Repairs & maintenance
- −$1,582
- − Management
- −$1,582
- − Depreciation
- −$3,491
- Taxable income
- $1,995
- Est. tax owed @ 24.0%
- −$479
- After-tax cash flow
- $3,189/yr
For passive investors: Depreciation is non-cash, so a rental often shows a tax loss while cash-flowing — sheltering income. Rental losses are passive: they offset passive income freely, and up to $25,000/yr can offset ordinary (W-2) income if you actively participate and your MAGI is under $100k (phasing out to $0 by $150k); unused losses carry forward. On sale, claimed depreciation is recaptured at up to 25%, and gains may owe capital-gains tax (a 1031 exchange can defer both). Figures are a year-1 estimate at your 24.0% rate — not tax advice; consult a CPA.
Schools (NCES district)
- District
- Houston ISD
- NCES district ID
- 4823640
- Math proficiency
- 27% ▼ -18.00%
- Reading proficiency
- 35% ▼ -6.00%
- Median HH income
- $46,054
- Composite
- 26.63/100
- National rank
- #7173
- State rank
- #593 of 826 in TX
Livability — Houston
- Score
- 74/100
- State rank
- #184
- US rank
- #4771
Category grades
Schools grade is shown separately in the Schools card above.
Census & demographics
- Census place
- Houston, TX
- County
- Harris County · 4,702,590 people
- City population
- 3,226,434
- Metro
- Houston-The Woodlands-Sugar Land, TX
- Population (ZIP)
- 25,805
- Household income
- $52,739
- Rent vs Own
- Severe rent burden
- 1354.0
Population outlook (Harris County) Hauer SSP2
- Today (2025)
- 5,571,493 people
- By 2030
- 6,089,821 · +9.3%
- By 2040
- 7,142,806 · +28.2%
- By 2050
- 8,185,864 · +46.9%
- By 2075
- 10,574,329 · +89.8%
- By 2100
- 12,109,958 · +117.4%
Race, ethnicity, and origin ACS 2023
- Neighborhood character
- Predominantly Hispanic (72%)
- Race & ethnicity
- Hispanic / Latino 72% Two or more races 24% Black 19% White 7% Native American 1%
- Hispanic origin (detail)
- Mexican 54%
- Common ancestry
- Romanian 1% Portuguese 1%
- Foreign-born
- 30% · Canada, Jamaica
- Languages at home
- 40% English-only · Spanish 59%
Political lean MEDSL · Harris
- 2024 margin
- Lean D (+5.5) · D 52.0% · R 46.4% · Other 1.6%
- 2008→2024 swing
- +3.9pp toward D · 2008: 1.6pp · 2024: 5.5pp
- All cycles
- 2024: D+5.5 2020: D+13.3 2016: D+12.4 2012: D+0.1 2008: D+1.6
Not yet ingested
- Civics
- —
Market trends
- HPI YoY
- ▼ -151.13%
- Current HPI
- 304.3745
- Rent YoY
- ▲ 4.47%
- Metro
- Houston-The Woodlands-Sugar Land, TX
- State GDP YoY
- ▲ 3.95%
- F500 in state
- 110
Industry mix (Fortune 500 HQ in TX)
| Industry | F500 HQs | Revenue |
|---|---|---|
| Energy | 16 | $1,198B |
|
||
| Technology | 5 | $198B |
|
||
| Engineering / Construction | 4 | $72B |
|
||
| Energy Services | 3 | $60B |
|
||
| Utilities | 3 | $41B |
|
||
| Healthcare | 2 | $330B |
|
||
Price history
3 events — show timeline
- 2026-05-24 Listed $120,000 HARMLS
- 2023-10-06 Sold (Public Records) — Public Records
- 1988-05-01 Sold (Public Records) — Public Records
Property tax history
+7.3%/yrLatest (2025): $3,802 · +7.0% YoY. Source: county tax records.
Cash-flow waterfall
monthlySold comps — $/sqft
last 12 mo · ≤1 miLoading sold comps…