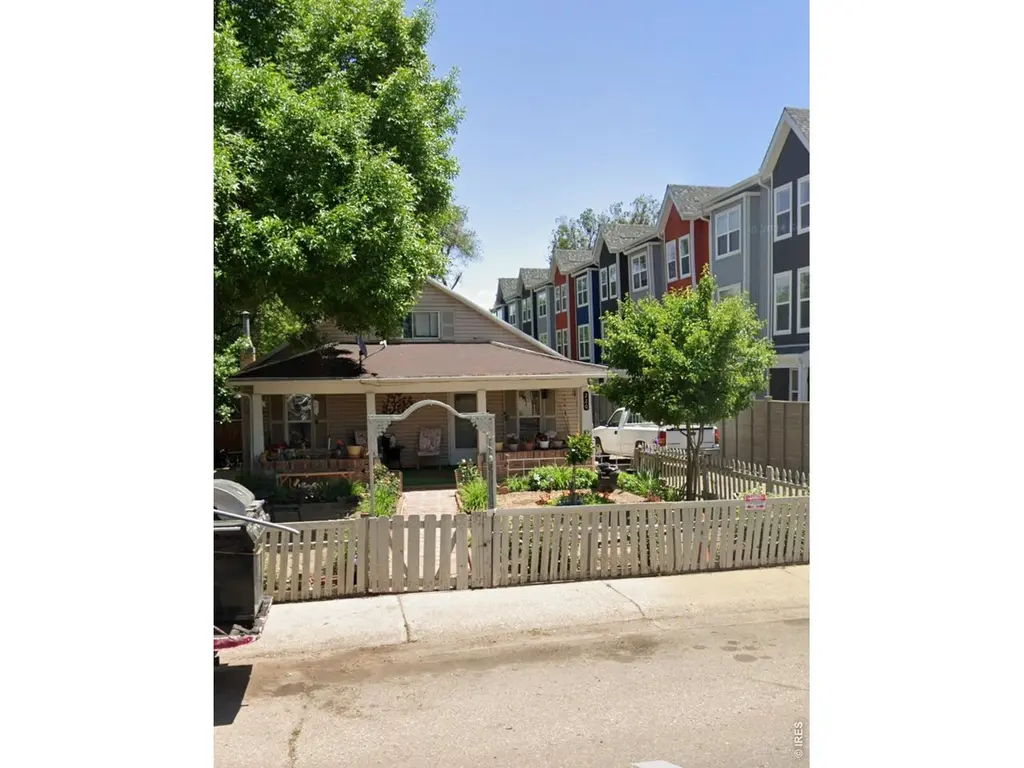
220 Emery St · Longmont, CO
Flood risk 1/10 · Minimal
- FEMA flood zone
- X (unshaded)
- Chance of flooding over 30 yrs
- 0.0%
- Est. flood insurance / yr
- $507 – $1,088
Fire risk 1/10 · Minimal
- Est. fire insurance / yr
- $939 – $1,743
Heat risk 3/10 · Minor
- Hot days now (above 93°F)
- 7 days/yr
- Hot days in 30 yrs
- 18 days/yr
Wind risk 1/10 · Minimal
- Chance of severe wind over 30 yrs
- —
Air-quality risk 4/10 · Minor
- Unhealthy air days now
- 5 days/yr
- Unhealthy air days in 30 yrs
- 5 days/yr
Risk factors via First Street. Map © Google.
Why this score? — see what drove the F grade
The composite is a weighted blend of 9 inputs, each scored 0–100. Each bar is that input's sub-score; the figure is the points it added to the 100-point composite (weight × sub-score).
- ARV discount +15.0/15.0
- Cash flow +4.7/30.0
- Livability +3.9/5.0
- Schools +3.8/10.0
- Rent growth +2.7/5.0
- Condition / age +2.5/5.0
- 1% rule +0.0/10.0
- DSCR +0.0/10.0
- Appreciation +0.0/10.0
$365,000
🖨 Deal sheet 📄 Offer letter ✓ Due diligence
Listing remarks MLS
CUTE 3 BDRM BUNGALOW ON HUGE LOT AT AN AFFORDABLE PRICE. LOTS OF POTENTIAL FOR THE HANDYMAN BUYER. A LITTLE PAINT & CARPET GO ALONG WAY WITH THIS HOME. NEAR HWY 119 FOR THAT EARLY MORNING COMMUTE. YOU WILL LOVE THE LOCATION NEAR ALL SHOPPING, DOWNTOWN, LIBRARY & HWY 287 TOO. BETTER HURRY.... THIS ONE WON'T LAST LONG. SOLD IN AS IS CONDITION. ALL OFFERS MUST BE ACCOMPANIED BY A WELLS FARGO PRE-QUAL. IF PROPERTY IS BEING FINANCED. NO FHA LOANS PLEASE.. ALL ADDENDA CAN BE FOUND IN THE EXTRAS TAB.
Key facts
- 9,583 sq ft lot
- 2 garage spots
- Built 1946
Property features AI
Exterior
- Parking: Off-street parking; 2-car garage
- Utilities: City water (meter installed); Natural gas available; City trash service (City of Longmont); No water rights
- Home design: One-level residence; Residential, mixed-use property; Zoned MU-D; Not new construction
- Construction: Frame construction; Composition roof
- Exterior features: Fenced yard; Water rights excluded
Interior
- Kitchen: Gas range; Refrigerator
- Bedrooms: 4 bedrooms
- Bathrooms: 1 full bathroom
- Heating & cooling: Forced air heating; Evaporative cooling
- Interior features: Gas range; Refrigerator
Neighborhood map
What this means for you Summary
Snapshot
- This is a 2-bed/1.0-bath single-family listed at $365k.
Deal economics
- At list price, monthly cash flow is $-907 ($-11k/yr) — negative.
- To cash-flow at today's rent, offer at most $205k (43.9% below list).
- To meet the 1% rule (rent ≥ 1% of price), the offer needs to be $179k (50.9% below list).
- Recommended offer: $179k (50.9% below list) — sets the bar for 1% rule.
- Cap rate 3.3% vs local median 2.6% in Longmont — meaningfully above typical; check what's discounted (condition, days-on-market, listing class) to confirm the premium yield is real.
Location & tenants
- Location reads 77/100 on livability (#24 in CO, #2,736 nationally) — a middle-class / working-renter tenant base. Strengths: amenities A+, employment A+, housing A+; Watch: crime F, cost of living F.
- St. Vrain Valley School District No. Re1J (suburban): math 32% / reading 51% proficiency, ranked #23 of 86 in CO (top 27%) — families likely to look elsewhere, expect single-tenant / working-renter base with shorter leases.
- Zoned schools: Columbine Elementary School (math 5% / reading 17%, grade F, #879 of 966 statewide, top 94%, 239 students, 83% FRL); Skyline High School (math 25% / reading 46%, grade F, #207 of 381 statewide, top 54%, 1,354 students, 62% FRL) — zoned schools average 72% FRL vs 27% district-wide (46 pts higher); higher-poverty schools than district average — tighter screening recommended.
- Zoned-school proficiency averages 23% at this address vs 42% district-wide (-18 pts) — the specific schools serving this property underperform the St. Vrain Valley School District No. Re1J average; the district grade overstates school quality for this exact location.
- Market conditions: Rents flat; 174 active listings in the ZIP; 27 comparable units currently listed for rent nearby; rentals at typical pace (median 21d on market — plan ~3-4 weeks tenant-placement turnaround); solid renter incomes; 1,688 units permitted in Boulder County in 2024 (1,136 in 5+ unit buildings).
Forward outlook
- Local home prices are declining (-3.0%/yr); year-one equity from $3k of loan paydown is wiped out by about $11k of value loss. Plan a longer hold.
- Boulder County population projected at +40% by 2050 — long-run rental-demand tailwind backs the buy-and-hold thesis.
Negotiation context
- It's been on market 20 days — a 2% lower offer ($360k) is reasonable based on typical stale-listing flexibility.
- 6 sale attempts since 28y ago with the ask held roughly flat each time — persistent listings suggest the price (not the market) is what's stuck; bring a comps-based counter.
- Current owner paid $73k; list at $365k implies a 400% gain — meaningful room to come down on a strong offer.
Risks & watch-outs
- Watch-outs: built in 1946 — expect roof / HVAC / electrical / plumbing capex.
Questions for the listing agent
- What do current leases actually rent for vs. the listed asking? Can we see a recent rent roll and the last 12 months of T-12 income?
- Built in 1946 — when were the roof, HVAC, electrical panel, plumbing, and water heater last replaced?
- Is there a deadline driving the sale (1031 exchange, divorce, estate, relocation)? That informs how much negotiation room exists.
- Crime grade is F in this area — have there been break-ins, vandalism, or insurance claims at this property in the last 3 years? What carrier currently insures it and at what premium?
- The area grade is low — what's the realistic commute time and amenity access for the typical tenant pool here? Any planned neighborhood developments (good or bad) we should know about?
- What's the average days-on-market for RENTAL listings here right now (not sales)? A rising rental-DOM trend means longer vacancies and softer asking-rent achievability than the comps imply.
- What's the recent tenant-quality profile in this submarket — average credit score on applications, eviction rate, late-payment / NSF rate, and stable-employment percentage? A property-management company in the area should have these aggregated.
- How much new for-sale + rental construction is in the pipeline within 1–3 miles? Heavy new supply typically softens prices + rents 12–24 months out; constrained supply supports both.
Investment metrics
- 1% rule
- 0.49% ✗
- Cap rate
- 3.31%
- Cash-on-cash
- -10.65%
- DSCR
- 0.53
- GRM
- 17.0
CMA / ARV
- ARV (on-the-fly)
- $438,000
- Comps found
- 12
Show comp detail 12 sales within ~0.75 mi
| Address | Dist | Beds/Ba | Sqft | Sold | Price | $/sf | Match |
|---|---|---|---|---|---|---|---|
| 536 Atwood St | 0.44mi | 2/1.0 | 864 (-1%) | 1mo | $466,000 | $539 | 76 |
| 619 Pratt St | 0.62mi | 2/1.0 | 869 (-1%) | 2mo | $512,000 | $589 | 68 |
| 235 Bowen St | 0.68mi | 2/1.0 | 884 (+1%) | 2mo | $702,500 | $795 | 65 |
| 7 6th Ave | 0.52mi | 2/1.0 | 936 (+7%) | 1mo | $445,000 | $475 | 63 |
| 531 Atwood St | 0.42mi | 2/1.0 | 800 (-9%) | 3mo | $400,000 | $500 | 63 |
| 140 E 5th Ave | 0.64mi | 2/1.0 | 840 (-4%) | 2mo | $269,600 | $321 | 61 |
| 106 Lincoln St | 0.69mi | 3/1.0 (+1) | 912 (+4%) | 3mo | $390,000 | $428 | 54 |
| 428 Baker St | 0.38mi | 2/1.0 | 752 (-14%) | 7mo | $380,000 | $505 | 53 |
| 29 Marshall Pl | 0.54mi | 2/1.0 | 760 (-13%) | 3mo | $355,000 | $467 | 51 |
| 16 E 5th Ave | 0.49mi | 2/1.0 | 768 (-12%) | 8mo | $429,600 | $559 | 50 |
| 136 E 5th Ave | 0.63mi | 2/1.0 | 780 (-11%) | 3mo | $385,000 | $494 | 50 |
| 2 Lincoln Pl | 0.72mi | 3/1.0 (+1) | 960 (+10%) | 12mo | $410,000 | $427 | 36 |
Match score weights: distance 35% · size 25% · config 20% · recency 20%. Top-matched comps best support the ARV.
Projected returns pro-forma
-3.0% appreciation · 0.64% rent growth · sell at horizon
- IRR
- -37.9%
- Equity multiple
- -0.19×
- Total profit
- $-121,189
- Equity at exit
- $54,423
- IRR
- -72.0%
- Equity multiple
- -0.92×
- Total profit
- $-196,595
- Equity at exit
- $31,559
Cash invested: $102,200 (down + closing). Projections, not guarantees.
Landlord ↔ Tenant lean methodology
- Overall (STATE)
- 38 Tenant-Leaning
- State Colorado
- 38 Tenant-Leaning · D+4
- County
- — inherits STATE
- City
- — inherits STATE
ZIP-level market 80501
- Rents YoY
- 0.6%
- Active inventory
- 174
- Price-to-rent
- 17.0×
Monthly cashflow live
- Estimated rent
- $1,790 high interval (Pro) →
- Mortgage (P&I)
- −$1,914
- Tax from tax record
- −$256 /mo · $3,067/yr
- Insurance
- −$152
- HOA
- −$0
- Vacancy / Maint / Mgmt
- −$376
- Net cashflow
- $-907
Break-even live
UW: 25.0% down · 7.5% · 30yr · 1.5% tax · 5.0% vac · 8.0% maint · 8.0% mgmt
Financing live
Cash to close
- Down payment
- $91,250
- Closing costs
- $10,950
- Reserves months
- —
- Total cash needed
- —
Loan-product check · same deal, 3 products live
Conventional
25% down · 7.5% · 30yr
- Down + closing
- —
- Monthly P&I
- —
- Monthly cashflow
- —
- DSCR
- —
- Eligible?
- —
Personal DTI + credit; lowest rate.
DSCR
20% down · 8.5% · 30yr
- Down + closing
- —
- Monthly P&I
- —
- Monthly cashflow
- —
- DSCR
- —
- Eligible?
- —
No personal income docs; deal must DSCR.
Hard money
10% down · 12.0% · 12mo
- Down + closing
- —
- Monthly P&I
- —
- Monthly cashflow
- —
- DSCR
- —
- Eligible?
- —
Short-term bridge; refi at stabilization.
Rent comps 27 comps
| Address | Beds | Baths | Sqft | Rent | $/sqft | DOM | Units | Dist |
|---|---|---|---|---|---|---|---|---|
| 485 2nd Ave Longmont, CO | 2.0 | 1.0–2.0 | 858 | $2,420 | $2.82 | 21d | 45 | 0.12mi |
| 513 Terry St Apt 1 Longmont, CO | 1.0 | 1.0 | 650 | $1,555 | $2.39 | 21d | 1 | 0.45mi |
| 100 E 2nd Ave Longmont, CO | 3.0 | 1.0–2.0 | 965 | $2,805 | $2.91 | 13d | 93 | 0.48mi |
| 815 6th Ave Unit 1 Longmont, CO | 2.0 | 2.0 | 1000 | $1,675 | $1.68 | 21d | 1 | 0.51mi |
| 702 Emery St Unit 14 Longmont, CO | 1.0 | 1.0 | 600 | $1,295 | $2.16 | 13d | 1 | 0.55mi |
| 706 Darby Ct Unit 3 Longmont, CO | 1.0 | 1.0 | 600 | $1,195 | $1.99 | 21d | 1 | 0.56mi |
| 221 Gay St Unit C Longmont, CO | 2.0 | 2.0 | 700 | $1,495 | $2.14 | 21d | 1 | 0.57mi |
| 713 Collyer St Unit B Longmont, CO | 1.0 | 1.0 | 800 | $1,515 | $1.89 | 21d | 1 | 0.57mi |
| 720 Fairlane Ave Longmont, CO | 2.0 | 1.0 | 828 | $1,775 | $2.14 | 21d | 3 | 0.58mi |
| 732 Delaware Ave Unit A Longmont, CO | 2.0 | 1.0 | 875 | $1,600 | $1.83 | 21d | 1 | 0.61mi |
| 808 Delaware Ave Unit D Longmont, CO | 2.0 | 1.0 | 700 | $1,300 | $1.86 | 21d | 1 | 0.63mi |
| 630 Lashley St Longmont, CO | 2.0 | 1.0–2.0 | 907 | $1,797 | $1.98 | 13d | 5 | 0.81mi |
| 228 E Longs Peak Ave Longmont, CO | 2.0 | 1.0 | 768 | $1,345 | $1.75 | 13d | 1 | 0.89mi |
| 136 E 8th Ave Longmont, CO | 2.0 | 1.0 | 860 | $1,145 | $1.33 | 21d | 1 | 0.90mi |
| 225 E 8th Ave Longmont, CO | 1.0–2.0 | 1.0 | 722 | $1,399 | $1.94 | 13d | 2 | 0.91mi |
| 946 Pratt St Unit B Longmont, CO | 2.0 | 1.0 | 791 | $1,800 | $2.28 | 21d | 1 | 0.95mi |
| 104 Judson St Longmont, CO | 2.0 | 1.0 | 810 | $1,650 | $2.04 | 21d | 1 | 0.96mi |
| 1530 9th Ave Longmont, CO | 1.0–2.0 | 1.0 | 870 | $1,600 | $1.84 | 13d | 4 | 1.27mi |
| 1328 S Coffman St Unit 1 Longmont, CO | 3.0 | 1.0 | 966 | $1,745 | $1.81 | 21d | 1 | 1.42mi |
| 1328 S Coffman St Longmont, CO | 3.0 | 1.0 | 966 | $1,795 | $1.86 | 13d | 2 | 1.42mi |
| 321 14th Pl Longmont, CO | 1.0–2.0 | 1.0 | 715 | $1,495 | $2.09 | 13d | 7 | 1.42mi |
| 1344 S Coffman St Longmont, CO | 2.0 | 1.0 | 750 | $1,295 | $1.73 | 13d | 1 | 1.43mi |
| 1419 Coffman St Unit 7 Longmont, CO | 2.0 | 1.0 | 800 | $1,447 | $1.81 | 21d | 1 | 1.44mi |
| 1353 S Coffman St Longmont, CO | 2.0 | 1.0 | 804 | $1,925 | $2.39 | 13d | 1 | 1.46mi |
| 1213 Francis St Unit 6 Longmont, CO | 1.0 | 1.0 | 650 | $1,395 | $2.15 | 21d | 1 | 1.47mi |
| 325 15th Ave Unit 2 Longmont, CO | 2.0 | 1.0 | 650 | $1,350 | $2.08 | 13d | 1 | 1.50mi |
| 325 15th Ave Unit 3 Longmont, CO | 1.0 | 1.0 | 550 | $1,350 | $2.45 | 13d | 1 | 1.50mi |
Listing history 20 events
-
2026-05-08$365,000 Active
-
2026-05-06historical $365,000
-
2022-12-19status Pending
-
2022-11-12historical
-
2022-11-12historical
-
2022-10-13status Active
-
2022-10-13price $395,000
-
2022-10-07historical Active - Backup
-
2022-09-07price $405,000
-
2022-08-12price $450,000
-
2022-06-21$475,000 Active
-
2009-09-10soldstatus $73,000 507-char remark
Show marketing remark (507 chars)
CUTE 3 BDRM BUNGALOW ON HUGE LOT AT AN AFFORDABLE PRICE. LOTS OF POTENTIAL FOR THE HANDYMAN BUYER. A LITTLE PAINT & CARPET GO ALONG WAY WITH THIS HOME. NEAR HWY 119 FOR THAT EARLY MORNING COMMUTE. YOU WILL LOVE THE LOCATION NEAR ALL SHOPPING, DOWNTOWN, LIBRARY & HWY 287 TOO. BETTER HURRY.... THIS ONE WON'T LAST LONG. SOLD IN AS IS CONDITION. ALL OFFERS MUST BE ACCOMPANIED BY A WELLS FARGO PRE-QUAL. IF PROPERTY IS BEING FINANCED. NO FHA LOANS PLEASE.. ALL ADDENDA CAN BE FOUND IN THE EXTRAS TAB.
-
2009-08-17$59,000 507-char remark
Show marketing remark (507 chars)
CUTE 3 BDRM BUNGALOW ON HUGE LOT AT AN AFFORDABLE PRICE. LOTS OF POTENTIAL FOR THE HANDYMAN BUYER. A LITTLE PAINT & CARPET GO ALONG WAY WITH THIS HOME. NEAR HWY 119 FOR THAT EARLY MORNING COMMUTE. YOU WILL LOVE THE LOCATION NEAR ALL SHOPPING, DOWNTOWN, LIBRARY & HWY 287 TOO. BETTER HURRY.... THIS ONE WON'T LAST LONG. SOLD IN AS IS CONDITION. ALL OFFERS MUST BE ACCOMPANIED BY A WELLS FARGO PRE-QUAL. IF PROPERTY IS BEING FINANCED. NO FHA LOANS PLEASE.. ALL ADDENDA CAN BE FOUND IN THE EXTRAS TAB.
-
2009-01-06historical
-
2008-08-26$59,900
-
2005-03-23soldstatus $141,000
-
1998-08-13soldstatus $95,000
-
1998-08-10soldstatus $95,000
-
1998-06-12$95,000
-
1993-10-21soldstatus $54,000
ⓘ Source: listings_history table (triggers on properties + properties_extension) + one-shot
backfill from property_details.listing_events for pre-trigger history.
Tax reassessment forecast CO · Resets to sale price
- Current annual tax
- $3,067 · $256/mo
- Projected year-2 tax
- $3,067 · $256/mo
- Expected delta
- $0/yr ($0/mo · -0.0%)
ⓘ Screening estimate from a state-policy table — verify with the county assessor before closing.
Climate risk First Street
- Flood 1/10 Low FEMA zone X (unshaded) · 0% chance over 30 yrs
- Wildfire 1/10 Low
- Heat 3/10 Moderate 7 d/yr ≥93°F today · 18 d/yr by 30 yrs out
- Wind 1/10 Low
- Air quality 4/10 Moderate 5 unhealthy d/yr today · 5 by 30 yrs out
Nearby sold comps map
Loading sold comps map…
Walkable amenities ~0.75 mi
Loading nearby amenities…
Taxation est. · year 1
- Rental income
- $21,484
- − Mortgage interest
- −$20,446
- − Property taxes
- −$3,067
- − Insurance
- −$1,825
- − Repairs & maintenance
- −$1,719
- − Management
- −$1,719
- − Depreciation
- −$10,618
- Taxable loss
- −$17,909
- Est. tax savings @ 24.0%
- +$4,298
- After-tax cash flow
- $-6,591/yr
For passive investors: Depreciation is non-cash, so a rental often shows a tax loss while cash-flowing — sheltering income. Rental losses are passive: they offset passive income freely, and up to $25,000/yr can offset ordinary (W-2) income if you actively participate and your MAGI is under $100k (phasing out to $0 by $150k); unused losses carry forward. On sale, claimed depreciation is recaptured at up to 25%, and gains may owe capital-gains tax (a 1031 exchange can defer both). Figures are a year-1 estimate at your 24.0% rate — not tax advice; consult a CPA.
Schools (NCES district)
- District
- St. Vrain Valley School District No. Re1J
- NCES district ID
- 0805370
- Math proficiency
- 32% ▼ -8.00%
- Reading proficiency
- 51% ▬ 0.00%
- Median HH income
- $71,571
- Composite
- 37.73/100
- National rank
- #4353
- State rank
- #23 of 86 in CO
Livability — Longmont
- Score
- 77/100
- State rank
- #24
- US rank
- #2736
Category grades
Schools grade is shown separately in the Schools card above.
Census & demographics
- Census place
- Longmont, CO
- County
- Boulder County · 271,666 people
- City population
- 143,444
- Metro
- Boulder, CO
- Population (ZIP)
- 44,147
- Household income
- $80,911
- Rent vs Own
- Severe rent burden
- 1958.0
Population outlook (Boulder County) Hauer SSP2
- Today (2025)
- 380,833 people
- By 2030
- 412,028 · +8.2%
- By 2040
- 472,764 · +24.1%
- By 2050
- 532,029 · +39.7%
- By 2075
- 679,723 · +78.5%
- By 2100
- 766,278 · +101.2%
Race, ethnicity, and origin ACS 2023
- Neighborhood character
- Majority White (62%)
- Race & ethnicity
- White 62% Hispanic / Latino 31% Two or more races 16% Asian 1% Black 1%
- Hispanic origin (detail)
- Mexican 25%
- Common ancestry
- Romanian 3% Lithuanian 2% Slovak 2%
- Foreign-born
- 12% · Canada, Jamaica
- Languages at home
- 77% English-only · Spanish 19% Other Indo-European 1% Russian/Polish/Slavic 1%
Political lean MEDSL · Boulder
- 2024 margin
- Solid D (+55.8) · D 76.5% · R 20.8% · Other 2.7%
- 2008→2024 swing
- +9.6pp toward D · 2008: 46.1pp · 2024: 55.8pp
- All cycles
- 2024: D+55.8 2020: D+56.6 2016: D+48.6 2012: D+41.5 2008: D+46.1
Not yet ingested
- Civics
- —
Market trends
- HPI YoY
- ▼ -567.24%
- Current HPI
- 268.454
- Rent YoY
- ▲ 0.64%
- Metro
- Boulder, CO
- State GDP YoY
- ▲ 1.95%
- F500 in state
- 14
Industry mix (Fortune 500 HQ in CO)
| Industry | F500 HQs | Revenue |
|---|---|---|
| Technology Distribution | 1 | $31B |
|
||
| Food / Agriculture | 1 | $18B |
|
||
| Packaging | 1 | $14B |
|
||
| Healthcare | 1 | $13B |
|
||
| Energy | 1 | $10B |
|
||
| Technology | 1 | $4B |
|
||
Price history
+575.9% since first listed20 events — show timeline
- 2026-05-08 Listed $365,000 IRES
- 2026-05-06 Coming Soon $365,000 IRES
- 2022-12-19 Pending — IRES
- 2022-11-12 Listing Removed — IRES
- 2022-11-12 Listing Removed — IRES
- 2022-10-13 Relisted — IRES
- 2022-10-13 Price Changed $395,000 IRES
- 2022-10-07 Contingent — IRES
- 2022-09-07 Price Changed $405,000 IRES
- 2022-08-12 Price Changed $450,000 IRES
- 2022-06-21 Listed $475,000 IRES
- 2009-09-10 Sold (MLS) $73,000 IRES
- 2009-08-17 Listed $59,000 IRES
- 2009-01-06 Listing Removed — IRES
- 2008-08-26 Listed $59,900 IRES
- 2005-03-23 Sold (Public Records) $141,000 Public Records
- 1998-08-13 Sold (MLS) $95,000 IRES
- 1998-08-10 Sold (Public Records) $95,000 Public Records
- 1998-06-12 Listed $95,000 IRES
- 1993-10-21 Sold (Public Records) $54,000 Public Records
Property tax history
+5.6%/yrLatest (2025): $3,067 · +30.8% YoY. Source: county tax records.
Cash-flow waterfall
monthlySold comps — $/sqft
last 12 mo · ≤1 miLoading sold comps…