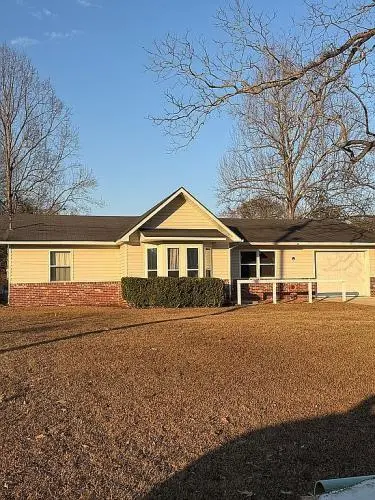
111 Woodbridge Rd · Enterprise, AL
Flood risk 1/10 · Minimal
- FEMA flood zone
- X (unshaded)
- Chance of flooding over 30 yrs
- 0.0%
- Est. flood insurance / yr
- $507 – $1,088
Fire risk 4/10 · Minor
- Est. fire insurance / yr
- $916 – $1,700
Heat risk 8/10 · Major
- Hot days now (above 106°F)
- 7 days/yr
- Hot days in 30 yrs
- 20 days/yr
Wind risk 8/10 · Major
- Chance of severe wind over 30 yrs
- 99.0%
Air-quality risk 1/10 · Minimal
- Unhealthy air days now
- 0 days/yr
- Unhealthy air days in 30 yrs
- 0 days/yr
Risk factors via First Street. Map © Google.
Why this score? — see what drove the B- grade
The composite is a weighted blend of 9 inputs, each scored 0–100. Each bar is that input's sub-score; the figure is the points it added to the 100-point composite (weight × sub-score).
- Cash flow +24.9/30.0
- ARV discount +15.0/15.0
- DSCR +8.1/10.0
- 1% rule +5.3/10.0
- Schools +4.3/10.0
- Rent growth +3.5/5.0
- Livability +3.2/5.0
- Condition / age +2.5/5.0
- Appreciation +0.0/10.0
$159,900
🖨 Deal sheet 📄 Offer letter ✓ Due diligence
Listing remarks MLS
Welcome home to this charming 3-bedroom, 2-bath rancher nestled in a quiet, established neighborhood in Enterprise. This well-maintained single-level home offers comfortable living with a functional layout perfect for families, first-time buyers, or anyone looking to enjoy easy, low-maintenance living. Step inside to a bright and inviting living area filled with natural light, creating the perfect space to relax or entertain guests. The spacious kitchen provides ample cabinet and counter space, making meal prep and gatherings effortless. The primary bedroom features its own private bath, and walk-in closet, while two additional bedrooms offer flexibility for guests, a home office, or hobbies. This move-in ready rancher combines comfort, practicality, and location—making it a wonderful place to call home.
Key facts
- Built 1985
- Listed 105 days
Neighborhood map
What this means for you Summary
Snapshot
- This is a 3-bed/1.0-bath single-family listed at $160k.
Deal economics
- At list price, monthly cash flow is $345 ($4k/yr) — positive.
- The deal already cash-flows at list — no discount required.
- Meets the 1% rule at list price ($2k rent vs $160k).
- Recommended offer: $146k (9.0% below list) — sets the bar for market timing.
- Cap rate 8.9% vs local median 4.2% in Enterprise — top-decile yield for the area; either an underpriced asset or a hidden risk that comps aren't pricing in. Stress-test before assuming the spread holds.
Location & tenants
- Location reads 65/100 on livability (#127 in AL) — a middle-class / working-renter tenant base. Strengths: cost of living A+, housing A+; Watch: health & safety D, crime F, amenities F.
- Enterprise City (town): math 40% / reading 60% proficiency, ranked #12 of 129 in AL (top 9%) — acceptable for families but not a draw, mixed tenant base, ~2y average lease.
- Market conditions: Rents rising (+3.9%/yr); 441 active listings in the ZIP; 2 comparable units currently listed for rent nearby; solid renter incomes; 137 units permitted in Coffee County in 2024 (0 in 5+ unit buildings).
Forward outlook
- Local home prices are declining (-3.0%/yr); year-one equity from $1k of loan paydown is wiped out by about $5k of value loss. Plan a longer hold.
Negotiation context
- It's been on market 105 days — a 9% lower offer ($146k) is reasonable based on typical stale-listing flexibility.
- 4 sale attempts since 15y ago with the ask held roughly flat each time — persistent listings suggest the price (not the market) is what's stuck; bring a comps-based counter.
Risks & watch-outs
- Climate carrying-cost: severe wind risk, 99% chance of damaging wind over 30y; extreme-heat days projected 7→20/yr by 2055 (HVAC capex compounding) — expect insurance premiums to compound above CPI over the hold.
Questions for the listing agent
- It's been on market 105 days. Have you received any prior offers? Is the seller open to a 9% concession, seller financing, or rate buy-down credit?
- Why hasn't it sold? Are there any deal-killer items the seller is aware of (foundation, flood, title, zoning, code violations)?
- Is there a deadline driving the sale (1031 exchange, divorce, estate, relocation)? That informs how much negotiation room exists.
- Crime grade is F in this area — have there been break-ins, vandalism, or insurance claims at this property in the last 3 years? What carrier currently insures it and at what premium?
- What's the average days-on-market for RENTAL listings here right now (not sales)? A rising rental-DOM trend means longer vacancies and softer asking-rent achievability than the comps imply.
- What's the recent tenant-quality profile in this submarket — average credit score on applications, eviction rate, late-payment / NSF rate, and stable-employment percentage? A property-management company in the area should have these aggregated.
- How much new for-sale + rental construction is in the pipeline within 1–3 miles? Heavy new supply typically softens prices + rents 12–24 months out; constrained supply supports both.
Investment metrics
- 1% rule
- 1.03% ✓
- Cap rate
- 8.88%
- Cash-on-cash
- 9.24%
- DSCR
- 1.41
- GRM
- 8.1
CMA / ARV
- ARV (median comp)
- $205,594
- List price
- $159,900
- Delta
- -22.23%
- Verdict
- UNDERPRICED
- Comps
- 20 within 1.0 mi
Show comp detail 11 sales within ~0.75 mi
| Address | Dist | Beds/Ba | Sqft | Sold | Price | $/sf | Match |
|---|---|---|---|---|---|---|---|
| 105 Winterberry Way | 0.22mi | 2/2.0 (-1) | 1,261 (+0%) | 11mo | $178,000 | $141 | 71 |
| 205 Fairfield Dr | 0.12mi | 3/2.0 | 1,317 (+4%) | 16mo | $185,000 | $140 | 70 |
| 134 Jasmine Cir | 0.14mi | 2/2.0 (-1) | 1,261 (+0%) | 22mo | $177,000 | $140 | 66 |
| 229 Jasmine Cir | 0.23mi | 3/2.0 | 1,419 (+13%) | 5mo | $230,000 | $162 | 60 |
| 106 Cambridge Rd | 0.05mi | 3/2.0 | 1,140 (-10%) | 24mo | $120,000 | $105 | 58 |
| 236 Jasmine Cir | 0.22mi | 3/2.0 | 1,435 (+14%) | 6mo | $250,000 | $174 | 57 |
| 220 Jasmine Cir | 0.19mi | 3/2.0 | 1,429 (+13%) | 12mo | $250,000 | $175 | 55 |
| 120 Mapleleaf Ct | 0.35mi | 3/2.0 | 1,435 (+14%) | 3mo | $256,000 | $178 | 54 |
| 106 Westfield Rd | 0.17mi | 3/2.0 | 1,416 (+12%) | 20mo | $200,000 | $141 | 50 |
| 212 Winterberry Way | 0.23mi | 3/2.0 | 1,445 (+15%) | 18mo | $247,000 | $171 | 46 |
| 108 Longleaf Ln | 0.30mi | 3/2.0 | 1,436 (+14%) | 18mo | $258,000 | $180 | 44 |
Match score weights: distance 35% · size 25% · config 20% · recency 20%. Top-matched comps best support the ARV.
Projected returns pro-forma
-3.0% appreciation · 3.92% rent growth · sell at horizon
- IRR
- -1.4%
- Equity multiple
- 0.94×
- Total profit
- $-2,477
- Equity at exit
- $23,842
- IRR
- 9.1%
- Equity multiple
- 1.72×
- Total profit
- $32,272
- Equity at exit
- $13,825
Cash invested: $44,772 (down + closing). Projections, not guarantees.
Landlord ↔ Tenant lean methodology
- Overall (STATE)
- 90 Strongly Landlord-Friendly
- State Alabama
- 90 Strongly Landlord-Friendly · R+15
- County
- — inherits STATE
- City
- — inherits STATE
ZIP-level market 36330
- Home prices YoY
- -19.4%
- Rents YoY
- 3.9%
- Active inventory
- 441
- Price-to-rent
- 8.1×
Monthly cashflow live
- Estimated rent
- $1,644 medium interval (Pro) →
- Mortgage (P&I)
- −$839
- Tax from tax record
- −$49 /mo · $582/yr
- Insurance
- −$67
- HOA
- −$0
- Vacancy / Maint / Mgmt
- −$345
- Net cashflow
- $345
Break-even live
UW: 25.0% down · 7.5% · 30yr · 1.5% tax · 5.0% vac · 8.0% maint · 8.0% mgmt
Financing live
Cash to close
- Down payment
- $39,975
- Closing costs
- $4,797
- Reserves months
- —
- Total cash needed
- —
Loan-product check · same deal, 3 products live
Conventional
25% down · 7.5% · 30yr
- Down + closing
- —
- Monthly P&I
- —
- Monthly cashflow
- —
- DSCR
- —
- Eligible?
- —
Personal DTI + credit; lowest rate.
DSCR
20% down · 8.5% · 30yr
- Down + closing
- —
- Monthly P&I
- —
- Monthly cashflow
- —
- DSCR
- —
- Eligible?
- —
No personal income docs; deal must DSCR.
Hard money
10% down · 12.0% · 12mo
- Down + closing
- —
- Monthly P&I
- —
- Monthly cashflow
- —
- DSCR
- —
- Eligible?
- —
Short-term bridge; refi at stabilization.
Rent comps 2 comps
| Address | Beds | Baths | Sqft | Rent | $/sqft | DOM | Units | Dist |
|---|---|---|---|---|---|---|---|---|
| 252 Jasmine Cir Enterprise, AL | 3.0 | 2.5 | 1572 | $1,550 | $0.99 | 43d | 1 | 0.25mi |
| 618 N Rawls St Enterprise, AL | 3.0 | 1.0 | 1140 | $975 | $0.86 | 43d | 1 | 1.26mi |
Listing history 23 events
-
2026-06-19days on market $159,900 Active 105 DOM
-
2026-06-18days on market $159,900 Active 104 DOM
-
2026-06-17days on market $159,900 Active 103 DOM
-
2026-06-16days on market $159,900 Active 102 DOM
-
2026-06-15days on market $159,900 Active 101 DOM
-
2026-06-14days on market $159,900 Active 99 DOM
-
2026-06-12days on market $159,900 Active 98 DOM
-
2026-06-09days on market $159,900 Active 95 DOM
-
2026-06-08days on market $159,900 Active 94 DOM
-
2026-06-07days on market $159,900 Active 93 DOM
-
2026-06-05days on market $159,900 Active 90 DOM
-
2026-06-03days on market $159,900 Active 89 DOM
-
2026-06-02days on market $159,900 Active 88 DOM
-
2026-06-01days on market $159,900 Active 87 DOM
-
2026-05-31days on market $159,900 Active 86 DOM
-
2026-05-30days on market $159,900 Active 85 DOM
-
2026-05-05soldstatus $150,000
-
2026-03-02$159,900 Active 821-char remark
Show marketing remark (821 chars)
Welcome home to this charming 3-bedroom, 2-bath rancher nestled in a quiet, established neighborhood in Enterprise. This well-maintained single-level home offers comfortable living with a functional layout perfect for families, first-time buyers, or anyone looking to enjoy easy, low-maintenance living. Step inside to a bright and inviting living area filled with natural light, creating the perfect space to relax or entertain guests. The spacious kitchen provides ample cabinet and counter space, making meal prep and gatherings effortless. The primary bedroom features its own private bath, and walk-in closet, while two additional bedrooms offer flexibility for guests, a home office, or hobbies. This move-in ready rancher combines comfort, practicality, and location—making it a wonderful place to call home.
-
2012-03-22soldstatus $98,000
-
2012-03-19soldstatus $98,000 303-char remark
Show marketing remark (303 chars)
Chain Link, CUTE HOUSE, NEW ROOF 2010, NEW WINDOWS, SPLIT BEDROOM PLAN, VERY OPEN WITH VAULTED CEILING IN LIVING ROOM AND DINING, GALLEY STYLE KITCHEN, LARGE LAUNDRY ROOM, FENCED BACK YARD, EXTRA BRICK PATIO IN BACKYARD. .. .. .. .. A MUST SEE. .. .. .. .. .CUL-DE-SAC. .. .. .. .. .GREAT SCHOOLS TOO. ,
-
2011-12-08$103,224 303-char remark
Show marketing remark (303 chars)
Chain Link, CUTE HOUSE, NEW ROOF 2010, NEW WINDOWS, SPLIT BEDROOM PLAN, VERY OPEN WITH VAULTED CEILING IN LIVING ROOM AND DINING, GALLEY STYLE KITCHEN, LARGE LAUNDRY ROOM, FENCED BACK YARD, EXTRA BRICK PATIO IN BACKYARD. .. .. .. .. A MUST SEE. .. .. .. .. .CUL-DE-SAC. .. .. .. .. .GREAT SCHOOLS TOO. ,
-
2011-03-28$104,000
-
2011-03-28$104,000
ⓘ Source: listings_history table (triggers on properties + properties_extension) + one-shot
backfill from property_details.listing_events for pre-trigger history.
Tax reassessment forecast AL · Resets to sale price
- Current annual tax
- $582 · $49/mo
- Projected year-2 tax
- $656 · $55/mo
- Expected delta
- +$73/yr (+$6/mo · 12.6%)
ⓘ Screening estimate from a state-policy table — verify with the county assessor before closing.
Climate risk First Street
- Flood 1/10 Low FEMA zone X (unshaded) · 0% chance over 30 yrs
- Wildfire 4/10 Moderate
- Heat 8/10 Severe 7 d/yr ≥106°F today · 20 d/yr by 30 yrs out
- Wind 8/10 Severe 99% chance of damaging wind over 30 yrs
- Air quality 1/10 Low 0 unhealthy d/yr today · 0 by 30 yrs out
Nearby sold comps map
Loading sold comps map…
Walkable amenities ~0.75 mi
Loading nearby amenities…
Taxation est. · year 1
- Rental income
- $19,725
- − Mortgage interest
- −$8,957
- − Property taxes
- −$582
- − Insurance
- −$800
- − Repairs & maintenance
- −$1,578
- − Management
- −$1,578
- − Depreciation
- −$4,652
- Taxable income
- $1,579
- Est. tax owed @ 24.0%
- −$379
- After-tax cash flow
- $3,760/yr
For passive investors: Depreciation is non-cash, so a rental often shows a tax loss while cash-flowing — sheltering income. Rental losses are passive: they offset passive income freely, and up to $25,000/yr can offset ordinary (W-2) income if you actively participate and your MAGI is under $100k (phasing out to $0 by $150k); unused losses carry forward. On sale, claimed depreciation is recaptured at up to 25%, and gains may owe capital-gains tax (a 1031 exchange can defer both). Figures are a year-1 estimate at your 24.0% rate — not tax advice; consult a CPA.
Schools (NCES district)
- District
- Enterprise City
- NCES district ID
- 0101320
- Math proficiency
- 40% ▼ -20.00%
- Reading proficiency
- 60% ▲ 4.00%
- Median HH income
- $51,311
- Composite
- 42.83/100
- National rank
- #3136
- State rank
- #12 of 129 in AL
Livability — Enterprise
- Score
- 65/100
- State rank
- #127
- US rank
- #12953
Category grades
Schools grade is shown separately in the Schools card above.
Census & demographics
- Census place
- Enterprise, AL
- County
- Coffee County · 39,557 people
- City population
- 39,557
- Metro
- Enterprise, AL
- Population (ZIP)
- 39,557
- Household income
- $75,765
- Rent vs Own
- Severe rent burden
- 1126.0
Population outlook (Coffee County) Hauer SSP2
- Today (2025)
- 53,133 people
- By 2030
- 53,832 · +1.3%
- By 2040
- 54,504 · +2.6%
- By 2050
- 54,289 · +2.2%
- By 2075
- 51,175 · -3.7%
- By 2100
- 46,793 · -11.9%
Race, ethnicity, and origin ACS 2023
- Neighborhood character
- Diverse neighborhood (Simpson 0.56)
- Race & ethnicity
- White 63% Black 17% Hispanic / Latino 13% Two or more races 9% Asian 1%
- Hispanic origin (detail)
- Mexican 6% Puerto Rican 3%
- Common ancestry
- Italian 3% Lithuanian 2% Serbian 2%
- Foreign-born
- 6% · Canada, Vietnam, South Korea
- Languages at home
- 89% English-only · Spanish 8% German/W. Germanic 2%
Political lean MEDSL · Coffee
- 2024 margin
- Solid R (+57.9) · D 20.7% · R 78.6%
- 2008→2024 swing
- -9.0pp toward R · 2008: -48.9pp · 2024: -57.9pp
- All cycles
- 2024: R+57.9 2020: R+53.1 2016: R+56.7 2012: R+49.4 2008: R+48.9
Not yet ingested
- Civics
- —
Market trends
- HPI YoY
- ▼ -44.44%
- Current HPI
- 184.0163
- Rent YoY
- ▲ 3.92%
- Metro
- Enterprise, AL
- State GDP YoY
- ▲ 2.94%
- F500 in state
- 4
Industry mix (Fortune 500 HQ in AL)
| Industry | F500 HQs | Revenue |
|---|---|---|
| Financial Services | 1 | $8B |
|
||
| Healthcare | 1 | $5B |
|
||
Price history
+44.2% since first listed7 events — show timeline
- 2026-05-05 Sold (Public Records) $150,000 Public Records
- 2026-03-02 Listed $159,900 Fizber.com
- 2012-03-22 Sold (Public Records) $98,000 Public Records
- 2012-03-19 Sold (MLS) $98,000 MAAR
- 2011-12-08 Listed $103,224 MAAR
- 2011-03-28 Listed $104,000 WBR
- 2011-03-28 Listed $104,000 MAAR
Property tax history
+2.6%/yrLatest (2025): $582 · +2.8% YoY. Source: county tax records.
Cash-flow waterfall
monthlySold comps — $/sqft
last 12 mo · ≤1 miLoading sold comps…