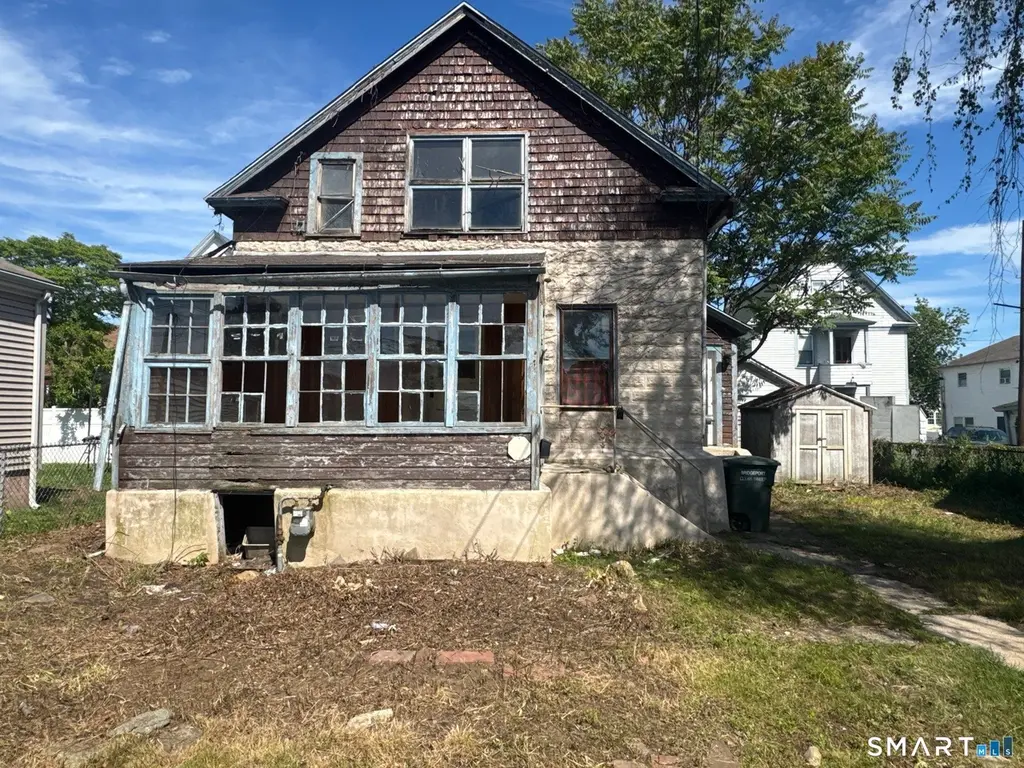
148 N Bishop Ave · Bridgeport, CT
Flood risk 1/10 · Minimal
- FEMA flood zone
- X (unshaded)
- Chance of flooding over 30 yrs
- 0.0%
- Est. flood insurance / yr
- $473 – $860
Fire risk 1/10 · Minimal
- Est. fire insurance / yr
- $829 – $1,539
Heat risk 6/10 · Moderate
- Hot days now (above 97°F)
- 7 days/yr
- Hot days in 30 yrs
- 15 days/yr
Wind risk 6/10 · Moderate
- Chance of severe wind over 30 yrs
- 54.0%
Air-quality risk 4/10 · Minor
- Unhealthy air days now
- 5 days/yr
- Unhealthy air days in 30 yrs
- 7 days/yr
Risk factors via First Street. Map © Google.
Why this score? — see what drove the C+ grade
The composite is a weighted blend of 9 inputs, each scored 0–100. Each bar is that input's sub-score; the figure is the points it added to the 100-point composite (weight × sub-score).
- Cash flow +21.8/30.0
- ARV discount +15.0/15.0
- DSCR +7.0/10.0
- 1% rule +6.3/10.0
- Livability +4.0/5.0
- Rent growth +2.5/5.0
- Condition / age +2.5/5.0
- Schools +1.2/10.0
- Appreciation +0.0/10.0
$199,900
🖨 Deal sheet 📄 Offer letter ✓ Due diligence
Listing remarks
Opportunity knocks in Bridgeport's desirable East End! Conveniently located near the area hospitals, I-95, and Route 8, this colonial offers incredible accessibility for commuters while sitting on a quieter street with room to create your vision. Whether you're an investor searching for your next project to build sweat equity, this property is an equity improvement gold mine ready for its next chapter. Step onto the property and imagine the possibilities. The cleared lot and spacious front yard create a welcoming setting perfect for outdoor play, relaxing afternoons, or future landscaping ideas that truly make the home your own. Inside, the convenient first-floor layout keeps everyday livin
Key facts
- Spacious front yard
- Cleared lot
- First floor laundry
Tags
Property features AI
Finance
- Other: Property listed for sale
Exterior
- Utilities: Public water connected; Public sewer connected
- Home design: Single-family home
- Construction: Frame construction; Stone foundation; Asphalt shingle roof; Light blue exterior
- Exterior features: Level lot; Stone and stucco siding
Interior
- Kitchen: Oven/Range; Refrigerator
- Bedrooms: 3 bedrooms
- Bathrooms: 1 full bathroom
- Heating & cooling: Hot air heating; Natural gas heat; 40-gallon natural gas hot water tank
- Interior features: Full unfinished basement; 5 total rooms
Neighborhood map
What this means for you Summary
Snapshot
- This is a 3-bed/1.0-bath single-family listed at $200k.
Deal economics
- At list price, monthly cash flow is $312 ($4k/yr) — positive.
- The deal already cash-flows at list — no discount required.
- Meets the 1% rule at list price ($2k rent vs $200k).
- Cap rate 8.2% vs local median 5.0% in Bridgeport — top-decile yield for the area; either an underpriced asset or a hidden risk that comps aren't pricing in. Stress-test before assuming the spread holds.
Location & tenants
- Location reads 81/100 on livability (#15 in CT, #1,374 nationally) — a professional / high-income tenant draw. Strengths: amenities A+, commute A+, health & safety A+; Watch: crime C-, employment D+.
- Bridgeport School District (urban): math 9% / reading 19% proficiency, ranked #151 of 153 in CT (top 99%) — low school quality limits family demand, transient renter base, plan for 1-2y turnover; 97% free/reduced lunch — lower-income household profile, screen leases tightly.
- Zoned schools: Hall School (math 8% / reading 12%, grade F, #512 of 553 statewide, top 94%, 183 students, 93% FRL); Warren Harding High School (math 2% / reading 8%, grade F, #192 of 194 statewide, top 100%, 1,109 students, 82% FRL).
- Market conditions: 68 active listings in the ZIP; 40 comparable units currently listed for rent nearby; rentals at typical pace (median 21d on market — plan ~3-4 weeks tenant-placement turnaround); 852 units permitted in Greater Bridgeport Planning Region in 2024 (698 in 5+ unit buildings).
- At $2,257/mo this rent would consume 52% of the median local household income ($52k/yr) (locally 1368% of renters already pay >50% of income on rent) — very limited rent-growth headroom before tenants either downsize or default.
Forward outlook
- Local home prices are declining (-3.0%/yr); year-one equity from $1k of loan paydown is wiped out by about $6k of value loss. Plan a longer hold.
Negotiation context
- Only 7 days on market — expect competitive offers; lowballing is unlikely to land.
Risks & watch-outs
- Watch-outs: built in 1918 — expect roof / HVAC / electrical / plumbing capex.
- Climate carrying-cost: major wind risk, 54% chance of damaging wind over 30y; extreme-heat days projected 7→15/yr by 2055 (HVAC capex compounding) — expect insurance premiums to compound above CPI over the hold.
Questions for the listing agent
- Built in 1918 — when were the roof, HVAC, electrical panel, plumbing, and water heater last replaced?
- Is there a deadline driving the sale (1031 exchange, divorce, estate, relocation)? That informs how much negotiation room exists.
- Schools are D-rated, which usually means shorter tenancies and higher turnover. Who's the typical renter profile here, and what's been the actual vacancy rate?
- What's the average days-on-market for RENTAL listings here right now (not sales)? A rising rental-DOM trend means longer vacancies and softer asking-rent achievability than the comps imply.
- What's the recent tenant-quality profile in this submarket — average credit score on applications, eviction rate, late-payment / NSF rate, and stable-employment percentage? A property-management company in the area should have these aggregated.
- How much new for-sale + rental construction is in the pipeline within 1–3 miles? Heavy new supply typically softens prices + rents 12–24 months out; constrained supply supports both.
Investment metrics
- 1% rule
- 1.13% ✓
- Cap rate
- 8.17%
- Cash-on-cash
- 6.69%
- DSCR
- 1.30
- GRM
- 7.4
CMA / ARV
- ARV (on-the-fly)
- $304,975
- Comps found
- 12
Show comp detail 12 sales within ~0.75 mi
| Address | Dist | Beds/Ba | Sqft | Sold | Price | $/sf | Match |
|---|---|---|---|---|---|---|---|
| 190 Light St | 0.36mi | 3/1.0 | 1,128 (+2%) | 1mo | $355,000 | $315 | 79 |
| 69 Weber Ave | 0.10mi | 3/1.0 | 1,202 (+8%) | 3mo | $330,000 | $275 | 79 |
| 206 Remington St | 0.53mi | 3/1.0 | 1,124 (+1%) | 0mo | $300,000 | $267 | 73 |
| 459 East Ave | 0.21mi | 3/1.0 | 1,267 (+14%) | 1mo | $266,000 | $210 | 65 |
| 35 Kent Ave | 0.33mi | 3/1.5 | 1,240 (+12%) | 3mo | $335,000 | $270 | 60 |
| 500 Barnum Ter Ext | 0.63mi | 3/1.0 | 1,188 (+7%) | 0mo | $381,000 | $321 | 58 |
| 510 Barnum Ter Ext | 0.63mi | 3/1.0 | 1,188 (+7%) | 1mo | $325,000 | $274 | 58 |
| 170 Judson Pl | 0.42mi | 3/1.0 | 1,271 (+15%) | 0mo | $320,000 | $252 | 56 |
| 71 Oakland St | 0.72mi | 3/1.5 | 1,169 (+5%) | 2mo | $380,000 | $325 | 54 |
| 220 Victory St | 0.58mi | 3/1.5 | 1,232 (+11%) | 2mo | $345,000 | $280 | 51 |
| 59 Oakland St | 0.72mi | 2/2.0 (-1) | 1,065 (-4%) | 1mo | $365,000 | $343 | 50 |
| 366 Dover St | 0.58mi | 3/2.5 | 1,239 (+12%) | 0mo | $275,000 | $222 | 47 |
Match score weights: distance 35% · size 25% · config 20% · recency 20%. Top-matched comps best support the ARV.
Projected returns pro-forma
-3.0% appreciation · 3.0% rent growth · sell at horizon
- IRR
- -6.0%
- Equity multiple
- 0.78×
- Total profit
- $-12,421
- Equity at exit
- $29,806
- IRR
- 3.7%
- Equity multiple
- 1.27×
- Total profit
- $15,147
- Equity at exit
- $17,284
Cash invested: $55,972 (down + closing). Projections, not guarantees.
Landlord ↔ Tenant lean methodology
- Overall (STATE)
- 27 Tenant-Leaning
- State Connecticut
- 27 Tenant-Leaning · D+7
- County
- — inherits STATE
- City
- — inherits STATE
ZIP-level market 06610
- Home prices YoY
- -7.5%
- Active inventory
- 68
- Price-to-rent
- 7.4×
Monthly cashflow live
- Estimated rent
- $2,257 high interval (Pro) →
- Mortgage (P&I)
- −$1,048
- Tax from tax record
- −$339 /mo · $4,072/yr
- Insurance
- −$83
- HOA
- −$0
- Vacancy / Maint / Mgmt
- −$474
- Net cashflow
- $312
Break-even live
UW: 25.0% down · 7.5% · 30yr · 1.5% tax · 5.0% vac · 8.0% maint · 8.0% mgmt
Financing live
Cash to close
- Down payment
- $49,975
- Closing costs
- $5,997
- Reserves months
- —
- Total cash needed
- —
Loan-product check · same deal, 3 products live
Conventional
25% down · 7.5% · 30yr
- Down + closing
- —
- Monthly P&I
- —
- Monthly cashflow
- —
- DSCR
- —
- Eligible?
- —
Personal DTI + credit; lowest rate.
DSCR
20% down · 8.5% · 30yr
- Down + closing
- —
- Monthly P&I
- —
- Monthly cashflow
- —
- DSCR
- —
- Eligible?
- —
No personal income docs; deal must DSCR.
Hard money
10% down · 12.0% · 12mo
- Down + closing
- —
- Monthly P&I
- —
- Monthly cashflow
- —
- DSCR
- —
- Eligible?
- —
Short-term bridge; refi at stabilization.
Rent comps 40 comps
| Address | Beds | Baths | Sqft | Rent | $/sqft | DOM | Units | Dist |
|---|---|---|---|---|---|---|---|---|
| 228 Weber St Unit 2ndfl Stratford, CT | 2.0 | 1.0 | 937 | $2,100 | $2.24 | 44d | 1 | 0.14mi |
| 129 Sage Ave Unit 2R Bridgeport, CT | 2.0 | 1.0 | 1030 | $1,750 | $1.70 | 21d | 1 | 0.23mi |
| 285 Clover St Unit 2 Stratford, CT | 3.0 | 1.0 | 1152 | $2,150 | $1.87 | 43d | 1 | 0.24mi |
| 285 Clover St Unit 2 Stratford, CT | 2.0 | 1.0 | 1152 | $2,150 | $1.87 | 23d | 1 | 0.24mi |
| 47 Clover St Stratford, CT | 2.0 | 1.0 | 1280 | $1,950 | $1.52 | 14d | 1 | 0.25mi |
| 64 Velvet St Bridgeport, CT | 3.0 | 1.0 | 1430 | $2,500 | $1.75 | 11d | 1 | 0.30mi |
| 184 Pearl Harbor St Unit 2 Bridgeport, CT | 2.0 | 1.0 | 850 | $2,000 | $2.35 | 23d | 1 | 0.31mi |
| 2336 Barnum Ave Stratford, CT | 2.0 | 1.0 | 1272 | $1,950 | $1.53 | 3d | 1 | 0.34mi |
| 246 Judson Pl Apt B Bridgeport, CT | 3.0 | 1.0 | 1000 | $2,800 | $2.80 | 14d | 1 | 0.36mi |
| 250 Summerfield Ave Unit 1 Bridgeport, CT | 2.0 | 1.0 | 1000 | $1,875 | $1.88 | 2d | 1 | 0.36mi |
| 110-112 Pixlee Pl Unit 2 Bridgeport, CT | 2.0 | 1.0 | 1151 | $1,800 | $1.56 | 21d | 1 | 0.37mi |
| 253 East Ave Unit 253 Bridgeport, CT | 2.0 | 1.0 | 1267 | $1,750 | $1.38 | 23d | 1 | 0.39mi |
| 1804 Barnum Ave Unit 10 Bridgeport, CT | 2.0 | 1.0 | 1100 | $2,000 | $1.82 | 43d | 1 | 0.40mi |
| 172 Swanson Ave Stratford, CT | 3.0 | 1.5 | 1495 | $3,300 | $2.21 | 2d | 1 | 0.42mi |
| 53 Pixlee Pl Unit 2nd Bridgeport, CT | 3.0 | 1.0 | 1475 | $2,195 | $1.49 | 3d | 1 | 0.44mi |
| 335 Ridgefield Ave Bridgeport, CT | 3.0 | 1.0 | 1400 | $2,250 | $1.61 | 3d | 1 | 0.45mi |
| 333 Ridgefield Ave Bridgeport, CT | 3.0 | 1.0 | 1400 | $2,250 | $1.61 | 3d | 1 | 0.46mi |
| 192 Peace St Unit 1st floor Stratford, CT | 2.0 | 1.0 | 712 | $2,000 | $2.81 | 43d | 1 | 0.46mi |
| 144 Palisade Ave Bridgeport, CT | 3.0 | 1.0 | 1096 | $2,600 | $2.37 | 43d | 1 | 0.47mi |
| 123 Summerfield Ave Bridgeport, CT | 2.0 | 1.0 | 1026 | $2,300 | $2.24 | 43d | 1 | 0.48mi |
| 136 Peace St Unit 4 Stratford, CT | 2.0 | 1.0 | 800 | $1,700 | $2.12 | 43d | 1 | 0.48mi |
| 75 Judson Pl Bridgeport, CT | 3.0 | 1.5 | 1384 | $2,850 | $2.06 | 14d | 1 | 0.49mi |
| 54 Remington St Bridgeport, CT | 3.0 | 1.0 | 1004 | $1,900 | $1.89 | 3d | 1 | 0.54mi |
| 371 Dover St Unit 371 Bridgeport, CT | 2.0 | 1.0 | 900 | $2,100 | $2.33 | 43d | 1 | 0.58mi |
| 268 Bond St Bridgeport, CT | 2.0 | 1.0 | 900 | $2,200 | $2.44 | 43d | 1 | 0.60mi |
| 556 Hollister St Stratford, CT | 1.0–2.0 | 1.0 | 725 | $2,295 | $3.17 | 11d | 4 | 0.60mi |
| 1874 Barnum Ave Unit 2E Stratford, CT | 3.0 | 1.0 | 1000 | $2,800 | $2.80 | 3d | 1 | 0.61mi |
| 1145 Ogden St Unit 3R Bridgeport, CT | 3.0 | 1.0 | 1000 | $1,695 | $1.70 | 14d | 1 | 0.64mi |
| 591 Pearl Harbor St Bridgeport, CT | 2.0 | 1.0 | 900 | $1,750 | $1.94 | 3d | 1 | 0.66mi |
| 334 Hollister St Unit 2 Stratford, CT | 2.0 | 1.0 | 832 | $2,200 | $2.64 | 11d | 1 | 0.69mi |
| 2156 Seaview Ave Fl LHS Bridgeport, CT | 3.0 | 1.0 | 1000 | $2,400 | $2.40 | 43d | 1 | 0.70mi |
| 600 Bond St Unit 113 Bridgeport, CT | 2.0 | 1.0 | 893 | $3,000 | $3.36 | 43d | 1 | 0.76mi |
| 56-58 Edwin St Unit 2 Bridgeport, CT | 2.0 | 1.0 | 900 | $1,900 | $2.11 | 43d | 1 | 0.91mi |
| 314 Knowlton St Stratford, CT | 4.0 | 1.5 | 1015 | $3,150 | $3.10 | 43d | 1 | 0.97mi |
| 481 Hollister Ave Unit 2nd Bridgeport, CT | 3.0 | 1.0 | 1250 | $2,000 | $1.60 | 23d | 1 | 0.99mi |
| 36 Carver St Unit 1 Bridgeport, CT | 2.0 | 1.0 | 1094 | $2,200 | $2.01 | 23d | 1 | 0.99mi |
| 22-26 Carver St Bridgeport, CT | 2.0 | 1.0 | 1094 | $2,200 | $2.01 | 11d | 1 | 1.00mi |
| 458 Hollister Ave Unit 2nd Bridgeport, CT | 3.0 | 1.0 | 1100 | $1,899 | $1.73 | 43d | 1 | 1.00mi |
| 11 Colony St Stratford, CT | 4.0 | 2.0 | 1450 | $3,700 | $2.55 | 3d | 1 | 1.01mi |
| 116 Hastings St Bridgeport, CT | 2.0 | 1.5 | 857 | $2,400 | $2.80 | 14d | 1 | 1.02mi |
Listing history 6 events
-
2026-06-05status $199,900 Under Contract 7 DOM
-
2026-06-03days on market $199,900 Active 7 DOM
-
2026-06-03days on market $199,900 Active 6 DOM
-
2026-06-01days on market $199,900 Active 5 DOM
-
2026-05-31days on market $199,900 Active 4 DOM
-
2026-05-27$199,900 Active
ⓘ Source: listings_history table (triggers on properties + properties_extension) + one-shot
backfill from property_details.listing_events for pre-trigger history.
Tax reassessment forecast CT · Partial reset (capped growth)
- Current annual tax
- $4,072 · $339/mo
- Projected year-2 tax
- $4,175 · $348/mo
- Expected delta
- +$103/yr (+$9/mo · 2.5%)
ⓘ Screening estimate from a state-policy table — verify with the county assessor before closing.
Climate risk First Street
- Flood 1/10 Low FEMA zone X (unshaded) · 0% chance over 30 yrs
- Wildfire 1/10 Low
- Heat 6/10 Major 7 d/yr ≥97°F today · 15 d/yr by 30 yrs out
- Wind 6/10 Major 54% chance of damaging wind over 30 yrs
- Air quality 4/10 Moderate 5 unhealthy d/yr today · 7 by 30 yrs out
Nearby sold comps map
Loading sold comps map…
Walkable amenities ~0.75 mi
Loading nearby amenities…
Taxation est. · year 1
- Rental income
- $27,085
- − Mortgage interest
- −$11,198
- − Property taxes
- −$4,072
- − Insurance
- −$1,000
- − Repairs & maintenance
- −$2,167
- − Management
- −$2,167
- − Depreciation
- −$5,815
- Taxable income
- $667
- Est. tax owed @ 24.0%
- −$160
- After-tax cash flow
- $3,586/yr
For passive investors: Depreciation is non-cash, so a rental often shows a tax loss while cash-flowing — sheltering income. Rental losses are passive: they offset passive income freely, and up to $25,000/yr can offset ordinary (W-2) income if you actively participate and your MAGI is under $100k (phasing out to $0 by $150k); unused losses carry forward. On sale, claimed depreciation is recaptured at up to 25%, and gains may owe capital-gains tax (a 1031 exchange can defer both). Figures are a year-1 estimate at your 24.0% rate — not tax advice; consult a CPA.
Schools (NCES district)
- District
- Bridgeport School District
- NCES district ID
- 0900450
- Math proficiency
- 9% ▼ -7.00%
- Reading proficiency
- 19% ▼ -10.00%
- Median HH income
- $41,507
- Composite
- 12.09/100
- National rank
- #9656
- State rank
- #151 of 153 in CT
Livability — Bridgeport
- Score
- 81/100
- State rank
- #15
- US rank
- #1374
Category grades
Schools grade is shown separately in the Schools card above.
Census & demographics
- Census place
- Bridgeport, CT
- County
- Fairfield County · 765,532 people
- City population
- 149,153
- Metro
- Bridgeport-Stamford-Norwalk, CT
- Population (ZIP)
- 22,020
- Household income
- $51,634
- Rent vs Own
- Severe rent burden
- 1368.0
Population outlook (Greater Bridgeport County) Hauer SSP2
- By 2040
- 365,581
Race, ethnicity, and origin ACS 2023
- Neighborhood character
- Diverse neighborhood (Simpson 0.65)
- Race & ethnicity
- Hispanic / Latino 51% Black 23% White 20% Two or more races 14% Asian 3% Native American 1%
- Hispanic origin (detail)
- Mexican 3% Puerto Rican 30% Dominican 6%
- Common ancestry
- Romanian 4% Estonian 3% Hispanic 2%
- Foreign-born
- 31% · Canada, Jamaica, Vietnam
- Languages at home
- 47% English-only · Spanish 40% Other Indo-European 5% Russian/Polish/Slavic 3%
Political lean MEDSL · Greater Bridgeport
- 2024 margin
- Strong D (+23.3) · D 60.9% · R 37.6% · Other 1.5%
- All cycles
- 2024: D+23.3
Not yet ingested
- Civics
- —
Market trends
- HPI YoY
- ▼ -29.78%
- Current HPI
- 370.1432
- Rent YoY
- —
- Metro
- Bridgeport-Stamford-Norwalk, CT
- State GDP YoY
- ▲ 1.06%
- F500 in state
- 38
Industry mix (Fortune 500 HQ in CT)
| Industry | F500 HQs | Revenue |
|---|---|---|
| Industrial Machinery | 4 | $38B |
|
||
| Insurance | 3 | $71B |
|
||
| Financial Services | 2 | $25B |
|
||
| Transportation / Logistics | 2 | $18B |
|
||
| Healthcare | 1 | $247B |
|
||
| Telecommunications | 1 | $55B |
|
||
Price history
1 event — show timeline
- 2026-05-27 Listed $199,900 Smart MLS
Property tax history
-0.8%/yrLatest (2023): $4,072 · +0.0% YoY. Source: county tax records.
Cash-flow waterfall
monthlySold comps — $/sqft
last 12 mo · ≤1 miLoading sold comps…