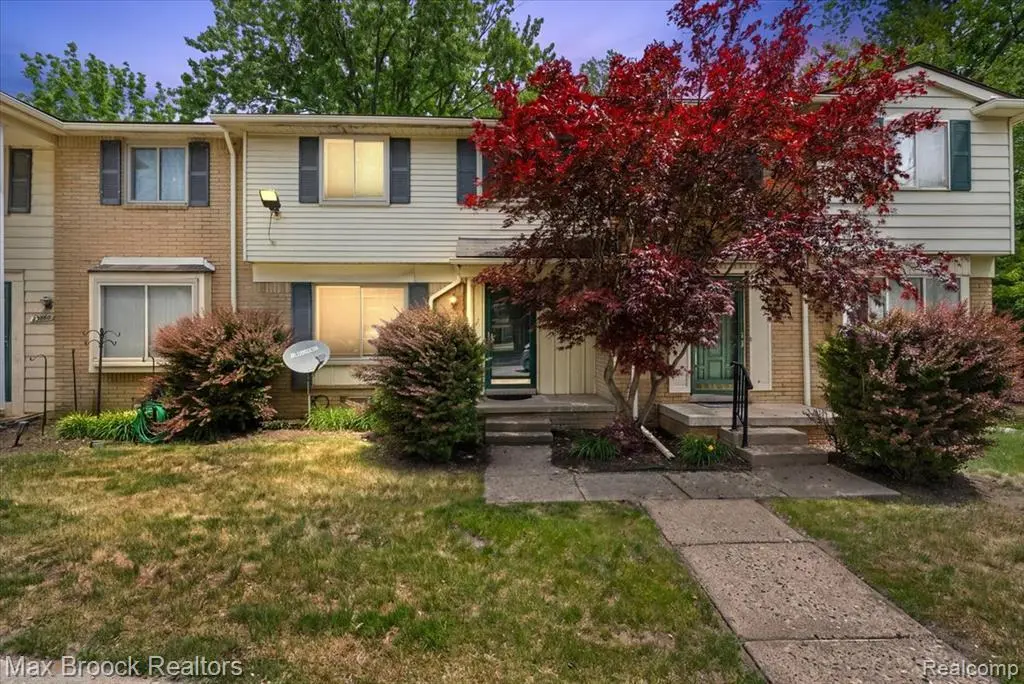
23656 Lahser Rd · Southfield, MI
Flood risk 1/10 · Minimal
- FEMA flood zone
- X (unshaded)
- Chance of flooding over 30 yrs
- 0.0%
- Est. flood insurance / yr
- $473 – $860
Fire risk 1/10 · Minimal
- Est. fire insurance / yr
- $784 – $1,456
Heat risk 3/10 · Minor
- Hot days now (above 97°F)
- 7 days/yr
- Hot days in 30 yrs
- 15 days/yr
Wind risk 2/10 · Minimal
- Chance of severe wind over 30 yrs
- —
Air-quality risk 3/10 · Minor
- Unhealthy air days now
- 2 days/yr
- Unhealthy air days in 30 yrs
- 4 days/yr
Risk factors via First Street. Map © Google.
Why this score? — see what drove the D grade
The composite is a weighted blend of 9 inputs, each scored 0–100. Each bar is that input's sub-score; the figure is the points it added to the 100-point composite (weight × sub-score).
- Cash flow +13.9/30.0
- ARV discount +7.5/15.0
- 1% rule +6.1/10.0
- DSCR +4.2/10.0
- Livability +3.6/5.0
- Condition / age +2.5/5.0
- Schools +2.4/10.0
- Rent growth +2.0/5.0
- Appreciation +0.0/10.0
$158,000
🖨 Deal sheet (PDF) 📄 Offer letter ✓ Due diligence
Listing remarks MLS
This is the one you've been waiting for. Updated, move-in-ready condo featuring a spacious eat-in kitchen with white shaker cabinets, stainless steel appliances, granite countertops, and new flooring throughout. The main level includes a bright kitchen and living area, along with a renovated half bath for convenience. Upstairs offers refreshed bedrooms and an updated full bathroom with modern fixtures and finishes. Excellent value for a clean, updated home with great functionality and style.
Key facts
- New flooring
- Renovated half bath
- Eat-in kitchen
Tags
Property features AI
Finance
- Other: Listed by Max Broock, REALTORS®-Bloomfield Hills
- HOA & community: Homeowners association with $300 monthly fee; HOA fee covers grounds maintenance, snow removal, and trash
Exterior
- Parking: No garage; assigned parking
- Utilities: Public water; Public sewer
- Home design: Condominium (residential); Entry at ground level with steps; Two stories
- Construction: Aluminum siding and brick exterior
- Exterior features: Paved private road with private maintenance; Pets allowed; Subdivision: WILLOW POND CONDO; Directions: South on Lahser, turn left on Mc Clung; Cross street: Lahser & Mc Clung
Interior
- Bathrooms: 1 full bathroom; 1 half bathroom
- Heating & cooling: Central air conditioning; Forced air heating (natural gas)
- Interior features: Two-level unit; Unfinished basement; Total of 5 rooms
Neighborhood map
What this means for you Summary
Snapshot
- This is a 2-bed/1.5-bath condo listed at $158k.
Deal economics
- At list price, monthly cash flow is $16 ($192/yr) — positive.
- The deal already cash-flows at list — no discount required.
- Meets the 1% rule at list price ($2k rent vs $158k).
- Cap rate 6.4% vs local median 4.6% in Southfield — top-decile yield for the area; either an underpriced asset or a hidden risk that comps aren't pricing in. Stress-test before assuming the spread holds.
Location & tenants
- Location reads 72/100 on livability (#248 in MI) — a middle-class / working-renter tenant base. Strengths: commute A+, cost of living A+, housing A+; Watch: health & safety D, crime F, amenities F.
- Southfield Public School District (urban): math 17% / reading 37% proficiency, ranked #392 of 540 in MI (top 73%) — low school quality limits family demand, transient renter base, plan for 1-2y turnover.
- Zoned schools: Morris Adler Elementary School (math 5% / reading 5%, grade F, #1,325 of 1,397 statewide, top 99%, 336 students, 67% FRL); Glenn W Levey Middle School (math 8% / reading 22%, grade F, #453 of 493 statewide, top 93%, 316 students, 62% FRL).
- Zoned-school proficiency averages 10% at this address vs 27% district-wide (-17 pts) — the specific schools serving this property underperform the Southfield Public School District average; the district grade overstates school quality for this exact location.
- Market conditions: Rents soft (-2.0%/yr); 82 active listings in the ZIP; 15 comparable units currently listed for rent nearby; rentals at typical pace (median 26d on market — plan ~3-4 weeks tenant-placement turnaround); 40% of comp listings sitting > 30 days — soft ceiling on asking rent; 2,614 units permitted in Oakland County in 2024 (721 in 5+ unit buildings).
- This rent runs 34% of the median local income ($61k/yr) — at the standard rent-burdened threshold; future hikes will face affordability resistance.
Forward outlook
- Local home prices are declining (-3.0%/yr); year-one equity from $1k of loan paydown is wiped out by about $5k of value loss. Plan a longer hold.
- Oakland County population projected at +10% by 2050 — modest demand growth; plan on rents tracking national, not racing it.
Negotiation context
- Only 9 days on market — expect competitive offers; lowballing is unlikely to land.
- 2 sale attempts with the ask held roughly flat each time — persistent listings suggest the price (not the market) is what's stuck; bring a comps-based counter.
- Current owner paid $70k; list at $158k implies a 126% gain — meaningful room to come down on a strong offer.
Questions for the listing agent
- Built in 1973 — when were the roof, HVAC, electrical panel, plumbing, and water heater last replaced?
- What does the HOA fee cover, when was the last increase, and are there any pending special assessments or reserve-fund shortfalls?
- Any open or pending special assessments — roof, HVAC, plumbing, elevator, façade? What's the per-unit balance and payoff schedule, and is the seller paying it off at close or rolling it to the buyer?
- Is there a deadline driving the sale (1031 exchange, divorce, estate, relocation)? That informs how much negotiation room exists.
- Schools are D-rated, which usually means shorter tenancies and higher turnover. Who's the typical renter profile here, and what's been the actual vacancy rate?
- Crime grade is F in this area — have there been break-ins, vandalism, or insurance claims at this property in the last 3 years? What carrier currently insures it and at what premium?
- The area grade is low — what's the realistic commute time and amenity access for the typical tenant pool here? Any planned neighborhood developments (good or bad) we should know about?
- What's the average days-on-market for RENTAL listings here right now (not sales)? A rising rental-DOM trend means longer vacancies and softer asking-rent achievability than the comps imply.
- What's the recent tenant-quality profile in this submarket — average credit score on applications, eviction rate, late-payment / NSF rate, and stable-employment percentage? A property-management company in the area should have these aggregated.
- How much new apartment / multifamily construction is in the pipeline within 1–3 miles? Heavy new supply (>2% of stock underway) typically softens rents 12–24 months out; light construction supports rent growth.
Investment metrics
- 1% rule
- 1.11% ✓
- Cap rate
- 6.41%
- Cash-on-cash
- 0.43%
- DSCR
- 1.02
- GRM
- 7.5
CMA / ARV
No comps found within radius.
Projected returns pro-forma
-3.0% appreciation · 0.0% rent growth · sell at horizon
- IRR
- -19.8%
- Equity multiple
- 0.33×
- Total profit
- $-29,522
- Equity at exit
- $23,558
- IRR
- -23.8%
- Equity multiple
- 0.02×
- Total profit
- $-43,446
- Equity at exit
- $13,661
Cash invested: $44,240 (down + closing). Projections, not guarantees.
Landlord ↔ Tenant lean methodology
- Overall (STATE)
- 62 Landlord-Friendly
- State Michigan
- 62 Landlord-Friendly · EVEN
- County
- — inherits STATE
- City
- — inherits STATE
ZIP-level market 48033
- Rents YoY
- -2.0%
- Active inventory
- 82
- Price-to-rent
- 7.5×
Monthly cashflow live
- Estimated rent
- $1,753 high interval (Pro) →
- Mortgage (P&I)
- −$829
- Tax from tax record
- −$174 /mo · $2,092/yr
- Insurance
- −$66
- HOA
- −$300
- Vacancy / Maint / Mgmt
- −$368
- Net cashflow
- $16
Break-even live
Sensitivity live
| Price | -10% $105 | -5% $61 | +0% $16 | +5% $-29 | +10% $-73 |
|---|---|---|---|---|---|
| Rent | -10% $-122 | -5% $-53 | +0% $16 | +5% $85 | +10% $155 |
| Rate | -1.0pp $96 | -0.5pp $56 | base $16 | +0.5pp $-25 | +1.0pp $-67 |
UW: 25.0% down · 7.5% · 30yr · 1.5% tax · 5.0% vac · 8.0% maint · 8.0% mgmt
Financing live
Cash to close
- Down payment
- $39,500
- Closing costs
- $4,740
- Reserves months
- —
- Total cash needed
- —
Loan-product check · same deal, 3 products live
Conventional
25% down · 7.5% · 30yr
- Down + closing
- —
- Monthly P&I
- —
- Monthly cashflow
- —
- DSCR
- —
- Eligible?
- —
Personal DTI + credit; lowest rate.
DSCR
20% down · 8.5% · 30yr
- Down + closing
- —
- Monthly P&I
- —
- Monthly cashflow
- —
- DSCR
- —
- Eligible?
- —
No personal income docs; deal must DSCR.
Hard money
10% down · 12.0% · 12mo
- Down + closing
- —
- Monthly P&I
- —
- Monthly cashflow
- —
- DSCR
- —
- Eligible?
- —
Short-term bridge; refi at stabilization.
Rent comps 15 comps
| Address | Beds | Baths | Sqft | Rent | $/sqft | DOM | Units | Dist |
|---|---|---|---|---|---|---|---|---|
| 21642 Hidden Rivers Dr S #27 Southfield, MI | 3.0 | 2.5 | 1354 | $2,100 | $1.55 | 45d | 1 | 0.12mi |
| 23404 Plum Hollow St Southfield, MI | 3.0 | 1.5 | 1050 | $2,000 | $1.90 | 26d | 1 | 0.23mi |
| 22419 Fairway Dr Southfield, MI | 3.0 | 1.0 | 1262 | $1,850 | $1.47 | 26d | 1 | 0.80mi |
| 21210 Lahser Rd Southfield, MI | 1.0 | 1.0 | 770 | $1,175 | $1.53 | 7d | 1 | 0.99mi |
| 23741 Pond Rd Southfield, MI | 1.0–2.0 | 1.0–2.5 | 1414 | $1,786 | $1.26 | 1d | 13 | 1.06mi |
| 47129 Wedgewood Southfield, MI | 1.0–2.0 | 1.0–2.0 | 1000 | $1,275 | $1.27 | 45d | 1 | 1.17mi |
| 22700 Civic Center Dr Southfield, MI | 1.0–2.0 | 1.0–2.0 | 1025 | $2,078 | $2.03 | 3d | 1 | 1.18mi |
| 22266 Civic Center Dr Southfield, MI | 1.0–2.0 | 1.0–2.0 | 1050 | $1,505 | $1.43 | 1d | 8 | 1.21mi |
| 20284 Melrose St Southfield, MI | 3.0 | 1.0 | 1200 | $1,550 | $1.29 | 45d | 1 | 1.29mi |
| 23344 Park Place Dr Southfield, MI | 1.0–2.0 | 1.0–2.0 | 1031 | $2,080 | $2.02 | 0d | 11 | 1.38mi |
| 22045 Michigan 102 Detroit, MI | 1.0 | 1.0 | 750 | $775 | $1.03 | 45d | 1 | 1.41mi |
| 5000 Town Ctr #607 Southfield, MI | 1.0 | 1.0 | 900 | $1,695 | $1.88 | 20d | 1 | 1.42mi |
| 20300 Civic Center Dr Southfield, MI | 4.0 | 1.0–2.0 | 1200 | $1,758 | $1.46 | 0d | 14 | 1.43mi |
| 20555 Lahser Rd Detroit, MI | 1.0–2.0 | 1.0 | 737 | $975 | $1.32 | 45d | 2 | 1.44mi |
| 23638 Civic Center Dr Southfield, MI | 1.0–2.0 | 1.0–2.0 | 970 | $1,230 | $1.27 | 45d | 1 | 1.46mi |
HOA detail condo
- Monthly dues
- $300 · $3,600/yr
- Assessments
- None detected in remarks — confirm with the listing agent.
Listing history 7 events
-
2026-06-21days on market $158,000 Active 9 DOM
-
2026-06-18days on market $158,000 Active 6 DOM
-
2026-06-17days on market $158,000 Active 5 DOM
-
2026-06-16days on market $158,000 Active 4 DOM
-
2026-06-15days on market $158,000 Active 3 DOM
-
2026-06-13remarks 496-char remark
-
2026-06-13$158,000 Active 1 DOM
ⓘ Source: listings_history table (triggers on properties + properties_extension) + one-shot
backfill from property_details.listing_events for pre-trigger history.
Tax reassessment forecast MI · Partial reset (capped growth)
- Current annual tax
- $2,092 · $174/mo
- Projected year-2 tax
- $2,262 · $189/mo
- Expected delta
- +$171/yr (+$14/mo · 8.2%)
ⓘ Screening estimate from a state-policy table — verify with the county assessor before closing.
Climate risk First Street
- Flood 1/10 Low FEMA zone X (unshaded) · 0% chance over 30 yrs
- Wildfire 1/10 Low
- Heat 3/10 Moderate 7 d/yr ≥97°F today · 15 d/yr by 30 yrs out
- Wind 2/10 Low
- Air quality 3/10 Moderate 2 unhealthy d/yr today · 4 by 30 yrs out
Nearby sold comps map
Loading sold comps map…
Walkable amenities ~0.75 mi
Loading nearby amenities…
Taxation est. · year 1
- Rental income
- $21,034
- − Mortgage interest
- −$8,850
- − Property taxes
- −$2,092
- − Insurance
- −$790
- − Repairs & maintenance
- −$1,683
- − Management
- −$1,683
- − HOA
- −$3,600
- − Depreciation
- −$4,596
- Taxable loss
- −$2,260
- Est. tax savings @ 24.0%
- +$542
- After-tax cash flow
- $735/yr
For passive investors: Depreciation is non-cash, so a rental often shows a tax loss while cash-flowing — sheltering income. Rental losses are passive: they offset passive income freely, and up to $25,000/yr can offset ordinary (W-2) income if you actively participate and your MAGI is under $100k (phasing out to $0 by $150k); unused losses carry forward. On sale, claimed depreciation is recaptured at up to 25%, and gains may owe capital-gains tax (a 1031 exchange can defer both). Figures are a year-1 estimate at your 24.0% rate — not tax advice; consult a CPA.
Schools (NCES district)
- District
- Southfield Public School District
- NCES district ID
- 2632310
- Math proficiency
- 17% ▼ -3.00%
- Reading proficiency
- 37% ▲ 1.00%
- Median HH income
- $51,400
- Composite
- 23.77/100
- National rank
- #7814
- State rank
- #392 of 540 in MI
Livability — Southfield
- Score
- 72/100
- State rank
- #248
- US rank
- #6175
Category grades
Schools grade is shown separately in the Schools card above.
Census & demographics
- Census place
- Southfield, MI
- County
- Oakland County · 1,009,092 people
- City population
- 54,914
- Metro
- Detroit-Warren-Dearborn, MI
- Population (ZIP)
- 17,277
- Household income
- $61,016
- Rent vs Own
- Severe rent burden
- 1166.0
Population outlook (Oakland County) Hauer SSP2
- Today (2025)
- 1,335,747 people
- By 2030
- 1,375,100 · +2.9%
- By 2040
- 1,435,385 · +7.5%
- By 2050
- 1,469,250 · +10.0%
- By 2075
- 1,531,946 · +14.7%
- By 2100
- 1,450,485 · +8.6%
Race, ethnicity, and origin ACS 2023
- Neighborhood character
- Predominantly Black (68%)
- Race & ethnicity
- Black 68% White 24% Two or more races 6% Asian 2% Hispanic / Latino 1%
- Common ancestry
- Romanian 3% Scotch-Irish 1% Slovak 1%
- Foreign-born
- 6% · Canada
- Languages at home
- 92% English-only · Spanish 1% Arabic 1% Russian/Polish/Slavic 1%
Political lean MEDSL · Oakland
- 2024 margin
- D (+10.6) · D 54.4% · R 43.8% · Other 1.9%
- 2008→2024 swing
- -3.9pp toward R · 2008: 14.5pp · 2024: 10.6pp
- All cycles
- 2024: D+10.6 2020: D+14.1 2016: D+8.1 2012: D+8.1 2008: D+14.5
Not yet ingested
- Civics
- —
Market trends
- HPI YoY
- ▼ -175.44%
- Current HPI
- 187.5011
- Rent YoY
- ▼ -1.96%
- Metro
- Detroit-Warren-Dearborn, MI
- State GDP YoY
- ▲ 1.37%
- F500 in state
- 28
Industry mix (Fortune 500 HQ in MI)
| Industry | F500 HQs | Revenue |
|---|---|---|
| Automotive Parts | 3 | $48B |
|
||
| Automotive | 2 | $372B |
|
||
| Chemicals | 1 | $45B |
|
||
| Automotive Retail | 1 | $29B |
|
||
| Healthcare / Medical Devices | 1 | $23B |
|
||
| Automotive Technology | 1 | $20B |
|
||
Price history
+58.0% since first listed4 events — show timeline
- 2026-06-12 Listed $158,000 MiRealSource-MiMLS
- 2026-06-12 Listed $158,000 REALCOMP
- 2018-10-30 Sold (Public Records) $70,000 Public Records
- 2001-05-17 Sold (Public Records) $99,990 Public Records
Property tax history
+4.5%/yrLatest (2025): $2,092 · +3.2% YoY. Source: county tax records.
Cash-flow waterfall
monthlySold comps — $/sqft
last 12 mo · ≤1 miLoading sold comps…