23750 Carson Dr #47 · Pioneer, CA
Flood risk 1/10 · Minimal
- FEMA flood zone
- X (unshaded)
- Chance of flooding over 30 yrs
- 0.0%
- Est. flood insurance / yr
- $507 – $1,088
Fire risk 8/10 · Major
- Est. fire insurance / yr
- $659 – $1,223
Heat risk 4/10 · Minor
- Hot days now (above 98°F)
- 3 days/yr
- Hot days in 30 yrs
- 8 days/yr
Wind risk 1/10 · Minimal
- Chance of severe wind over 30 yrs
- —
Air-quality risk 10/10 · Severe
- Unhealthy air days now
- 26 days/yr
- Unhealthy air days in 30 yrs
- 32 days/yr
Risk factors via First Street. Map © Google.
Why this score? — see what drove the B grade
The composite is a weighted blend of 9 inputs, each scored 0–100. Each bar is that input's sub-score; the figure is the points it added to the 100-point composite (weight × sub-score).
- Cash flow +30.0/30.0
- 1% rule +10.0/10.0
- DSCR +10.0/10.0
- ARV discount +9.4/15.0
- Livability +3.2/5.0
- Schools +2.7/10.0
- Rent growth +2.5/5.0
- Condition / age +2.5/5.0
- Appreciation +0.0/10.0
$91,000
🖨 Deal sheet 📄 Offer letter ✓ Due diligence
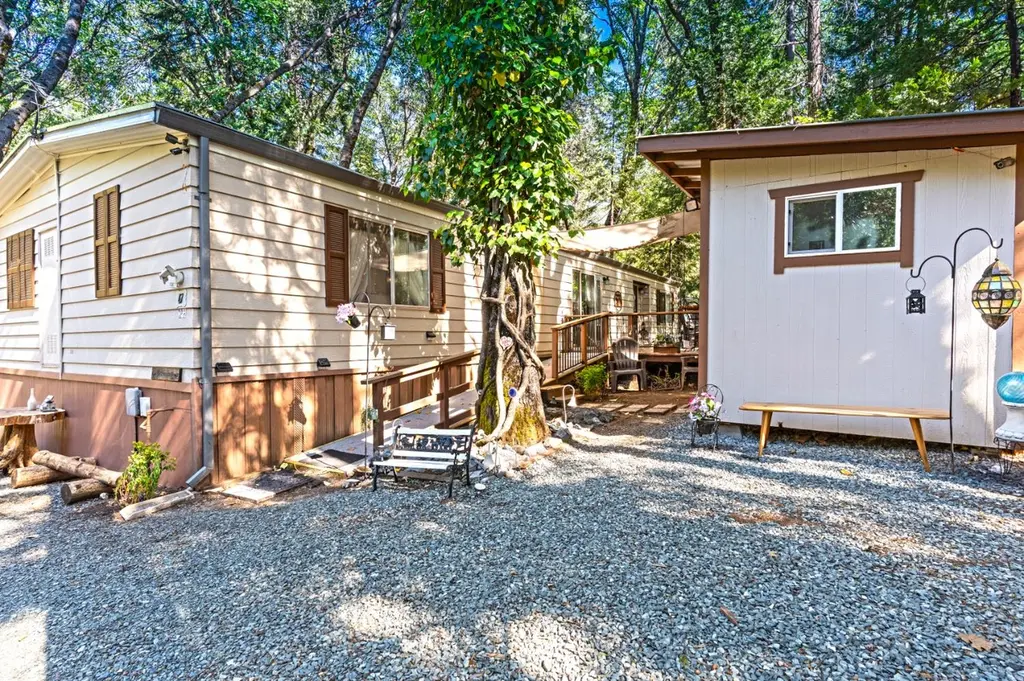
Listing remarks
A true rare find at 3750 Carson Dr. #47 in Pioneer! This beautifully updated 2 to 3 bedroom, 2 bath home is located in a peaceful all-age mobile home park surrounded by the serene beauty of Pioneer. Designed with comfort and functionality in mind, this spacious home offers an open floor plan with abundant natural light and flexible living space perfect for a possible third bedroom, office, or hobby room. The updated kitchen features stainless steel appliances, a gas range, bar-top seating for entertaining, and generous counter space, all flowing seamlessly into the main living areas with modern flooring and an inviting atmosphere. The spacious primary suite offers a spa-like feel with a hug
Key facts
- Bar-top seating
- Huge walk-in shower
- Updated kitchen
Tags
Property features AI
Finance
- Other: Located in Pioneer, CA 95666 (23750 Carson Dr #47)
- Financial info: Land lease: No (listed land lease amount present but land lease flagged No)
- HOA & community: No homeowners association
Exterior
- Parking: No garage
- Utilities: Generator backup and 220V electrical in laundry; Public sewer; Water from a public district
- Home design: Manufactured home in park; Double-wide; Built in 1978
- Construction: Composition roof; Aluminum skirting; Manufactured by MOUNTAIN HM
- Exterior features: Fenced lot
Interior
- Kitchen: Island; Kitchen and family room combined with a dining bar
- Bedrooms: 2 bedrooms (can be used as up to 3 bedrooms)
- Flooring: Carpet; Laminate
- Bathrooms: 2 full bathrooms; Bathrooms include double sinks, tub with shower over, and shower stall(s)
- Heating & cooling: Fireplace heating; Window air conditioning units
- Interior features: One living room fireplace with raised hearth; Deck attached to the living room; Pets allowed with limits on number and size; Total of 3 rooms
- Laundry & utility: Laundry inside a room; 220V outlet in laundry area
Neighborhood map
What this means for you Summary
Snapshot
- This is a 2-bed/2.0-bath manufactured listed at $91k.
Deal economics
- At list price, monthly cash flow is $825 ($10k/yr) — positive.
- The deal already cash-flows at list — no discount required.
- Meets the 1% rule at list price ($2k rent vs $91k).
- Recommended offer: $88k (3.0% below list) — sets the bar for market timing.
Location & tenants
- Location reads 64/100 on livability (#419 in CA) — a middle-class / working-renter tenant base. Strengths: employment A+, housing A+, crime A; Watch: schools D-, amenities F, commute F.
- Amador County Unified (town): math 23% / reading 37% proficiency, ranked #330 of 517 in CA (top 64%) — families likely to look elsewhere, expect single-tenant / working-renter base with shorter leases.
- Market conditions: 152 active listings in the ZIP; 66 units permitted in Amador County in 2024 (0 in 5+ unit buildings).
Forward outlook
- Local home prices are declining (-3.0%/yr); year-one equity from $629 of loan paydown is wiped out by about $3k of value loss. Plan a longer hold.
- Amador County population projected at -15% by 2050 — secular population decline; favor cash flow + early exit over multi-decade hold.
- At projected returns (-3.0% appreciation + 3.0% rent growth), your $25k cash investment doubles in ~4 years — after that, you're playing with house money.
Negotiation context
- It's been on market 38 days — a 3% lower offer ($88k) is reasonable based on typical stale-listing flexibility.
Risks & watch-outs
- Climate carrying-cost: severe wildfire risk — expect insurance premiums to compound above CPI over the hold.
Questions for the listing agent
- It's been on market 38 days. Have you received any prior offers? Is the seller open to a 3% concession, seller financing, or rate buy-down credit?
- Built in 1978 — when were the roof, HVAC, electrical panel, plumbing, and water heater last replaced?
- Is there a deadline driving the sale (1031 exchange, divorce, estate, relocation)? That informs how much negotiation room exists.
- Schools are D-rated, which usually means shorter tenancies and higher turnover. Who's the typical renter profile here, and what's been the actual vacancy rate?
- What's the average days-on-market for RENTAL listings here right now (not sales)? A rising rental-DOM trend means longer vacancies and softer asking-rent achievability than the comps imply.
- What's the recent tenant-quality profile in this submarket — average credit score on applications, eviction rate, late-payment / NSF rate, and stable-employment percentage? A property-management company in the area should have these aggregated.
- How much new for-sale + rental construction is in the pipeline within 1–3 miles? Heavy new supply typically softens prices + rents 12–24 months out; constrained supply supports both.
Investment metrics
- 1% rule
- 2.02% ✓
- Cap rate
- 17.17%
- Cash-on-cash
- 38.86%
- DSCR
- 2.73
- GRM
- 4.1
CMA / ARV
- ARV (median comp)
- $95,000
- List price
- $91,000
- Delta
- -4.21%
- Verdict
- FAIR
- Comps
- 3 within 1.0 mi
Show comp detail 2 sales within ~0.75 mi
| Address | Dist | Beds/Ba | Sqft | Sold | Price | $/sf | Match |
|---|---|---|---|---|---|---|---|
| 23750 Carson Dr #35 | 0.00mi | 2/2.0 | 1,440 (-3%) | 12mo | $15,000 | $10 | 85 |
| 23750 Carson Dr #27 | 0.04mi | 3/2.0 (+1) | 1,568 (+5%) | 3mo | $95,000 | $61 | 82 |
Match score weights: distance 35% · size 25% · config 20% · recency 20%. Top-matched comps best support the ARV.
Projected returns pro-forma
-3.0% appreciation · 3.0% rent growth · sell at horizon
- IRR
- 35.1%
- Equity multiple
- 2.49×
- Total profit
- $37,840
- Equity at exit
- $13,568
- IRR
- 41.9%
- Equity multiple
- 4.95×
- Total profit
- $100,741
- Equity at exit
- $7,868
Cash invested: $25,480 (down + closing). Projections, not guarantees.
Landlord ↔ Tenant lean methodology
- Overall (STATE)
- 18 Strongly Tenant-Friendly
- State California
- 18 Strongly Tenant-Friendly · D+13
- County
- — inherits STATE
- City
- — inherits STATE
ZIP-level market 95666
- Active inventory
- 152
- Price-to-rent
- 4.1×
Monthly cashflow live
- Estimated rent
- $1,841 medium interval (Pro) →
- Mortgage (P&I)
- −$477
- Tax est. 1.5%
- −$114 /mo · $1,365/yr
- Insurance
- −$38
- HOA
- −$0
- Vacancy / Maint / Mgmt
- −$387
- Net cashflow
- $825
Break-even live
UW: 25.0% down · 7.5% · 30yr · 1.5% tax · 5.0% vac · 8.0% maint · 8.0% mgmt
Financing live
Cash to close
- Down payment
- $22,750
- Closing costs
- $2,730
- Reserves months
- —
- Total cash needed
- —
Loan-product check · same deal, 3 products live
Conventional
25% down · 7.5% · 30yr
- Down + closing
- —
- Monthly P&I
- —
- Monthly cashflow
- —
- DSCR
- —
- Eligible?
- —
Personal DTI + credit; lowest rate.
DSCR
20% down · 8.5% · 30yr
- Down + closing
- —
- Monthly P&I
- —
- Monthly cashflow
- —
- DSCR
- —
- Eligible?
- —
No personal income docs; deal must DSCR.
Hard money
10% down · 12.0% · 12mo
- Down + closing
- —
- Monthly P&I
- —
- Monthly cashflow
- —
- DSCR
- —
- Eligible?
- —
Short-term bridge; refi at stabilization.
Listing history 16 events
-
2026-06-18days on market $91,000 Active 38 DOM
-
2026-06-17days on market $91,000 Active 37 DOM
-
2026-06-16days on market $91,000 Active 36 DOM
-
2026-06-15days on market $91,000 Active 35 DOM
-
2026-06-13days on market $91,000 Active 33 DOM
-
2026-06-13days on market $91,000 Active 32 DOM
-
2026-06-09days on market $91,000 Active 29 DOM
-
2026-06-08days on market $91,000 Active 28 DOM
-
2026-06-07days on market $91,000 Active 27 DOM
-
2026-06-05days on market $91,000 Active 24 DOM
-
2026-06-03days on market $91,000 Active 23 DOM
-
2026-06-02days on market $91,000 Active 22 DOM
-
2026-06-01days on market $91,000 Active 21 DOM
-
2026-05-31days on market $91,000 Active 20 DOM
-
2012-01-26historical
-
2012-01-10$12,000
ⓘ Source: listings_history table (triggers on properties + properties_extension) + one-shot
backfill from property_details.listing_events for pre-trigger history.
Climate risk First Street
- Flood 1/10 Low FEMA zone X (unshaded) · 0% chance over 30 yrs
- Wildfire 8/10 Severe
- Heat 4/10 Moderate 3 d/yr ≥98°F today · 8 d/yr by 30 yrs out
- Wind 1/10 Low
- Air quality 10/10 Extreme 26 unhealthy d/yr today · 32 by 30 yrs out
Nearby sold comps map
Loading sold comps map…
Walkable amenities ~0.75 mi
Loading nearby amenities…
Taxation est. · year 1
- Rental income
- $22,088
- − Mortgage interest
- −$5,097
- − Property taxes
- −$1,365
- − Insurance
- −$455
- − Repairs & maintenance
- −$1,767
- − Management
- −$1,767
- − Depreciation
- −$2,647
- Taxable income
- $8,989
- Est. tax owed @ 24.0%
- −$2,157
- After-tax cash flow
- $7,745/yr
For passive investors: Depreciation is non-cash, so a rental often shows a tax loss while cash-flowing — sheltering income. Rental losses are passive: they offset passive income freely, and up to $25,000/yr can offset ordinary (W-2) income if you actively participate and your MAGI is under $100k (phasing out to $0 by $150k); unused losses carry forward. On sale, claimed depreciation is recaptured at up to 25%, and gains may owe capital-gains tax (a 1031 exchange can defer both). Figures are a year-1 estimate at your 24.0% rate — not tax advice; consult a CPA.
Schools (NCES district)
- District
- Amador County Unified
- NCES district ID
- 0602450
- Math proficiency
- 23% ▼ -9.00%
- Reading proficiency
- 37% ▼ -10.00%
- Median HH income
- $55,428
- Composite
- 26.67/100
- National rank
- #7163
- State rank
- #330 of 517 in CA
Livability — Pioneer
- Score
- 64/100
- State rank
- #419
- US rank
- #14266
Category grades
Schools grade is shown separately in the Schools card above.
Census & demographics
- Census place
- Pioneer, CA
- Population (ZIP)
- 6,089
Population outlook (Amador County) Hauer SSP2
- Today (2025)
- 35,295 people
- By 2030
- 34,147 · -3.3%
- By 2040
- 31,618 · -10.4%
- By 2050
- 29,913 · -15.2%
- By 2075
- 27,308 · -22.6%
- By 2100
- 23,465 · -33.5%
Race, ethnicity, and origin ACS 2023
- Neighborhood character
- Predominantly White (81%)
- Race & ethnicity
- White 81% Hispanic / Latino 13% Two or more races 9% Asian 1%
- Hispanic origin (detail)
- Mexican 10%
- Common ancestry
- Italian 4% Scottish 4% Slovak 2%
- Foreign-born
- 2% · Canada, South Korea
- Languages at home
- 96% English-only · Spanish 1% German/W. Germanic 1% Tagalog/Filipino 1%
Political lean MEDSL · Amador
- 2024 margin
- Strong R (+27.8) · D 34.7% · R 62.6% · Other 2.7%
- 2008→2024 swing
- -13.2pp toward R · 2008: -14.6pp · 2024: -27.8pp
- All cycles
- 2024: R+27.8 2020: R+24.4 2016: R+25.2 2012: R+19.0 2008: R+14.6
Not yet ingested
- Civics
- —
Market trends
- HPI YoY
- ▼ -107.84%
- Current HPI
- 143.0962
- Rent YoY
- —
- Metro
- —
- State GDP YoY
- ▲ 3.21%
- F500 in state
- 116
Industry mix (Fortune 500 HQ in CA)
| Industry | F500 HQs | Revenue |
|---|---|---|
| Technology | 27 | $1,492B |
|
||
| Financial Services | 3 | $174B |
|
||
| Retail | 3 | $44B |
|
||
| Insurance | 3 | $26B |
|
||
| Media / Entertainment | 2 | $115B |
|
||
| Pharmaceuticals / Biotech | 2 | $62B |
|
||
Price history
2 events — show timeline
- 2012-01-26 Listing Removed — CRMLS
- 2012-01-10 Listed $12,000 CRMLS
Cash-flow waterfall
monthlySold comps — $/sqft
last 12 mo · ≤1 miLoading sold comps…