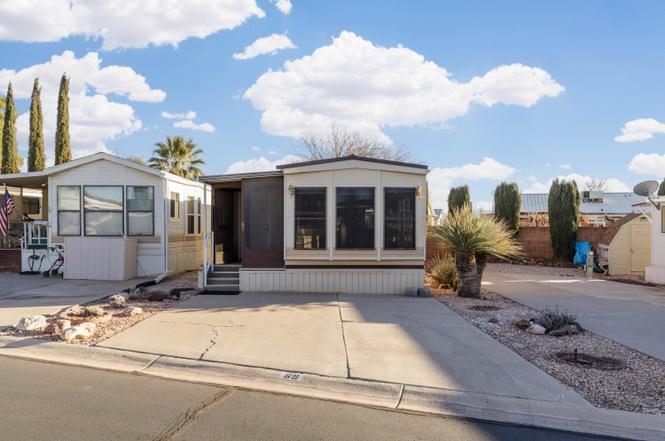
1225 N Dixie Downs Rd #69 · St. George, UT
Flood risk 1/10 · Minimal
- FEMA flood zone
- X (unshaded)
- Chance of flooding over 30 yrs
- 0.0%
- Est. flood insurance / yr
- $507 – $1,088
Fire risk 7/10 · Major
- Est. fire insurance / yr
- $453 – $841
Heat risk 6/10 · Moderate
- Hot days now (above 103°F)
- 6 days/yr
- Hot days in 30 yrs
- 16 days/yr
Wind risk 1/10 · Minimal
- Chance of severe wind over 30 yrs
- —
Air-quality risk 1/10 · Minimal
- Unhealthy air days now
- 0 days/yr
- Unhealthy air days in 30 yrs
- 0 days/yr
Risk factors via First Street. Map © Google.
Why this score? — see what drove the C grade
The composite is a weighted blend of 9 inputs, each scored 0–100. Each bar is that input's sub-score; the figure is the points it added to the 100-point composite (weight × sub-score).
- Cash flow +22.8/30.0
- ARV discount +7.5/15.0
- DSCR +7.3/10.0
- 1% rule +6.0/10.0
- Schools +3.7/10.0
- Rent growth +3.1/5.0
- Livability +2.5/5.0
- Condition / age +2.5/5.0
- Appreciation +0.0/10.0
$114,900
🖨 Deal sheet (PDF) 📄 Offer letter ✓ Due diligence
Listing remarks
Dixie Downs is the ultimate 55+ community! This park model is lovingly kept up. The addition of the den/bedroom and laundry room makes it very spacious. A simple install of a door would make this a two bedroom unit. Roof is only 3 years old and the power pedestal is 4 years old. This unit includes solar shades to keep it cool. Washer, dryer and refrigerator are all included. There is an ample storage shed that is wired with power and light in the back. The low HOA fee of $85 p/m give you access to pool, hot tub, clubhouse and more. The community is very active with many activities throughout the year. A perfect place to spend your retirement years!
Key facts
- Den bedroom
- Laundry room
- Solar shades
Tags
Property features AI
Finance
- HOA & community: Homeowners association with a clubhouse; Monthly association fee of $85 covering water and sewer
Exterior
- Parking: No designated parking
- Utilities: Sewer available; Electricity connected
- Home design: Residential mobile home; Single-story; Located in Dixie Downs RV Resort; Senior community
- Construction: Aluminum siding; Metal roof
- Exterior features: Paved road access
Interior
- Kitchen: Dishwasher; Refrigerator
- Heating & cooling: Heat pump heating; Ceiling fan(s); No central cooling
- Interior features: See remarks; 6 total rooms
- Laundry & utility: Washer; Dryer
Neighborhood map
What this means for you Summary
Snapshot
- This is a 1-bed/1.0-bath manufactured listed at $115k.
Deal economics
- At list price, monthly cash flow is $201 ($2k/yr) — positive.
- The deal already cash-flows at list — no discount required.
- Meets the 1% rule at list price ($1k rent vs $115k).
- Recommended offer: $101k (12.0% below list) — sets the bar for market timing.
Location & tenants
- Location reads: area grade C — affects rentability + tenant quality, not the cash-flow math above.
- Washington District (urban): math 42% / reading 45% proficiency, ranked #37 of 80 in UT (top 46%) — families likely to look elsewhere, expect single-tenant / working-renter base with shorter leases.
- Zoned schools: Red Mountain School (math 32% / reading 33%, grade F, #416 of 585 statewide, top 71%, 434 students, 59% FRL); Lava Ridge Intermediate (math 43% / reading 40%, grade F, #61 of 138 statewide, top 47%, 815 students, 42% FRL); Snow Canyon High (math 32% / reading 48%, grade F, #62 of 171 statewide, top 36%, 1,266 students, 30% FRL).
- Market conditions: Rents rising (+2.4%/yr); 779 active listings in the ZIP; 1 comparable units currently listed for rent nearby; 3,140 units permitted in Washington County in 2024 (650 in 5+ unit buildings).
Forward outlook
- Local home prices are declining (-3.0%/yr); year-one equity from $794 of loan paydown is wiped out by about $3k of value loss. Plan a longer hold.
- Washington County population projected at +44% by 2050 — long-run rental-demand tailwind backs the buy-and-hold thesis.
Negotiation context
- It's been on market 268 days — a 12% lower offer ($101k) is reasonable based on typical stale-listing flexibility.
- 2 sale attempts; this cycle's ask has dropped $11k (9%) from the opening price — seller is motivated, your offer sets the floor, not the list.
Risks & watch-outs
- Climate carrying-cost: major wildfire risk; extreme-heat days projected 6→16/yr by 2055 (HVAC capex compounding) — expect insurance premiums to compound above CPI over the hold.
Questions for the listing agent
- It's been on market 268 days. Have you received any prior offers? Is the seller open to a 12% concession, seller financing, or rate buy-down credit?
- What does the HOA fee cover, when was the last increase, and are there any pending special assessments or reserve-fund shortfalls?
- Why hasn't it sold? Are there any deal-killer items the seller is aware of (foundation, flood, title, zoning, code violations)?
- Is there a deadline driving the sale (1031 exchange, divorce, estate, relocation)? That informs how much negotiation room exists.
- What's the average days-on-market for RENTAL listings here right now (not sales)? A rising rental-DOM trend means longer vacancies and softer asking-rent achievability than the comps imply.
- What's the recent tenant-quality profile in this submarket — average credit score on applications, eviction rate, late-payment / NSF rate, and stable-employment percentage? A property-management company in the area should have these aggregated.
- How much new for-sale + rental construction is in the pipeline within 1–3 miles? Heavy new supply typically softens prices + rents 12–24 months out; constrained supply supports both.
Investment metrics
- 1% rule
- 1.10% ✓
- Cap rate
- 8.39%
- Cash-on-cash
- 7.49%
- DSCR
- 1.33
- GRM
- 7.6
CMA / ARV
No comps found within radius.
Projected returns pro-forma
-3.0% appreciation · 2.42% rent growth · sell at horizon
- IRR
- -5.5%
- Equity multiple
- 0.80×
- Total profit
- $-6,549
- Equity at exit
- $17,132
- IRR
- 3.5%
- Equity multiple
- 1.24×
- Total profit
- $7,869
- Equity at exit
- $9,934
Cash invested: $32,172 (down + closing). Projections, not guarantees.
Landlord ↔ Tenant lean methodology
- Overall (STATE)
- 86 Strongly Landlord-Friendly
- State Utah
- 86 Strongly Landlord-Friendly · R+15
- County
- — inherits STATE
- City
- — inherits STATE
ZIP-level market 84770
- Rents YoY
- 2.4%
- Active inventory
- 779
- Price-to-rent
- 7.6×
Monthly cashflow live
- Estimated rent
- $1,262 medium interval (Pro) →
- Mortgage (P&I)
- −$603
- Tax from tax record
- −$61 /mo · $730/yr
- Insurance
- −$48
- HOA
- −$85
- Vacancy / Maint / Mgmt
- −$265
- Net cashflow
- $201
Break-even live
Sensitivity live
| Price | -10% $266 | -5% $233 | +0% $201 | +5% $168 | +10% $136 |
|---|---|---|---|---|---|
| Rent | -10% $101 | -5% $151 | +0% $201 | +5% $251 | +10% $300 |
| Rate | -1.0pp $259 | -0.5pp $230 | base $201 | +0.5pp $171 | +1.0pp $141 |
UW: 25.0% down · 7.5% · 30yr · 1.5% tax · 5.0% vac · 8.0% maint · 8.0% mgmt
Financing live
Cash to close
- Down payment
- $28,725
- Closing costs
- $3,447
- Reserves months
- —
- Total cash needed
- —
Loan-product check · same deal, 3 products live
Conventional
25% down · 7.5% · 30yr
- Down + closing
- —
- Monthly P&I
- —
- Monthly cashflow
- —
- DSCR
- —
- Eligible?
- —
Personal DTI + credit; lowest rate.
DSCR
20% down · 8.5% · 30yr
- Down + closing
- —
- Monthly P&I
- —
- Monthly cashflow
- —
- DSCR
- —
- Eligible?
- —
No personal income docs; deal must DSCR.
Hard money
10% down · 12.0% · 12mo
- Down + closing
- —
- Monthly P&I
- —
- Monthly cashflow
- —
- DSCR
- —
- Eligible?
- —
Short-term bridge; refi at stabilization.
Rent comps 1 comps
| Address | Beds | Baths | Sqft | Rent | $/sqft | DOM | Units | Dist |
|---|---|---|---|---|---|---|---|---|
| 1503 N 2100 W Saint George, UT | 1.0–2.0 | 1.0 | 693 | $1,264 | $1.82 | 15d | 5 | 0.37mi |
HOA detail
- Monthly dues
- $85 · $1,020/yr
- Likely covers
- pool
Listing history 24 events
-
2026-06-22days on market $114,900 Active 268 DOM
-
2026-06-19days on market $114,900 Active 266 DOM
-
2026-06-18days on market $114,900 Active 265 DOM
-
2026-06-17days on market $114,900 Active 264 DOM
-
2026-06-16days on market $114,900 Active 263 DOM
-
2026-06-15days on market $114,900 Active 262 DOM
-
2026-06-14days on market $114,900 Active 260 DOM
-
2026-06-13days on market $114,900 Active 259 DOM
-
2026-06-10days on market $114,900 Active 257 DOM
-
2026-06-09days on market $114,900 Active 256 DOM
-
2026-06-08days on market $114,900 Active 255 DOM
-
2026-06-07days on market $114,900 Active 254 DOM
-
2026-06-05days on market $114,900 Active 251 DOM
-
2026-06-02days on market $114,900 Active 249 DOM
-
2026-06-01days on market $114,900 Active 248 DOM
-
2026-05-31days on market $114,900 Active 247 DOM
-
2026-05-30days on market $114,900 Active 246 DOM
-
2026-05-11price $114,900
-
2026-05-09status Active
-
2026-04-29status Pending
-
2026-02-13price $115,000
-
2026-01-02price $125,800
-
2025-09-16$125,900 Active
-
2004-01-26soldstatus
ⓘ Source: listings_history table (triggers on properties + properties_extension) + one-shot
backfill from property_details.listing_events for pre-trigger history.
Tax reassessment forecast UT · Resets to sale price
- Current annual tax
- $730 · $61/mo
- Projected year-2 tax
- $758 · $63/mo
- Expected delta
- +$29/yr (+$2/mo · 4.0%)
ⓘ Screening estimate from a state-policy table — verify with the county assessor before closing.
Climate risk First Street
- Flood 1/10 Low FEMA zone X (unshaded) · 0% chance over 30 yrs
- Wildfire 7/10 Severe
- Heat 6/10 Major 6 d/yr ≥103°F today · 16 d/yr by 30 yrs out
- Wind 1/10 Low
- Air quality 1/10 Low 0 unhealthy d/yr today · 0 by 30 yrs out
Nearby sold comps map
Loading sold comps map…
Walkable amenities ~0.75 mi
Loading nearby amenities…
Taxation est. · year 1
- Rental income
- $15,143
- − Mortgage interest
- −$6,436
- − Property taxes
- −$730
- − Insurance
- −$574
- − Repairs & maintenance
- −$1,211
- − Management
- −$1,211
- − HOA
- −$1,020
- − Depreciation
- −$3,343
- Taxable income
- $617
- Est. tax owed @ 24.0%
- −$148
- After-tax cash flow
- $2,260/yr
For passive investors: Depreciation is non-cash, so a rental often shows a tax loss while cash-flowing — sheltering income. Rental losses are passive: they offset passive income freely, and up to $25,000/yr can offset ordinary (W-2) income if you actively participate and your MAGI is under $100k (phasing out to $0 by $150k); unused losses carry forward. On sale, claimed depreciation is recaptured at up to 25%, and gains may owe capital-gains tax (a 1031 exchange can defer both). Figures are a year-1 estimate at your 24.0% rate — not tax advice; consult a CPA.
Schools (NCES district)
- District
- Washington District
- NCES district ID
- 4901140
- Math proficiency
- 42% ▼ -3.00%
- Reading proficiency
- 45% ▼ -3.00%
- Median HH income
- $50,861
- Composite
- 37.47/100
- National rank
- #4408
- State rank
- #37 of 80 in UT
Livability — St. George
No livability data for this city. (Only ~50 U.S. cities are tracked.)
Census & demographics
- Census place
- St. George, UT
- County
- Washington County · 179,216 people
- City population
- 101,579
- Metro
- St. George, UT
- Population (ZIP)
- 48,397
- Household income
- $70,024
- Rent vs Own
- Severe rent burden
- 1605.0
Population outlook (Washington County) Hauer SSP2
- Today (2025)
- 193,324 people
- By 2030
- 211,699 · +9.5%
- By 2040
- 246,449 · +27.5%
- By 2050
- 278,447 · +44.0%
- By 2075
- 342,734 · +77.3%
- By 2100
- 382,815 · +98.0%
Race, ethnicity, and origin ACS 2023
- Neighborhood character
- Predominantly White (79%)
- Race & ethnicity
- White 79% Hispanic / Latino 15% Two or more races 6% Native American 1% Asian 1%
- Hispanic origin (detail)
- Mexican 10%
- Common ancestry
- Italian 8% Slovak 4% Scottish 2%
- Foreign-born
- 8% · Canada, Vietnam
- Languages at home
- 86% English-only · Spanish 11% Other Indo-European 1% Vietnamese 1%
Political lean MEDSL · Washington
- 2024 margin
- Solid R (+52.3) · D 23.0% · R 75.2% · Other 1.8%
- 2008→2024 swing
- +1.2pp toward D · 2008: -53.5pp · 2024: -52.3pp
- All cycles
- 2024: R+52.3 2020: R+51.7 2016: R+52.1 2012: R+67.0 2008: R+53.5
Not yet ingested
- Civics
- —
Market trends
- HPI YoY
- ▼ -356.86%
- Current HPI
- 234.9418
- Rent YoY
- ▲ 2.42%
- Metro
- St. George, UT
- State GDP YoY
- ▲ 3.54%
- F500 in state
- 2
Industry mix (Fortune 500 HQ in UT)
| Industry | F500 HQs | Revenue |
|---|---|---|
| Financial Services | 1 | $3B |
|
||
Price history
-8.7% since first listed7 events — show timeline
- 2026-05-11 Price Changed $114,900 WCBOR
- 2026-05-09 Relisted — WCBOR
- 2026-04-29 Pending — WCBOR
- 2026-02-13 Price Changed $115,000 WCBOR
- 2026-01-02 Price Changed $125,800 WCBOR
- 2025-09-16 Listed $125,900 WCBOR
- 2004-01-26 Sold (Public Records) — Public Records
Property tax history
+6.6%/yrLatest (2025): $730 · -6.1% YoY. Source: county tax records.
Cash-flow waterfall
monthlySold comps — $/sqft
last 12 mo · ≤1 miLoading sold comps…