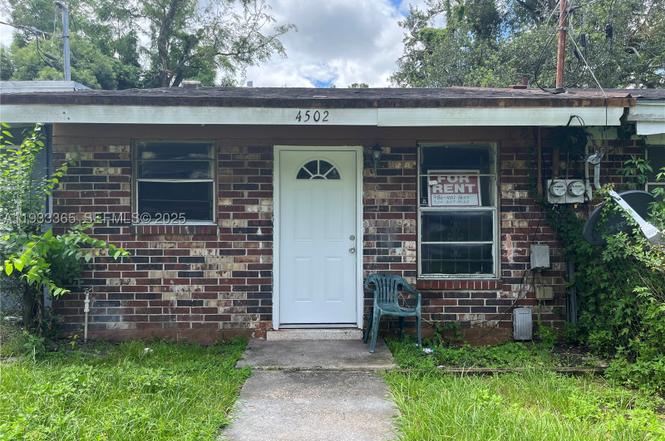
4502 Friden Dr Jacksonville · Jacksonville, FL
Flood risk 6/10 · Moderate
- FEMA flood zone
- X (unshaded)
- Chance of flooding over 30 yrs
- 0.56%
- Est. flood insurance / yr
- $507 – $1,088
Fire risk 2/10 · Minimal
- Est. fire insurance / yr
- $947 – $1,759
Heat risk 9/10 · Severe
- Hot days now (above 107°F)
- 7 days/yr
- Hot days in 30 yrs
- 20 days/yr
Wind risk 9/10 · Severe
- Chance of severe wind over 30 yrs
- 99.0%
Air-quality risk 4/10 · Minor
- Unhealthy air days now
- 6 days/yr
- Unhealthy air days in 30 yrs
- 6 days/yr
Risk factors via First Street. Map © Google.
Why this score? — see what drove the C grade
The composite is a weighted blend of 9 inputs, each scored 0–100. Each bar is that input's sub-score; the figure is the points it added to the 100-point composite (weight × sub-score).
- Cash flow +21.8/30.0
- ARV discount +7.5/15.0
- DSCR +7.0/10.0
- 1% rule +5.5/10.0
- Livability +4.2/5.0
- Schools +3.9/10.0
- Rent growth +3.0/5.0
- Condition / age +2.5/5.0
- Appreciation +0.0/10.0
$79,900
🖨 Deal sheet 📄 Offer letter ✓ Due diligence
Listing remarks
INVESTORS OPPORTUNITY!!! 2Bed 1Bath Great rental property 2 BED 1 BATH single family home- townhouse. Currently rented until January 2027 for $650 monthly. NO restrictions, NO HOA. Taxes $1100. Plenty of parking space, front yard and patio on the back. Laundry inside of premises. NEW ROOF MAY 2023.
Key facts
- Single family home
- Front yard
- Patio
Tags
Property features AI
Finance
- Other: No pet restrictions (pets allowed)
- HOA & community: Laundry facilities (community); Lease considered
Exterior
- Parking: Detached carport; Driveway; 2 covered parking spaces; 2-car carport
- Utilities: Public water; Public sewer; Cable available
- Home design: Single-story; Faces south; Residential zoning
- Construction: Block construction; Shingle roof; Effective year built
- Exterior features: Fenced yard; Patio
Interior
- Kitchen: Electric range; Refrigerator
- Bedrooms: Bedroom on main level
- Flooring: Terrazzo flooring
- Bathrooms: 1 full bathroom
- Heating & cooling: Central heating; Central air conditioning
- Interior features: First-floor entry; Living/dining room; Bedroom on main level; Unfurnished
- Laundry & utility: Laundry facilities (community)
Neighborhood map
What this means for you Summary
Snapshot
- This is a 2-bed/1.0-bath single-family listed at $80k.
Deal economics
- At list price, monthly cash flow is $124 ($1k/yr) — positive.
- The deal already cash-flows at list — no discount required.
- Meets the 1% rule at list price ($840 rent vs $80k).
- Recommended offer: $70k (12.0% below list) — sets the bar for market timing.
- Cap rate 8.2% vs local median 4.0% in Jacksonville — top-decile yield for the area; either an underpriced asset or a hidden risk that comps aren't pricing in. Stress-test before assuming the spread holds.
Location & tenants
- Location reads 83/100 on livability (#50 in FL, #911 nationally) — a professional / high-income tenant draw. Strengths: amenities A+, commute A+, housing A+.
- Duval (urban): math 46% / reading 45% proficiency, ranked #48 of 73 in FL (top 66%) — families likely to look elsewhere, expect single-tenant / working-renter base with shorter leases.
- Market conditions: Rents rising (+1.8%/yr); 394 active listings in the ZIP; 5 comparable units currently listed for rent nearby; rentals at typical pace (median 15d on market — plan ~3-4 weeks tenant-placement turnaround); lower-income renter base — watch delinquency; 6,503 units permitted in Duval County in 2024 (1,131 in 5+ unit buildings).
- This rent runs 33% of the median local income ($31k/yr) — at the standard rent-burdened threshold; future hikes will face affordability resistance.
Forward outlook
- Local home prices are declining (-3.0%/yr); year-one equity from $552 of loan paydown is wiped out by about $2k of value loss. Plan a longer hold.
- Duval County population projected at +19% by 2050 — long-run rental-demand tailwind backs the buy-and-hold thesis.
Negotiation context
- It's been on market 181 days — a 12% lower offer ($70k) is reasonable based on typical stale-listing flexibility.
- 8 sale attempts since 14y ago with the ask held roughly flat each time — persistent listings suggest the price (not the market) is what's stuck; bring a comps-based counter.
- Current owner paid $44k; list at $80k implies a 82% gain — meaningful room to come down on a strong offer.
Risks & watch-outs
- Climate carrying-cost: major flood risk; severe wind risk, 99% chance of damaging wind over 30y; extreme-heat days projected 7→20/yr by 2055 (HVAC capex compounding) — expect insurance premiums to compound above CPI over the hold.
Questions for the listing agent
- It's been on market 181 days. Have you received any prior offers? Is the seller open to a 12% concession, seller financing, or rate buy-down credit?
- Built in 1965 — when were the roof, HVAC, electrical panel, plumbing, and water heater last replaced?
- Why hasn't it sold? Are there any deal-killer items the seller is aware of (foundation, flood, title, zoning, code violations)?
- Is there a deadline driving the sale (1031 exchange, divorce, estate, relocation)? That informs how much negotiation room exists.
- Schools are B-rated — typically a magnet for longer-tenancy family renters. What's the average tenant stay here, and is there a school-zone premium baked into asking?
- What's the average days-on-market for RENTAL listings here right now (not sales)? A rising rental-DOM trend means longer vacancies and softer asking-rent achievability than the comps imply.
- What's the recent tenant-quality profile in this submarket — average credit score on applications, eviction rate, late-payment / NSF rate, and stable-employment percentage? A property-management company in the area should have these aggregated.
- How much new for-sale + rental construction is in the pipeline within 1–3 miles? Heavy new supply typically softens prices + rents 12–24 months out; constrained supply supports both.
Investment metrics
- 1% rule
- 1.05% ✓
- Cap rate
- 8.15%
- Cash-on-cash
- 6.64%
- DSCR
- 1.30
- GRM
- 7.9
CMA / ARV
- ARV (on-the-fly)
- $51,832
- Comps found
- 4
Show comp detail 4 sales within ~0.75 mi
| Address | Dist | Beds/Ba | Sqft | Sold | Price | $/sf | Match |
|---|---|---|---|---|---|---|---|
| 4622 Wrico Dr | 0.14mi | 2/1.0 | 682 (0%) | 4mo | $40,000 | $59 | 90 |
| 4442 Friden Dr | 0.02mi | 2/1.0 | 682 (0%) | 11mo | $62,000 | $91 | 90 |
| 4440 Friden Dr | 0.02mi | 2/1.0 | 646 (-5%) | 3mo | $40,000 | $62 | 88 |
| 4612 Wrico Dr | 0.13mi | 2/1.0 | 688 (+1%) | 21mo | $52,000 | $76 | 75 |
Match score weights: distance 35% · size 25% · config 20% · recency 20%. Top-matched comps best support the ARV.
Projected returns pro-forma
-3.0% appreciation · 1.81% rent growth · sell at horizon
- IRR
- -7.4%
- Equity multiple
- 0.73×
- Total profit
- $-6,054
- Equity at exit
- $11,913
- IRR
- 0.6%
- Equity multiple
- 1.04×
- Total profit
- $916
- Equity at exit
- $6,908
Cash invested: $22,372 (down + closing). Projections, not guarantees.
Landlord ↔ Tenant lean methodology
- Overall (STATE)
- 87 Strongly Landlord-Friendly
- State Florida
- 87 Strongly Landlord-Friendly · R+3
- County
- — inherits STATE
- City
- — inherits STATE
ZIP-level market 32209
- Home prices YoY
- -22.1%
- Rents YoY
- 1.8%
- Active inventory
- 394
- Price-to-rent
- 7.9×
Monthly cashflow live
- Estimated rent
- $840 high interval (Pro) →
- Mortgage (P&I)
- −$419
- Tax from tax record
- −$87 /mo · $1,047/yr
- Insurance
- −$33
- HOA
- −$0
- Vacancy / Maint / Mgmt
- −$176
- Net cashflow
- $124
Break-even live
UW: 25.0% down · 7.5% · 30yr · 1.5% tax · 5.0% vac · 8.0% maint · 8.0% mgmt
Financing live
Cash to close
- Down payment
- $19,975
- Closing costs
- $2,397
- Reserves months
- —
- Total cash needed
- —
Loan-product check · same deal, 3 products live
Conventional
25% down · 7.5% · 30yr
- Down + closing
- —
- Monthly P&I
- —
- Monthly cashflow
- —
- DSCR
- —
- Eligible?
- —
Personal DTI + credit; lowest rate.
DSCR
20% down · 8.5% · 30yr
- Down + closing
- —
- Monthly P&I
- —
- Monthly cashflow
- —
- DSCR
- —
- Eligible?
- —
No personal income docs; deal must DSCR.
Hard money
10% down · 12.0% · 12mo
- Down + closing
- —
- Monthly P&I
- —
- Monthly cashflow
- —
- DSCR
- —
- Eligible?
- —
Short-term bridge; refi at stabilization.
Rent comps 5 comps
| Address | Beds | Baths | Sqft | Rent | $/sqft | DOM | Units | Dist |
|---|---|---|---|---|---|---|---|---|
| 4440 Ken Knight Dr N Jacksonville, FL | 2.0 | 1.0 | 716 | $650 | $0.91 | 14d | 1 | 0.18mi |
| 4655 Ken Knight Dr N Jacksonville, FL | 2.0 | 1.0 | 646 | $600 | $0.93 | 23d | 1 | 0.21mi |
| 4848 Mississippi Ct Jacksonville, FL | 1.0 | 1.0 | 400 | $850 | $2.12 | 4d | 1 | 0.37mi |
| 2185 Benedict Rd Jacksonville, FL | 2.0 | 1.0 | 630 | $995 | $1.58 | 23d | 1 | 1.38mi |
| 2185 Benedict Rd Unit 2187 Jacksonville, FL | 2.0 | 1.0 | 630 | $995 | $1.58 | 10d | 1 | 1.38mi |
Listing history 32 events
-
2026-06-18days on market $79,900 Active 181 DOM
-
2026-06-17days on market $79,900 Active 180 DOM
-
2026-06-16days on market $79,900 Active 179 DOM
-
2026-06-15days on market $79,900 Active 178 DOM
-
2026-06-10days on market $79,900 Active 172 DOM
-
2026-06-08days on market $79,900 Active 171 DOM
-
2026-06-08days on market $79,900 Active 170 DOM
-
2026-06-03days on market $79,900 Active 166 DOM
-
2026-06-02days on market $79,900 Active 165 DOM
-
2026-06-01days on market $79,900 Active 164 DOM
-
2026-05-31days on market $79,900 Active 163 DOM
-
2025-12-19$79,900 Active
-
2025-01-10historical
-
2024-09-28historical $700
-
2024-08-22$700
-
2024-07-30historical $700
-
2024-07-19$700
-
2024-03-26price $99,000
-
2024-02-27historical $799
-
2024-02-22price $799
-
2024-02-15price $825
-
2024-02-13$850
-
2024-01-10historical $850
-
2024-01-10$89,900 Active
-
2024-01-09$850
-
2023-12-30historical
-
2023-07-25$89,900 Active
-
2012-02-15historical
-
2012-02-13$4,500
-
2006-07-13soldstatus $44,000
-
1991-09-01soldstatus $10,600
-
1984-07-01soldstatus $9,600
ⓘ Source: listings_history table (triggers on properties + properties_extension) + one-shot
backfill from property_details.listing_events for pre-trigger history.
Tax reassessment forecast FL · Resets to sale price
- Current annual tax
- $1,047 · $87/mo
- Projected year-2 tax
- $1,047 · $87/mo
- Expected delta
- $0/yr ($0/mo · 0.0%)
ⓘ Screening estimate from a state-policy table — verify with the county assessor before closing.
Climate risk First Street
- Flood 6/10 Major FEMA zone X (unshaded) · 56% chance over 30 yrs
- Wildfire 2/10 Low
- Heat 9/10 Extreme 7 d/yr ≥107°F today · 20 d/yr by 30 yrs out
- Wind 9/10 Extreme 99% chance of damaging wind over 30 yrs
- Air quality 4/10 Moderate 6 unhealthy d/yr today · 6 by 30 yrs out
Nearby sold comps map
Loading sold comps map…
Walkable amenities ~0.75 mi
Loading nearby amenities…
Taxation est. · year 1
- Rental income
- $10,076
- − Mortgage interest
- −$4,476
- − Property taxes
- −$1,047
- − Insurance
- −$400
- − Repairs & maintenance
- −$806
- − Management
- −$806
- − Depreciation
- −$2,324
- Taxable income
- $217
- Est. tax owed @ 24.0%
- −$52
- After-tax cash flow
- $1,433/yr
For passive investors: Depreciation is non-cash, so a rental often shows a tax loss while cash-flowing — sheltering income. Rental losses are passive: they offset passive income freely, and up to $25,000/yr can offset ordinary (W-2) income if you actively participate and your MAGI is under $100k (phasing out to $0 by $150k); unused losses carry forward. On sale, claimed depreciation is recaptured at up to 25%, and gains may owe capital-gains tax (a 1031 exchange can defer both). Figures are a year-1 estimate at your 24.0% rate — not tax advice; consult a CPA.
Schools (NCES district)
- District
- Duval
- NCES district ID
- 1200480
- Math proficiency
- 46% ▼ -11.00%
- Reading proficiency
- 45% ▼ -4.00%
- Median HH income
- $48,987
- Composite
- 38.97/100
- National rank
- #4076
- State rank
- #48 of 73 in FL
Livability — Jacksonville
- Score
- 83/100
- State rank
- #50
- US rank
- #911
Category grades
Schools grade is shown separately in the Schools card above.
Census & demographics
- Census place
- Jacksonville, FL
- County
- Duval County · 1,015,274 people
- City population
- 979,034
- Metro
- Jacksonville, FL
- Population (ZIP)
- 34,657
- Household income
- $30,514
- Rent vs Own
- Severe rent burden
- 2921.0
Population outlook (Duval County) Hauer SSP2
- Today (2025)
- 1,013,010 people
- By 2030
- 1,059,228 · +4.6%
- By 2040
- 1,141,439 · +12.7%
- By 2050
- 1,205,258 · +19.0%
- By 2075
- 1,324,282 · +30.7%
- By 2100
- 1,319,620 · +30.3%
Race, ethnicity, and origin ACS 2023
- Neighborhood character
- Predominantly Black (88%)
- Race & ethnicity
- Black 88% White 5% Hispanic / Latino 5% Two or more races 2%
- Hispanic origin (detail)
- Puerto Rican 3%
- Common ancestry
- Hispanic 1% Romanian 1%
- Foreign-born
- 3% · Canada
- Languages at home
- 95% English-only · Spanish 4% French/Haitian/Cajun 1%
Political lean MEDSL · Duval
- 2024 margin
- Toss-up / Even · D 48.7% · R 50.1% · Other 1.2%
- 2008→2024 swing
- +0.4pp no change · 2008: -1.9pp · 2024: -1.5pp
- All cycles
- 2024: R+1.5 2020: D+3.8 2016: R+1.5 2012: R+3.6 2008: R+1.9
Not yet ingested
- Civics
- —
Market trends
- HPI YoY
- ▼ -53.92%
- Current HPI
- 189.5977
- Rent YoY
- ▲ 1.81%
- Metro
- Jacksonville, FL
- State GDP YoY
- ▲ 3.28%
- F500 in state
- 36
Industry mix (Fortune 500 HQ in FL)
| Industry | F500 HQs | Revenue |
|---|---|---|
| Industrial Technology | 2 | $29B |
|
||
| Insurance | 2 | $17B |
|
||
| Retail | 1 | $60B |
|
||
| Technology Distribution | 1 | $58B |
|
||
| Homebuilding | 1 | $35B |
|
||
| Technology Manufacturing | 1 | $35B |
|
||
Price history
+732.3% since first listed21 events — show timeline
- 2025-12-19 Listed $79,900 MARMLS
- 2025-01-10 Listing Removed — MARMLS
- 2024-09-28 Rental Removed $700 MARMLS
- 2024-08-22 Listed for Rent $700 MARMLS
- 2024-07-30 Rental Removed $700 MARMLS
- 2024-07-19 Listed for Rent $700 MARMLS
- 2024-03-26 Price Changed $99,000 MARMLS
- 2024-02-27 Rental Removed $799 BUILDIUM
- 2024-02-22 Price Changed $799 BUILDIUM
- 2024-02-15 Price Changed $825 BUILDIUM
- 2024-02-13 Listed for Rent $850 BUILDIUM
- 2024-01-10 Rental Removed $850 NEFLMLS
- 2024-01-10 Listed $89,900 MARMLS
- 2024-01-09 Listed for Rent $850 NEFLMLS
- 2023-12-30 Listing Removed — MARMLS
- 2023-07-25 Listed $89,900 MARMLS
- 2012-02-15 Listing Removed — realMLS
- 2012-02-13 Listed $4,500 realMLS
- 2006-07-13 Sold (Public Records) $44,000 Public Records
- 1991-09-01 Sold (Public Records) $10,600 Public Records
- 1984-07-01 Sold (Public Records) $9,600 Public Records
Property tax history
+12.3%/yrLatest (2025): $1,047 · +26.0% YoY. Source: county tax records.
Cash-flow waterfall
monthlySold comps — $/sqft
last 12 mo · ≤1 miLoading sold comps…