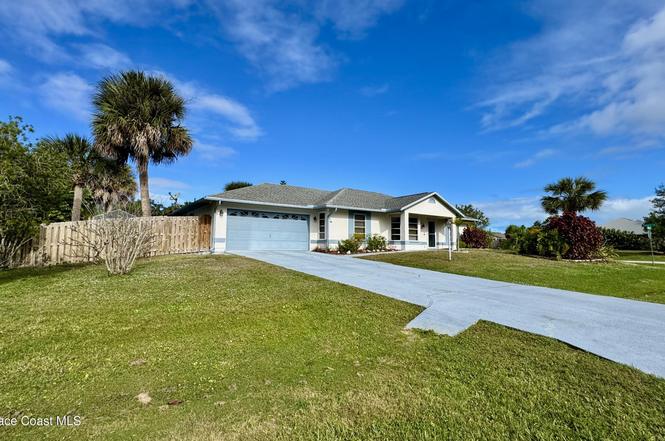
175 Chaloupe Ter · Sebastian, FL
Flood risk 1/10 · Minimal
- FEMA flood zone
- X (unshaded)
- Chance of flooding over 30 yrs
- 0.0%
- Est. flood insurance / yr
- $507 – $1,088
Fire risk 3/10 · Minor
- Est. fire insurance / yr
- $947 – $1,759
Heat risk 10/10 · Severe
- Hot days now (above 106°F)
- 7 days/yr
- Hot days in 30 yrs
- 24 days/yr
Wind risk 10/10 · Severe
- Chance of severe wind over 30 yrs
- 99.0%
Air-quality risk 1/10 · Minimal
- Unhealthy air days now
- 0 days/yr
- Unhealthy air days in 30 yrs
- 0 days/yr
Risk factors via First Street. Map © Google.
Why this score? — see what drove the D grade
The composite is a weighted blend of 9 inputs, each scored 0–100. Each bar is that input's sub-score; the figure is the points it added to the 100-point composite (weight × sub-score).
- Cash flow +11.9/30.0
- ARV discount +9.5/15.0
- Schools +4.2/10.0
- Rent growth +4.1/5.0
- Livability +4.0/5.0
- DSCR +3.5/10.0
- Condition / age +2.5/5.0
- 1% rule +2.2/10.0
- Appreciation +0.0/10.0
$349,000
🖨 Deal sheet 📄 Offer letter ✓ Due diligence
Listing remarks MLS
ADORABLE HOME ON OVERSIZED CORNER LOT WITH FENCED YARD. HUGE LIVING ROOM & DINING ROOM W/ BUTLER''S PANTRY. LARGE KITCHEN & BIG UTILITY ROOM W/ ACCESS TO BACK YARD.
Key facts
- 0.29 acre lot
- 2 garage spots
- Built 1991
Property features AI
Exterior
- Parking: Garage (2 spaces)
- Utilities: Public sewer; Water connected
- Home design: Single-family residence; Frame and stucco construction
- Construction: Frame and stucco construction
- Exterior features: Corner lot; Faces southeast
Interior
- Bedrooms: 3 bedrooms
- Bathrooms: 2 full bathrooms
- Heating & cooling: Central electric heating; Central electric air conditioning
- Interior features: Unfurnished
Neighborhood map
What this means for you Summary
Snapshot
- This is a 3-bed/2.0-bath single-family listed at $349k.
Deal economics
- At list price, monthly cash flow is $-91 ($-1k/yr) — negative.
- To cash-flow at today's rent, offer at most $333k (4.6% below list).
- To meet the 1% rule (rent ≥ 1% of price), the offer needs to be $252k (27.9% below list).
- Recommended offer: $252k (27.9% below list) — sets the bar for 1% rule.
- Cap rate 6.0% vs local median 4.4% in Sebastian — top-decile yield for the area; either an underpriced asset or a hidden risk that comps aren't pricing in. Stress-test before assuming the spread holds.
Location & tenants
- Location reads 81/100 on livability (#89 in FL, #1,421 nationally) — a professional / high-income tenant draw. Strengths: housing A+, crime A, health & safety A; Watch: schools D+, amenities D-.
- Indian River (other): math 48% / reading 52% proficiency, ranked #35 of 73 in FL (top 48%) — acceptable for families but not a draw, mixed tenant base, ~2y average lease.
- Market conditions: Rents rising fast (+6.2%/yr); 412 active listings in the ZIP; 21 comparable units currently listed for rent nearby; rentals leasing fast (median 13d on market — plan ~1-2 weeks tenant-placement turnaround); 564 units permitted in Indian River County in 2024 (281 in 5+ unit buildings).
- At $2,518/mo this rent would consume 45% of the median local household income ($67k/yr) (locally 646% of renters already pay >50% of income on rent) — very limited rent-growth headroom before tenants either downsize or default.
Forward outlook
- Local home prices are declining (-3.0%/yr); year-one equity from $2k of loan paydown is wiped out by about $10k of value loss. Plan a longer hold.
- Indian River County population projected at +18% by 2050 — long-run rental-demand tailwind backs the buy-and-hold thesis.
Negotiation context
- It's been on market 125 days — a 12% lower offer ($307k) is reasonable based on typical stale-listing flexibility.
- 4 sale attempts since 16y ago with the ask held roughly flat each time — persistent listings suggest the price (not the market) is what's stuck; bring a comps-based counter.
- Current owner paid $110k; list at $349k implies a 217% gain — meaningful room to come down on a strong offer.
Risks & watch-outs
- Climate carrying-cost: severe wind risk, 99% chance of damaging wind over 30y; extreme-heat days projected 7→24/yr by 2055 (HVAC capex compounding) — expect insurance premiums to compound above CPI over the hold.
Questions for the listing agent
- What do current leases actually rent for vs. the listed asking? Can we see a recent rent roll and the last 12 months of T-12 income?
- It's been on market 125 days. Have you received any prior offers? Is the seller open to a 28% concession, seller financing, or rate buy-down credit?
- Why hasn't it sold? Are there any deal-killer items the seller is aware of (foundation, flood, title, zoning, code violations)?
- Is there a deadline driving the sale (1031 exchange, divorce, estate, relocation)? That informs how much negotiation room exists.
- Schools are D-rated, which usually means shorter tenancies and higher turnover. Who's the typical renter profile here, and what's been the actual vacancy rate?
- The area grade is low — what's the realistic commute time and amenity access for the typical tenant pool here? Any planned neighborhood developments (good or bad) we should know about?
- What's the average days-on-market for RENTAL listings here right now (not sales)? A rising rental-DOM trend means longer vacancies and softer asking-rent achievability than the comps imply.
- What's the recent tenant-quality profile in this submarket — average credit score on applications, eviction rate, late-payment / NSF rate, and stable-employment percentage? A property-management company in the area should have these aggregated.
- How much new for-sale + rental construction is in the pipeline within 1–3 miles? Heavy new supply typically softens prices + rents 12–24 months out; constrained supply supports both.
Investment metrics
- 1% rule
- 0.72% ✗
- Cap rate
- 5.98%
- Cash-on-cash
- -1.11%
- DSCR
- 0.95
- GRM
- 11.6
CMA / ARV
- ARV (on-the-fly)
- $365,330
- Comps found
- 12
Show comp detail 12 sales within ~0.75 mi
| Address | Dist | Beds/Ba | Sqft | Sold | Price | $/sf | Match |
|---|---|---|---|---|---|---|---|
| 189 Abeto Ter | 0.30mi | 3/2.0 | 1,508 (-2%) | 3mo | $343,500 | $228 | 81 |
| 137 Concha Dr | 0.15mi | 2/2.0 (-1) | 1,470 (-4%) | 2mo | $349,900 | $238 | 80 |
| 180 Concha Dr | 0.20mi | 2/2.0 (-1) | 1,596 (+4%) | 1mo | $325,000 | $204 | 78 |
| 101 Joy Haven Dr | 0.34mi | 3/2.0 | 1,650 (+8%) | 1mo | $405,000 | $245 | 70 |
| 318 Brookedge Ter | 0.33mi | 3/2.0 | 1,410 (-8%) | 3mo | $365,000 | $259 | 69 |
| 491 Carnival Ter | 0.38mi | 3/2.0 | 1,348 (-12%) | 2mo | $357,000 | $265 | 60 |
| 1670 Barber St | 0.46mi | 3/2.0 | 1,372 (-11%) | 2mo | $385,000 | $281 | 59 |
| 1532 Eastlake Ln | 0.21mi | 4/2.0 (+1) | 1,754 (+14%) | 3mo | $359,000 | $205 | 59 |
| 449 Englar Dr | 0.66mi | 3/2.0 | 1,644 (+7%) | 1mo | $560,000 | $341 | 56 |
| 1566 Dewitt Ln | 0.54mi | 3/2.0 | 1,707 (+11%) | 0mo | $380,000 | $223 | 56 |
| 1373 Haverford Ln | 0.56mi | 4/1.5 (+1) | 1,667 (+9%) | 1mo | $310,000 | $186 | 52 |
| 594 Bayharbor Ter | 0.67mi | 3/2.0 | 1,760 (+15%) | 2mo | $397,000 | $226 | 43 |
Match score weights: distance 35% · size 25% · config 20% · recency 20%. Top-matched comps best support the ARV.
Projected returns pro-forma
-3.0% appreciation · 6.22% rent growth · sell at horizon
- IRR
- -15.1%
- Equity multiple
- 0.45×
- Total profit
- $-54,074
- Equity at exit
- $52,037
- IRR
- -2.5%
- Equity multiple
- 0.81×
- Total profit
- $-18,281
- Equity at exit
- $30,175
Cash invested: $97,720 (down + closing). Projections, not guarantees.
Landlord ↔ Tenant lean methodology
- Overall (STATE)
- 87 Strongly Landlord-Friendly
- State Florida
- 87 Strongly Landlord-Friendly · R+3
- County
- — inherits STATE
- City
- — inherits STATE
ZIP-level market 32958
- Home prices YoY
- -13.1%
- Rents YoY
- 6.2%
- Active inventory
- 412
- Price-to-rent
- 11.6×
Monthly cashflow live
- Estimated rent
- $2,518 high interval (Pro) →
- Mortgage (P&I)
- −$1,830
- Tax from tax record
- −$104 /mo · $1,248/yr
- Insurance
- −$145
- HOA
- −$0
- Vacancy / Maint / Mgmt
- −$529
- Net cashflow
- $-91
Break-even live
UW: 25.0% down · 7.5% · 30yr · 1.5% tax · 5.0% vac · 8.0% maint · 8.0% mgmt
Financing live
Cash to close
- Down payment
- $87,250
- Closing costs
- $10,470
- Reserves months
- —
- Total cash needed
- —
Loan-product check · same deal, 3 products live
Conventional
25% down · 7.5% · 30yr
- Down + closing
- —
- Monthly P&I
- —
- Monthly cashflow
- —
- DSCR
- —
- Eligible?
- —
Personal DTI + credit; lowest rate.
DSCR
20% down · 8.5% · 30yr
- Down + closing
- —
- Monthly P&I
- —
- Monthly cashflow
- —
- DSCR
- —
- Eligible?
- —
No personal income docs; deal must DSCR.
Hard money
10% down · 12.0% · 12mo
- Down + closing
- —
- Monthly P&I
- —
- Monthly cashflow
- —
- DSCR
- —
- Eligible?
- —
Short-term bridge; refi at stabilization.
Rent comps 21 comps
| Address | Beds | Baths | Sqft | Rent | $/sqft | DOM | Units | Dist |
|---|---|---|---|---|---|---|---|---|
| 1421 Thornhill Ln Sebastian, FL | 3.0 | 2.0 | 1216 | $2,800 | $2.30 | 13d | 1 | 0.05mi |
| 155 Midvale Ter Sebastian, FL | 3.0 | 2.0 | 1853 | $3,000 | $1.62 | 21d | 1 | 0.25mi |
| 186 Empress Ave Unit B Sebastian, FL | 2.0 | 2.0 | 1398 | $1,575 | $1.13 | 21d | 1 | 0.59mi |
| 366 Joy Haven Dr Sebastian, FL | 3.0 | 2.0 | 1885 | $2,095 | $1.11 | 13d | 1 | 0.59mi |
| 1565 Glentry Ln Sebastian, FL | 2.0 | 2.0 | 1189 | $2,500 | $2.10 | 13d | 1 | 0.62mi |
| 1192 Croquet Ln Sebastian, FL | 4.0 | 2.0 | 2012 | $2,640 | $1.31 | 13d | 1 | 0.71mi |
| 1201 Schumann Dr Sebastian, FL | 4.0 | 2.0 | 1300 | $2,021 | $1.55 | 13d | 1 | 0.71mi |
| 113 Marsh St Sebastian, FL | 4.0 | 2.0 | 1300 | $1,856 | $1.43 | 13d | 1 | 0.72mi |
| 1836 Barber St Sebastian, FL | 4.0 | 2.0 | 1851 | $2,000 | $1.08 | 21d | 1 | 0.75mi |
| 632 Bayfront Ter Sebastian, FL | 3.0 | 2.0 | 1885 | $2,350 | $1.25 | 13d | 1 | 0.77mi |
| 1110 Barber St Sebastian, FL | 3.0 | 2.0 | 1324 | $2,200 | $1.66 | 13d | 1 | 0.87mi |
| 426 Tulip Dr Sebastian, FL | 2.0 | 2.0 | 1161 | $2,100 | $1.81 | 21d | 1 | 0.91mi |
| 151 Mabry St Sebastian, FL | 3.0 | 2.0 | 1199 | $1,850 | $1.54 | 21d | 1 | 0.97mi |
| 742 Capon Ter Sebastian, FL | 2.0 | 2.0 | 1080 | $2,000 | $1.85 | 21d | 1 | 0.98mi |
| 141 Crawford Dr Sebastian, FL | 2.0 | 1.0 | 1100 | $2,200 | $2.00 | 13d | 1 | 1.04mi |
| 1507 Ocean Cove St Sebastian, FL | 3.0 | 2.0 | 1661 | $2,100 | $1.26 | 13d | 1 | 1.11mi |
| 486 Biscayne Ln Sebastian, FL | 4.0 | 2.0 | 1769 | $2,250 | $1.27 | 13d | 1 | 1.15mi |
| 722 Carnival Ter Sebastian, FL | 3.0 | 2.0 | 1430 | $2,300 | $1.61 | 13d | 1 | 1.16mi |
| 8920 66th Ave Sebastian, FL | 4.0 | 2.0 | 1326 | $3,000 | $2.26 | 21d | 1 | 1.17mi |
| 832 Carnation Dr Sebastian, FL | 3.0 | 2.0 | 1400 | $2,800 | $2.00 | 13d | 1 | 1.33mi |
| 1343 Shoreline Cir Sebastian, FL | 3.0 | 2.0 | 2222 | $4,000 | $1.80 | 21d | 1 | 1.40mi |
Listing history 32 events
-
2026-06-19days on market $349,000 Active 125 DOM
-
2026-06-18days on market $349,000 Active 124 DOM
-
2026-06-17days on market $349,000 Active 123 DOM
-
2026-06-16days on market $349,000 Active 122 DOM
-
2026-06-15days on market $349,000 Active 121 DOM
-
2026-06-14days on market $349,000 Active 119 DOM
-
2026-06-13days on market $349,000 Active 118 DOM
-
2026-06-10days on market $349,000 Active 116 DOM
-
2026-06-09days on market $349,000 Active 115 DOM
-
2026-06-08days on market $349,000 Active 114 DOM
-
2026-06-07days on market $349,000 Active 113 DOM
-
2026-06-05days on market $349,000 Active 110 DOM
-
2026-06-02days on market $349,000 Active 108 DOM
-
2026-06-01days on market $349,000 Active 107 DOM
-
2026-05-31days on market $349,000 Active 106 DOM
-
2026-05-30days on market $349,000 Active 105 DOM
-
2026-05-12price $349,900
-
2026-05-08price $349,000
-
2026-03-23price $349,900
-
2026-03-18status Active
-
2026-01-17historical
-
2026-01-08price $349,000
-
2025-12-16$349,900 Active
-
2025-12-15historical $349,900
-
2016-08-16historical 176-char remark
Show marketing remark (176 chars)
ADORABLE HOME ON OVERSIZED CORNER LOT WITH FENCED YARD. HUGE LIVING ROOM & DINING ROOM W/ BUTLER''S PANTRY. LARGE KITCHEN & BIG UTILITY ROOM W/ ACCESS TO BACK YARD.
-
2010-07-12soldstatus $110,000
-
2010-07-08soldstatus $110,000 175-char remark
Show marketing remark (175 chars)
ADORABLE HOME ON OVERSIZED CORNER LOT WITH FENCED YARD. HUGE LIVING ROOM & DINING ROOM W/ BUTLER'S PANTRY. LARGE KITCHEN & BIG UTILITY ROOM W/ ACCESS TO BACK YARD.
-
2010-05-24historical
-
2010-05-06$114,900 176-char remark
Show marketing remark (176 chars)
ADORABLE HOME ON OVERSIZED CORNER LOT WITH FENCED YARD. HUGE LIVING ROOM & DINING ROOM W/ BUTLER''S PANTRY. LARGE KITCHEN & BIG UTILITY ROOM W/ ACCESS TO BACK YARD.
-
2010-05-06$114,900
Show marketing remark (176 chars)
ADORABLE HOME ON OVERSIZED CORNER LOT WITH FENCED YARD. HUGE LIVING ROOM & DINING ROOM W/ BUTLER''S PANTRY. LARGE KITCHEN & BIG UTILITY ROOM W/ ACCESS TO BACK YARD.
-
1998-12-09soldstatus $92,000
-
1996-06-21soldstatus $85,000
ⓘ Source: listings_history table (triggers on properties + properties_extension) + one-shot
backfill from property_details.listing_events for pre-trigger history.
Tax reassessment forecast FL · Resets to sale price
- Current annual tax
- $1,248 · $104/mo
- Projected year-2 tax
- $2,897 · $241/mo
- Expected delta
- +$1,648/yr (+$137/mo · 132.0%)
ⓘ Screening estimate from a state-policy table — verify with the county assessor before closing.
Climate risk First Street
- Flood 1/10 Low FEMA zone X (unshaded) · 0% chance over 30 yrs
- Wildfire 3/10 Moderate
- Heat 10/10 Extreme 7 d/yr ≥106°F today · 24 d/yr by 30 yrs out
- Wind 10/10 Extreme 99% chance of damaging wind over 30 yrs
- Air quality 1/10 Low 0 unhealthy d/yr today · 0 by 30 yrs out
Nearby sold comps map
Loading sold comps map…
Walkable amenities ~0.75 mi
Loading nearby amenities…
Taxation est. · year 1
- Rental income
- $30,212
- − Mortgage interest
- −$19,549
- − Property taxes
- −$1,248
- − Insurance
- −$1,745
- − Repairs & maintenance
- −$2,417
- − Management
- −$2,417
- − Depreciation
- −$10,153
- Taxable loss
- −$7,317
- Est. tax savings @ 24.0%
- +$1,756
- After-tax cash flow
- $668/yr
For passive investors: Depreciation is non-cash, so a rental often shows a tax loss while cash-flowing — sheltering income. Rental losses are passive: they offset passive income freely, and up to $25,000/yr can offset ordinary (W-2) income if you actively participate and your MAGI is under $100k (phasing out to $0 by $150k); unused losses carry forward. On sale, claimed depreciation is recaptured at up to 25%, and gains may owe capital-gains tax (a 1031 exchange can defer both). Figures are a year-1 estimate at your 24.0% rate — not tax advice; consult a CPA.
Schools (NCES district)
- District
- Indian River
- NCES district ID
- 1200930
- Math proficiency
- 48% ▼ -9.00%
- Reading proficiency
- 52% ▼ -3.00%
- Median HH income
- $46,597
- Composite
- 42.45/100
- National rank
- #3218
- State rank
- #35 of 73 in FL
Livability — Sebastian
- Score
- 81/100
- State rank
- #89
- US rank
- #1421
Category grades
Schools grade is shown separately in the Schools card above.
Census & demographics
- Census place
- Sebastian, FL
- County
- Indian River County · 143,738 people
- City population
- 30,023
- Metro
- Sebastian-Vero Beach, FL
- Population (ZIP)
- 30,023
- Household income
- $66,840
- Rent vs Own
- Severe rent burden
- 646.0
Population outlook (Indian River County) Hauer SSP2
- Today (2025)
- 165,104 people
- By 2030
- 172,869 · +4.7%
- By 2040
- 185,640 · +12.4%
- By 2050
- 194,465 · +17.8%
- By 2075
- 211,115 · +27.9%
- By 2100
- 211,781 · +28.3%
Race, ethnicity, and origin ACS 2023
- Neighborhood character
- Predominantly White (86%)
- Race & ethnicity
- White 86% Hispanic / Latino 9% Two or more races 7% Black 2% Asian 1%
- Hispanic origin (detail)
- Mexican 1% Puerto Rican 2% Cuban 3%
- Common ancestry
- Lithuanian 4% Slovak 4% Romanian 3%
- Foreign-born
- 7% · Canada, Jamaica
- Languages at home
- 91% English-only · Spanish 6% Other Indo-European 1% Russian/Polish/Slavic 1%
Political lean MEDSL · Indian River
- 2024 margin
- Strong R (+27.4) · D 36.0% · R 63.4%
- 2008→2024 swing
- -12.5pp toward R · 2008: -14.8pp · 2024: -27.4pp
- All cycles
- 2024: R+27.4 2020: R+21.6 2016: R+24.5 2012: R+22.3 2008: R+14.8
Not yet ingested
- Civics
- —
Market trends
- HPI YoY
- ▼ -49.85%
- Current HPI
- 330.1691
- Rent YoY
- ▲ 6.22%
- Metro
- Sebastian-Vero Beach, FL
- State GDP YoY
- ▲ 3.28%
- F500 in state
- 36
Industry mix (Fortune 500 HQ in FL)
| Industry | F500 HQs | Revenue |
|---|---|---|
| Industrial Technology | 2 | $29B |
|
||
| Insurance | 2 | $17B |
|
||
| Retail | 1 | $60B |
|
||
| Technology Distribution | 1 | $58B |
|
||
| Homebuilding | 1 | $35B |
|
||
| Technology Manufacturing | 1 | $35B |
|
||
Price history
+311.6% since first listed16 events — show timeline
- 2026-05-12 Price Changed $349,900 SCMLS
- 2026-05-08 Price Changed $349,000 SCMLS
- 2026-03-23 Price Changed $349,900 SCMLS
- 2026-03-18 Relisted — SCMLS
- 2026-01-17 Listing Removed — SCMLS
- 2026-01-08 Price Changed $349,000 SCMLS
- 2025-12-16 Listed $349,900 SCMLS
- 2025-12-15 Coming Soon $349,900 SCMLS
- 2016-08-16 Listing Removed — SCMLS
- 2010-07-12 Sold (Public Records) $110,000 Public Records
- 2010-07-08 Sold (MLS) $110,000 RAIRCMLS
- 2010-05-24 Listing Removed — Beaches MLS
- 2010-05-06 Listed $114,900 Beaches MLS
- 2010-05-06 Listed $114,900 SCMLS
- 1998-12-09 Sold (Public Records) $92,000 Public Records
- 1996-06-21 Sold (Public Records) $85,000 Public Records
Property tax history
+4.8%/yrLatest (2025): $1,248 · +5.4% YoY. Source: county tax records.
Cash-flow waterfall
monthlySold comps — $/sqft
last 12 mo · ≤1 miLoading sold comps…