1000 7th St #14 · Arcata, CA
Flood risk 1/10 · Minimal
- FEMA flood zone
- X (unshaded)
- Chance of flooding over 30 yrs
- 0.0%
- Est. flood insurance / yr
- $507 – $1,088
Fire risk 1/10 · Minimal
- Est. fire insurance / yr
- $659 – $1,223
Heat risk 2/10 · Minimal
- Hot days now (above 77°F)
- 9 days/yr
- Hot days in 30 yrs
- 23 days/yr
Wind risk 1/10 · Minimal
- Chance of severe wind over 30 yrs
- —
Air-quality risk 6/10 · Moderate
- Unhealthy air days now
- 9 days/yr
- Unhealthy air days in 30 yrs
- 9 days/yr
Risk factors via First Street. Map © Google.
Why this score? — see what drove the B grade
The composite is a weighted blend of 9 inputs, each scored 0–100. Each bar is that input's sub-score; the figure is the points it added to the 100-point composite (weight × sub-score).
- Cash flow +30.0/30.0
- 1% rule +10.0/10.0
- DSCR +10.0/10.0
- ARV discount +7.5/15.0
- Rent growth +4.5/5.0
- Schools +4.2/10.0
- Livability +3.4/5.0
- Condition / age +2.5/5.0
- Appreciation +0.0/10.0
$60,000
🖨 Deal sheet 📄 Offer letter ✓ Due diligence
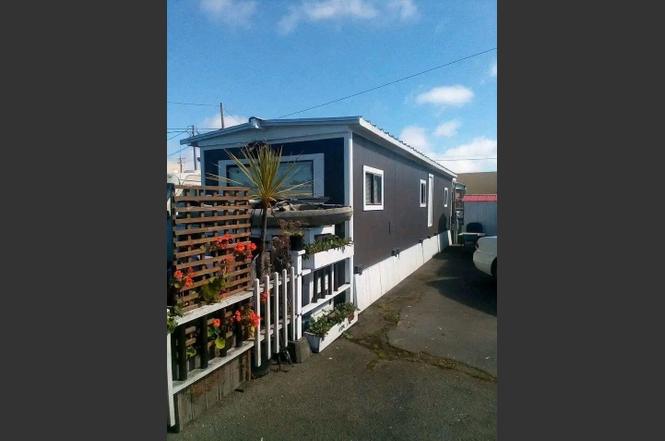
Listing remarks
Fully furnished 1 bedroom 1 bathroom manufactured mobile home for sale with laundry hook ups and additional space for use. Located in Arcata Trailer Court, this home is a close distance to Arcata Plaza, Cal Poly HSU campus, and close to the Natural Foods Co-op. Great opportunity for first time buyers or for an investor/ builder. Park approval required.
Key facts
- Laundry hook ups
- Built 1965
- Listed 36 days
Tags
Neighborhood map
What this means for you Summary
Snapshot
- This is a 1-bed/1.0-bath manufactured listed at $60k.
Deal economics
- At list price, monthly cash flow is $516 ($6k/yr) — positive.
- The deal already cash-flows at list — no discount required.
- Meets the 1% rule at list price ($1k rent vs $60k).
- Recommended offer: $58k (3.0% below list) — sets the bar for market timing.
- Cap rate 16.6% vs local median 1.9% in Arcata — top-decile yield for the area; either an underpriced asset or a hidden risk that comps aren't pricing in. Stress-test before assuming the spread holds.
Location & tenants
- Location reads 68/100 on livability (#275 in CA) — a middle-class / working-renter tenant base. Strengths: amenities A+, health & safety A+, schools A-; Watch: housing C-, crime D-, commute F.
- Northern Humboldt Union High (town): math 32% / reading 65% proficiency, ranked #529 of 1,400 in CA (top 38%) — families likely to look elsewhere, expect single-tenant / working-renter base with shorter leases; only 10% free/reduced lunch — higher-income household profile.
- Market conditions: Rents rising fast (+8.1%/yr); 82 active listings in the ZIP; 188 units permitted in Humboldt County in 2024 (17 in 5+ unit buildings).
Forward outlook
- Local home prices are declining (-3.0%/yr); year-one equity from $415 of loan paydown is wiped out by about $2k of value loss. Plan a longer hold.
- Humboldt County population projected to shrink 4% by 2050 — rents likely to lag national; underwrite the cash flow, not the appreciation.
- At projected returns (-3.0% appreciation + 8.0% rent growth), your $17k cash investment doubles in ~3 years — after that, you're playing with house money.
Negotiation context
- It's been on market 36 days — a 3% lower offer ($58k) is reasonable based on typical stale-listing flexibility.
- 2 sale attempts with the ask held roughly flat each time — persistent listings suggest the price (not the market) is what's stuck; bring a comps-based counter.
Questions for the listing agent
- It's been on market 36 days. Have you received any prior offers? Is the seller open to a 3% concession, seller financing, or rate buy-down credit?
- Built in 1965 — when were the roof, HVAC, electrical panel, plumbing, and water heater last replaced?
- Is there a deadline driving the sale (1031 exchange, divorce, estate, relocation)? That informs how much negotiation room exists.
- Schools are A-rated — typically a magnet for longer-tenancy family renters. What's the average tenant stay here, and is there a school-zone premium baked into asking?
- Crime grade is D in this area — have there been break-ins, vandalism, or insurance claims at this property in the last 3 years? What carrier currently insures it and at what premium?
- What's the average days-on-market for RENTAL listings here right now (not sales)? A rising rental-DOM trend means longer vacancies and softer asking-rent achievability than the comps imply.
- What's the recent tenant-quality profile in this submarket — average credit score on applications, eviction rate, late-payment / NSF rate, and stable-employment percentage? A property-management company in the area should have these aggregated.
- How much new for-sale + rental construction is in the pipeline within 1–3 miles? Heavy new supply typically softens prices + rents 12–24 months out; constrained supply supports both.
Investment metrics
- 1% rule
- 1.96% ✓
- Cap rate
- 16.61%
- Cash-on-cash
- 36.84%
- DSCR
- 2.64
- GRM
- 4.2
CMA / ARV
No comps found within radius.
Projected returns pro-forma
-3.0% appreciation · 8.0% rent growth · sell at horizon
- IRR
- 38.3%
- Equity multiple
- 2.75×
- Total profit
- $29,372
- Equity at exit
- $8,946
- IRR
- 47.2%
- Equity multiple
- 6.73×
- Total profit
- $96,282
- Equity at exit
- $5,188
Cash invested: $16,800 (down + closing). Projections, not guarantees.
Landlord ↔ Tenant lean methodology
- Overall (STATE)
- 18 Strongly Tenant-Friendly
- State California
- 18 Strongly Tenant-Friendly · D+13
- County
- — inherits STATE
- City
- — inherits STATE
ZIP-level market 95521
- Rents YoY
- 8.1%
- Active inventory
- 82
- Price-to-rent
- 4.2×
Monthly cashflow live
- Estimated rent
- $1,178 medium interval (Pro) →
- Mortgage (P&I)
- −$315
- Tax est. 1.5%
- −$75 /mo · $900/yr
- Insurance
- −$25
- HOA
- −$0
- Vacancy / Maint / Mgmt
- −$247
- Net cashflow
- $516
Break-even live
UW: 25.0% down · 7.5% · 30yr · 1.5% tax · 5.0% vac · 8.0% maint · 8.0% mgmt
Financing live
Cash to close
- Down payment
- $15,000
- Closing costs
- $1,800
- Reserves months
- —
- Total cash needed
- —
Loan-product check · same deal, 3 products live
Conventional
25% down · 7.5% · 30yr
- Down + closing
- —
- Monthly P&I
- —
- Monthly cashflow
- —
- DSCR
- —
- Eligible?
- —
Personal DTI + credit; lowest rate.
DSCR
20% down · 8.5% · 30yr
- Down + closing
- —
- Monthly P&I
- —
- Monthly cashflow
- —
- DSCR
- —
- Eligible?
- —
No personal income docs; deal must DSCR.
Hard money
10% down · 12.0% · 12mo
- Down + closing
- —
- Monthly P&I
- —
- Monthly cashflow
- —
- DSCR
- —
- Eligible?
- —
Short-term bridge; refi at stabilization.
Listing history 4 events
-
2026-02-11status Pending
-
2025-11-22price $60,000
-
2025-11-05$61,000 Active
-
2025-11-05$61,000 Active
ⓘ Source: listings_history table (triggers on properties + properties_extension) + one-shot
backfill from property_details.listing_events for pre-trigger history.
Climate risk First Street
- Flood 1/10 Low FEMA zone X (unshaded) · 0% chance over 30 yrs
- Wildfire 1/10 Low
- Heat 2/10 Low 9 d/yr ≥77°F today · 23 d/yr by 30 yrs out
- Wind 1/10 Low
- Air quality 6/10 Major 9 unhealthy d/yr today · 9 by 30 yrs out
Nearby sold comps map
Loading sold comps map…
Walkable amenities ~0.75 mi
Loading nearby amenities…
Taxation est. · year 1
- Rental income
- $14,134
- − Mortgage interest
- −$3,361
- − Property taxes
- −$900
- − Insurance
- −$300
- − Repairs & maintenance
- −$1,131
- − Management
- −$1,131
- − Depreciation
- −$1,745
- Taxable income
- $5,566
- Est. tax owed @ 24.0%
- −$1,336
- After-tax cash flow
- $4,854/yr
For passive investors: Depreciation is non-cash, so a rental often shows a tax loss while cash-flowing — sheltering income. Rental losses are passive: they offset passive income freely, and up to $25,000/yr can offset ordinary (W-2) income if you actively participate and your MAGI is under $100k (phasing out to $0 by $150k); unused losses carry forward. On sale, claimed depreciation is recaptured at up to 25%, and gains may owe capital-gains tax (a 1031 exchange can defer both). Figures are a year-1 estimate at your 24.0% rate — not tax advice; consult a CPA.
Schools (NCES district)
- District
- Northern Humboldt Union High
- NCES district ID
- 0603030
- Math proficiency
- 32% ▼ -3.00%
- Reading proficiency
- 65% ▲ 8.00%
- Median HH income
- $36,832
- Composite
- 42.3/100
- National rank
- #6962
- State rank
- #529 of 1400 in CA
Livability — Arcata
- Score
- 68/100
- State rank
- #275
- US rank
- #9258
Category grades
Schools grade is shown separately in the Schools card above.
Census & demographics
- Census place
- Arcata, CA
- County
- Humboldt County · 88,652 people
- City population
- 21,980
- Metro
- Eureka-Arcata, CA
- Population (ZIP)
- 21,980
- Household income
- $53,114
- Rent vs Own
- Severe rent burden
- 2139.0
Population outlook (Humboldt County) Hauer SSP2
- Today (2025)
- 135,550 people
- By 2030
- 134,798 · -0.6%
- By 2040
- 132,222 · -2.5%
- By 2050
- 130,850 · -3.5%
- By 2075
- 128,656 · -5.1%
- By 2100
- 120,238 · -11.3%
Race, ethnicity, and origin ACS 2023
- Neighborhood character
- Predominantly White (72%)
- Race & ethnicity
- White 72% Hispanic / Latino 15% Two or more races 13% Asian 2% Black 2% Native American 1%
- Hispanic origin (detail)
- Mexican 11% Puerto Rican 2%
- Common ancestry
- Lithuanian 5% Russian 5% Italian 4%
- Foreign-born
- 6% · Canada
- Languages at home
- 87% English-only · Spanish 8% Other Indo-European 2% Other Asian/Pacific 1%
Political lean MEDSL · Humboldt
- 2024 margin
- Strong D (+28.4) · D 62.0% · R 33.6% · Other 4.5%
- 2008→2024 swing
- +0.2pp no change · 2008: 28.2pp · 2024: 28.4pp
- All cycles
- 2024: D+28.4 2020: D+33.4 2016: D+25.9 2012: D+26.2 2008: D+28.2
Not yet ingested
- Civics
- —
Market trends
- HPI YoY
- ▼ -373.51%
- Current HPI
- 208.5938
- Rent YoY
- ▲ 8.08%
- Metro
- Eureka-Arcata, CA
- State GDP YoY
- ▲ 3.21%
- F500 in state
- 116
Industry mix (Fortune 500 HQ in CA)
| Industry | F500 HQs | Revenue |
|---|---|---|
| Technology | 27 | $1,492B |
|
||
| Financial Services | 3 | $174B |
|
||
| Retail | 3 | $44B |
|
||
| Insurance | 3 | $26B |
|
||
| Media / Entertainment | 2 | $115B |
|
||
| Pharmaceuticals / Biotech | 2 | $62B |
|
||
Price history
-1.6% since first listed4 events — show timeline
- 2026-02-11 Pending — HAR
- 2025-11-22 Price Changed $60,000 HAR
- 2025-11-05 Listed $61,000 HAR
- 2025-11-05 Listed $61,000 HAR
Property tax history
+5.6%/yrLatest (2025): $91 · -0.2% YoY. Source: county tax records.
Cash-flow waterfall
monthlySold comps — $/sqft
last 12 mo · ≤1 miLoading sold comps…