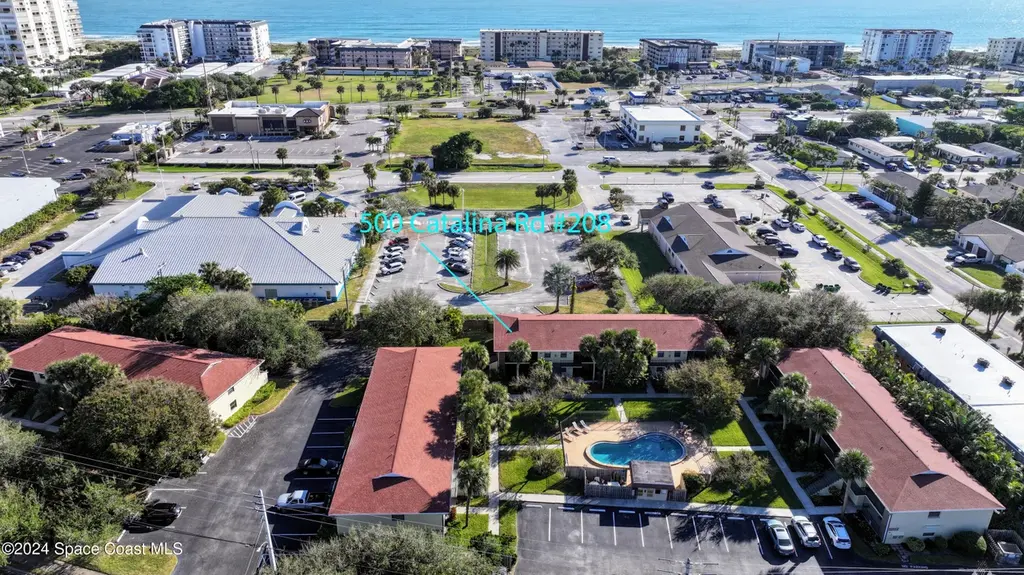
500 Catalina Rd #208 · Cocoa Beach, FL
Flood risk 9/10 · Severe
- FEMA flood zone
- X (shaded)
- Chance of flooding over 30 yrs
- 0.99%
- Est. flood insurance / yr
- $507 – $1,088
Fire risk 1/10 · Minimal
- Est. fire insurance / yr
- $947 – $1,759
Heat risk 10/10 · Severe
- Hot days now (above 104°F)
- 7 days/yr
- Hot days in 30 yrs
- 25 days/yr
Wind risk 10/10 · Severe
- Chance of severe wind over 30 yrs
- 99.0%
Air-quality risk 1/10 · Minimal
- Unhealthy air days now
- 0 days/yr
- Unhealthy air days in 30 yrs
- 0 days/yr
Risk factors via First Street. Map © Google.
Why this score? — see what drove the C grade
The composite is a weighted blend of 9 inputs, each scored 0–100. Each bar is that input's sub-score; the figure is the points it added to the 100-point composite (weight × sub-score).
- Cash flow +21.4/30.0
- 1% rule +8.7/10.0
- ARV discount +7.5/15.0
- DSCR +6.8/10.0
- Schools +4.7/10.0
- Livability +3.6/5.0
- Rent growth +3.5/5.0
- Condition / age +2.5/5.0
- Appreciation +0.0/10.0
$184,900
🖨 Deal sheet (PDF) 📄 Offer letter ✓ Due diligence
Listing remarks MLS
Investor Alert! Tenant occupied and they want to stay. Lovely condo community close to beaches and Downtown. This top floor, end unit is in a quiet neighborhood, but only a short distance to restaurants, shopping and entertainment. Community has a beautiful inground pool.
Key facts
- Inground pool
- Quiet neighborhood
- $400 HOA
Tags
Property features AI
Finance
- HOA & community: Homeowners association (BP Davis Management); Association fee $400 monthly; HOA covers water and trash; Association amenities include car wash area; Pets allowed with number limit
Exterior
- Parking: Assigned and unassigned spaces in a parking lot; Car wash area in association
- Utilities: Public sewer; Water connected; Electricity available; Cable connected
- Home design: Condominium; 2-story building; Entry on level 2; Faces west
- Construction: Block, concrete and stucco construction
- Exterior features: Balcony; Screened porch/patio
Interior
- Kitchen: Electric range; Refrigerator
- Bedrooms: 2 bedrooms
- Flooring: Carpet; Other flooring
- Bathrooms: 1 full bathroom; 1 half bathroom (total 2 bathrooms)
- Heating & cooling: Central heating (electric); Central air conditioning (electric)
- Interior features: Primary bathroom with tub and shower; Unfurnished unit
- Laundry & utility: In-unit washer and dryer
Neighborhood map
What this means for you Summary
Snapshot
- This is a 2-bed/1.5-bath condo listed at $185k.
Deal economics
- At list price, monthly cash flow is $209 ($3k/yr) — positive.
- The deal already cash-flows at list — no discount required.
- Meets the 1% rule at list price ($3k rent vs $185k).
Location & tenants
- Location reads 71/100 on livability (#398 in FL) — a middle-class / working-renter tenant base. Strengths: crime A+, housing A, employment B; Watch: cost of living C-, amenities F, commute F.
- Brevard (suburban): math 53% / reading 57% proficiency, ranked #19 of 73 in FL (top 26%) — acceptable for families but not a draw, mixed tenant base, ~2y average lease.
- Zoned schools: Theodore Roosevelt Elementary School (math 67% / reading 77%, grade A-, #288 of 2,144 statewide, top 15%, 288 students, 40% FRL); Cocoa Beach Junior/Senior High School (math 65% / reading 66%, grade B, #75 of 667 statewide, top 11%, 982 students, 30% FRL).
- Zoned-school proficiency averages 69% at this address vs 55% district-wide (+14 pts) — the actual schools serving this property are materially stronger than the Brevard average implies; a family-tenant draw the district grade alone would hide.
- Market conditions: Rents rising fast (+4.1%/yr); 319 active listings in the ZIP; 23 comparable units currently listed for rent nearby; rentals at typical pace (median 25d on market — plan ~3-4 weeks tenant-placement turnaround); solid renter incomes; 4,602 units permitted in Brevard County in 2024 (702 in 5+ unit buildings).
- This rent runs 34% of the median local income ($89k/yr) — at the standard rent-burdened threshold; future hikes will face affordability resistance.
Forward outlook
- Local home prices are declining (-3.0%/yr); year-one equity from $1k of loan paydown is wiped out by about $6k of value loss. Plan a longer hold.
- Brevard County population projected at +15% by 2050 — modest demand growth; plan on rents tracking national, not racing it.
Negotiation context
- Only 3 days on market — expect competitive offers; lowballing is unlikely to land.
- 3 sale attempts since 10y ago with the ask held roughly flat each time — persistent listings suggest the price (not the market) is what's stuck; bring a comps-based counter.
- Current owner paid $129k; 43% above their basis — modest negotiation headroom, anchor on the comps not their cost.
Risks & watch-outs
- Watch-outs: flood insurance adds $66/mo.
- Climate carrying-cost: severe flood risk; severe wind risk, 99% chance of damaging wind over 30y; extreme-heat days projected 7→25/yr by 2055 (HVAC capex compounding) — expect insurance premiums to compound above CPI over the hold.
Questions for the listing agent
- What's the actual annual flood-insurance premium (NFIP or private), and is the property in a SFHA with mandatory coverage?
- What does the HOA fee cover, when was the last increase, and are there any pending special assessments or reserve-fund shortfalls?
- Any open or pending special assessments — roof, HVAC, plumbing, elevator, façade? What's the per-unit balance and payoff schedule, and is the seller paying it off at close or rolling it to the buyer?
- Is there a deadline driving the sale (1031 exchange, divorce, estate, relocation)? That informs how much negotiation room exists.
- Schools are A-rated — typically a magnet for longer-tenancy family renters. What's the average tenant stay here, and is there a school-zone premium baked into asking?
- What's the average days-on-market for RENTAL listings here right now (not sales)? A rising rental-DOM trend means longer vacancies and softer asking-rent achievability than the comps imply.
- What's the recent tenant-quality profile in this submarket — average credit score on applications, eviction rate, late-payment / NSF rate, and stable-employment percentage? A property-management company in the area should have these aggregated.
- How much new apartment / multifamily construction is in the pipeline within 1–3 miles? Heavy new supply (>2% of stock underway) typically softens rents 12–24 months out; light construction supports rent growth.
Investment metrics
- 1% rule
- 1.37% ✓
- Cap rate
- 8.08%
- Cash-on-cash
- 6.39%
- DSCR
- 1.28
- GRM
- 6.1
CMA / ARV
No comps found within radius.
Projected returns pro-forma
-3.0% appreciation · 4.07% rent growth · sell at horizon
- IRR
- -6.9%
- Equity multiple
- 0.74×
- Total profit
- $-13,506
- Equity at exit
- $27,569
- IRR
- 4.5%
- Equity multiple
- 1.36×
- Total profit
- $18,463
- Equity at exit
- $15,987
Cash invested: $51,772 (down + closing). Projections, not guarantees.
Landlord ↔ Tenant lean methodology
- Overall (STATE)
- 87 Strongly Landlord-Friendly
- State Florida
- 87 Strongly Landlord-Friendly · R+3
- County
- — inherits STATE
- City
- — inherits STATE
ZIP-level market 32931
- Rents YoY
- 4.1%
- Active inventory
- 319
- Price-to-rent
- 6.1×
Monthly cashflow live
- Estimated rent
- $2,542 high interval (Pro) →
- Mortgage (P&I)
- −$970
- Tax from tax record
- −$286 /mo · $3,429/yr
- Insurance
- −$77
- Flood insurance flood zone
- −$66 /mo · $798/yr
- HOA
- −$400
- Vacancy / Maint / Mgmt
- −$534
- Net cashflow
- $209
Break-even live
Sensitivity live
| Price | -10% $314 | -5% $262 | +0% $209 | +5% $157 | +10% $105 |
|---|---|---|---|---|---|
| Rent | -10% $9 | -5% $109 | +0% $209 | +5% $310 | +10% $410 |
| Rate | -1.0pp $302 | -0.5pp $256 | base $209 | +0.5pp $161 | +1.0pp $113 |
UW: 25.0% down · 7.5% · 30yr · 1.5% tax · 5.0% vac · 8.0% maint · 8.0% mgmt
Financing live
Cash to close
- Down payment
- $46,225
- Closing costs
- $5,547
- Reserves months
- —
- Total cash needed
- —
Loan-product check · same deal, 3 products live
Conventional
25% down · 7.5% · 30yr
- Down + closing
- —
- Monthly P&I
- —
- Monthly cashflow
- —
- DSCR
- —
- Eligible?
- —
Personal DTI + credit; lowest rate.
DSCR
20% down · 8.5% · 30yr
- Down + closing
- —
- Monthly P&I
- —
- Monthly cashflow
- —
- DSCR
- —
- Eligible?
- —
No personal income docs; deal must DSCR.
Hard money
10% down · 12.0% · 12mo
- Down + closing
- —
- Monthly P&I
- —
- Monthly cashflow
- —
- DSCR
- —
- Eligible?
- —
Short-term bridge; refi at stabilization.
Rent comps 23 comps
| Address | Beds | Baths | Sqft | Rent | $/sqft | DOM | Units | Dist |
|---|---|---|---|---|---|---|---|---|
| 383 N Atlantic Ave #308 Cocoa Beach, FL | 2.0 | 2.0 | 1049 | $2,600 | $2.48 | 25d | 1 | 0.25mi |
| 333 N Atlantic Ave #207 Cocoa Beach, FL | 2.0 | 2.0 | 1100 | $2,800 | $2.55 | 15d | 1 | 0.28mi |
| 171 N Atlantic Ave #39 Cocoa Beach, FL | 2.0 | 1.5 | 1088 | $2,700 | $2.48 | 25d | 1 | 0.46mi |
| 39 Cedar Ave Unit 39 Cocoa Beach, FL | 2.0 | 1.0 | 675 | $1,850 | $2.74 | 25d | 1 | 0.54mi |
| 79 S Brevard Ave Unit 1389636P Cocoa Beach, FL | 2.0 | 1.0 | 850 | $2,796 | $3.29 | 20d | 1 | 0.70mi |
| 1830 N Atlantic Ave #205 Cocoa Beach, FL | 1.0 | 1.0 | 888 | $2,400 | $2.70 | 25d | 1 | 1.02mi |
| 2020 N Atlantic Ave #209 Cocoa Beach, FL | 2.0 | 1.5 | 816 | $2,100 | $2.57 | 25d | 1 | 1.07mi |
| 2020 N Atlantic Ave Unit 215N Cocoa Beach, FL | 1.0 | 1.0 | 816 | $1,950 | $2.39 | 25d | 1 | 1.08mi |
| 2020 N Atlantic Ave Unit 210N Cocoa Beach, FL | 2.0 | 2.0 | 816 | $2,150 | $2.63 | 15d | 1 | 1.08mi |
| 2020 N Atlantic Ave Unit 317S Cocoa Beach, FL | 2.0 | 2.0 | 912 | $2,800 | $3.07 | 25d | 1 | 1.08mi |
| 2020 N Atlantic Ave Unit 117S Cocoa Beach, FL | 2.0 | 2.0 | 912 | $2,300 | $2.52 | 25d | 1 | 1.08mi |
| 325 S Banana River Blvd #209 Cocoa Beach, FL | 2.0 | 2.0 | 1014 | $2,500 | $2.47 | 25d | 1 | 1.12mi |
| 1999 S Banana River Blvd #313 Cocoa Beach, FL | 2.0 | 2.0 | 1092 | $2,200 | $2.01 | 25d | 1 | 1.20mi |
| 2100 N Atlantic Ave Cocoa Beach, FL | 1.0–2.0 | 1.0–2.5 | 1250 | $5,000 | $4.00 | 15d | 6 | 1.21mi |
| 3060 N Atlantic Ave Cocoa Beach, FL | 1.0–2.0 | 1.0–2.0 | 1284 | $2,500 | $1.95 | 16d | 3 | 1.33mi |
| 3060 N Atlantic Ave Cocoa Beach, FL | 1.0–2.0 | 1.0–2.0 | 1284 | $2,900 | $2.26 | 22d | 4 | 1.33mi |
| 3150 N Atlantic Ave Unit 770-3 Cocoa Beach, FL | 2.0 | 1.0 | 800 | $1,950 | $2.44 | 16d | 1 | 1.33mi |
| 3150 N Atlantic Ave Cocoa Beach, FL | 2.0 | 1.0 | 750 | $2,100 | $2.80 | 22d | 4 | 1.33mi |
| 770 Diplomat Blvd Unit 14 Good Vibes Condo Cocoa Beach, FL | 2.0 | 1.0 | 800 | $1,850 | $2.31 | 25d | 1 | 1.40mi |
| 748 S Orlando Ave #512 Cocoa Beach, FL | 2.0 | 2.0 | 1088 | $2,000 | $1.84 | 22d | 1 | 1.43mi |
| 3190 N Atlantic Ave Cocoa Beach, FL | 1.0–2.0 | 1.0 | 657 | $2,300 | $3.50 | 20d | 3 | 1.47mi |
| 3190 N Atlantic Ave Cocoa Beach, FL | 1.0–2.0 | 1.0 | 657 | $2,300 | $3.50 | 25d | 4 | 1.47mi |
| 718 S Atlantic Ave Cocoa Beach, FL | 1.0–2.0 | 1.0 | 750 | $2,150 | $2.87 | 25d | 2 | 1.49mi |
HOA detail condo
- Monthly dues
- $400 · $4,800/yr
- Likely covers
- pool
- Assessments
- None detected in remarks — confirm with the listing agent.
Listing history 9 events
-
2026-05-16status Pending
-
2026-05-13$184,900 Active
-
2025-02-13historical 272-char remark
Show marketing remark (272 chars)
Investor Alert! Tenant occupied and they want to stay. Lovely condo community close to beaches and Downtown. This top floor, end unit is in a quiet neighborhood, but only a short distance to restaurants, shopping and entertainment. Community has a beautiful inground pool.
-
2025-02-08price $234,900 272-char remark
Show marketing remark (272 chars)
Investor Alert! Tenant occupied and they want to stay. Lovely condo community close to beaches and Downtown. This top floor, end unit is in a quiet neighborhood, but only a short distance to restaurants, shopping and entertainment. Community has a beautiful inground pool.
-
2024-12-06$249,000 Active 272-char remark
Show marketing remark (272 chars)
Investor Alert! Tenant occupied and they want to stay. Lovely condo community close to beaches and Downtown. This top floor, end unit is in a quiet neighborhood, but only a short distance to restaurants, shopping and entertainment. Community has a beautiful inground pool.
-
2017-03-22soldstatus $129,000 284-char remark
Show marketing remark (284 chars)
Perfect condo community only a short walk from the beach, and Downtown. This top floor, 2 bedroom, 1 and a half bathroom unit is in a quiet neighborhood, but is still only a short distance from shopping restaurants, and entertainment. Community also offers a beautiful in ground pool.
-
2016-12-30$142,000 284-char remark
Show marketing remark (284 chars)
Perfect condo community only a short walk from the beach, and Downtown. This top floor, 2 bedroom, 1 and a half bathroom unit is in a quiet neighborhood, but is still only a short distance from shopping restaurants, and entertainment. Community also offers a beautiful in ground pool.
-
1984-11-01soldstatus $50,000
-
1980-03-01soldstatus $35,500
ⓘ Source: listings_history table (triggers on properties + properties_extension) + one-shot
backfill from property_details.listing_events for pre-trigger history.
Tax reassessment forecast FL · Resets to sale price
- Current annual tax
- $3,429 · $286/mo
- Projected year-2 tax
- $3,429 · $286/mo
- Expected delta
- $0/yr ($0/mo · 0.0%)
ⓘ Screening estimate from a state-policy table — verify with the county assessor before closing.
Climate risk First Street
- Flood 9/10 Extreme FEMA zone X (shaded) · 99% chance over 30 yrs
- Wildfire 1/10 Low
- Heat 10/10 Extreme 7 d/yr ≥104°F today · 25 d/yr by 30 yrs out
- Wind 10/10 Extreme 99% chance of damaging wind over 30 yrs
- Air quality 1/10 Low 0 unhealthy d/yr today · 0 by 30 yrs out
Nearby sold comps map
Loading sold comps map…
Walkable amenities ~0.75 mi
Loading nearby amenities…
Taxation est. · year 1
- Rental income
- $30,505
- − Mortgage interest
- −$10,357
- − Property taxes
- −$3,429
- − Insurance
- −$1,722
- − Repairs & maintenance
- −$2,440
- − Management
- −$2,440
- − HOA
- −$4,800
- − Depreciation
- −$5,379
- Taxable loss
- −$63
- Est. tax savings @ 24.0%
- +$15
- After-tax cash flow
- $2,527/yr
For passive investors: Depreciation is non-cash, so a rental often shows a tax loss while cash-flowing — sheltering income. Rental losses are passive: they offset passive income freely, and up to $25,000/yr can offset ordinary (W-2) income if you actively participate and your MAGI is under $100k (phasing out to $0 by $150k); unused losses carry forward. On sale, claimed depreciation is recaptured at up to 25%, and gains may owe capital-gains tax (a 1031 exchange can defer both). Figures are a year-1 estimate at your 24.0% rate — not tax advice; consult a CPA.
Schools (NCES district)
- District
- Brevard
- NCES district ID
- 1200150
- Math proficiency
- 53% ▼ -9.00%
- Reading proficiency
- 57% ▼ -4.00%
- Median HH income
- $49,426
- Composite
- 46.86/100
- National rank
- #2370
- State rank
- #19 of 73 in FL
Livability — Cocoa Beach
- Score
- 71/100
- State rank
- #398
- US rank
- #7077
Category grades
Schools grade is shown separately in the Schools card above.
Census & demographics
- Census place
- Cocoa Beach, FL
- County
- Brevard County · 602,871 people
- City population
- 14,174
- Metro
- Palm Bay-Melbourne-Titusville, FL
- Population (ZIP)
- 14,174
- Household income
- $89,457
- Rent vs Own
- Severe rent burden
- 445.0
Population outlook (Brevard County) Hauer SSP2
- Today (2025)
- 623,254 people
- By 2030
- 648,420 · +4.0%
- By 2040
- 690,009 · +10.7%
- By 2050
- 715,669 · +14.8%
- By 2075
- 775,744 · +24.5%
- By 2100
- 776,687 · +24.6%
Race, ethnicity, and origin ACS 2023
- Neighborhood character
- Predominantly White (87%)
- Race & ethnicity
- White 87% Two or more races 7% Hispanic / Latino 7% Black 2% Asian 1%
- Hispanic origin (detail)
- Mexican 1% Puerto Rican 2% Cuban 1% Dominican 1%
- Common ancestry
- Romanian 5% Lithuanian 4% Italian 3%
- Foreign-born
- 9% · Canada, Jamaica
- Languages at home
- 88% English-only · Spanish 5% Other Indo-European 3% Russian/Polish/Slavic 1%
Political lean MEDSL · Brevard
- 2024 margin
- Strong R (+20.8) · D 39.1% · R 59.9% · Other 1.0%
- 2008→2024 swing
- -10.4pp toward R · 2008: -10.4pp · 2024: -20.8pp
- All cycles
- 2024: R+20.8 2020: R+16.4 2016: R+19.8 2012: R+12.7 2008: R+10.4
Not yet ingested
- Civics
- —
Market trends
- HPI YoY
- ▼ -249.02%
- Current HPI
- 312.0196
- Rent YoY
- ▲ 4.07%
- Metro
- Palm Bay-Melbourne-Titusville, FL
- State GDP YoY
- ▲ 3.28%
- F500 in state
- 36
Industry mix (Fortune 500 HQ in FL)
| Industry | F500 HQs | Revenue |
|---|---|---|
| Industrial Technology | 2 | $29B |
|
||
| Insurance | 2 | $17B |
|
||
| Retail | 1 | $60B |
|
||
| Technology Distribution | 1 | $58B |
|
||
| Homebuilding | 1 | $35B |
|
||
| Technology Manufacturing | 1 | $35B |
|
||
Price history
+420.8% since first listed9 events — show timeline
- 2026-05-16 Pending — SCMLS
- 2026-05-13 Listed $184,900 SCMLS
- 2025-02-13 Listing Removed — SCMLS
- 2025-02-08 Price Changed $234,900 SCMLS
- 2024-12-06 Listed $249,000 SCMLS
- 2017-03-22 Sold (MLS) $129,000 SCMLS
- 2016-12-30 Listed $142,000 SCMLS
- 1984-11-01 Sold (Public Records) $50,000 Public Records
- 1980-03-01 Sold (Public Records) $35,500 Public Records
Property tax history
+9.4%/yrLatest (2025): $3,429 · +6.7% YoY. Source: county tax records.
Cash-flow waterfall
monthlySold comps — $/sqft
last 12 mo · ≤1 miLoading sold comps…