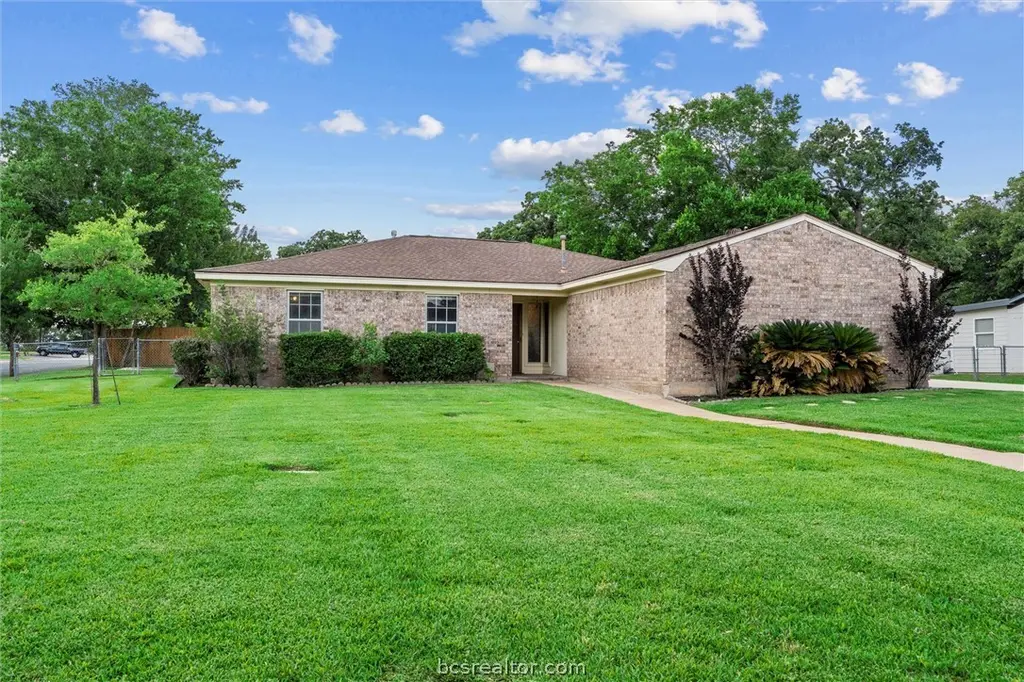
1201 Hawk Tree Dr · College Station, TX
Flood risk 1/10 · Minimal
- FEMA flood zone
- X (unshaded)
- Chance of flooding over 30 yrs
- 0.0%
- Est. flood insurance / yr
- $507 – $1,088
Fire risk 4/10 · Minor
- Est. fire insurance / yr
- $1,222 – $2,270
Heat risk 8/10 · Major
- Hot days now (above 110°F)
- 7 days/yr
- Hot days in 30 yrs
- 24 days/yr
Wind risk 8/10 · Major
- Chance of severe wind over 30 yrs
- 80.0%
Air-quality risk 1/10 · Minimal
- Unhealthy air days now
- 0 days/yr
- Unhealthy air days in 30 yrs
- 0 days/yr
Risk factors via First Street. Map © Google.
Why this score? — see what drove the C- grade
The composite is a weighted blend of 9 inputs, each scored 0–100. Each bar is that input's sub-score; the figure is the points it added to the 100-point composite (weight × sub-score).
- Cash flow +15.2/30.0
- ARV discount +11.9/15.0
- 1% rule +4.7/10.0
- DSCR +4.7/10.0
- Schools +4.7/10.0
- Livability +4.2/5.0
- Rent growth +3.3/5.0
- Condition / age +2.5/5.0
- Appreciation +0.0/10.0
$250,000
🖨 Deal sheet 📄 Offer letter ✓ Due diligence
Listing remarks
Centrally located in College Station's Southwood Valley, this 4-bedroom, 2-bath property at 1201 Hawk Tree offers a rare opportunity for investors, flippers, or buyers ready to bring new life to a classic home. Sitting on a spacious corner lot in a highly convenient location close to schools, shopping, dining, and everyday amenities, it has solid potential for the right buyer with vision. Inside, you’ll find original features and a functional layout ready for updates and improvements to make it your own. Whether you’re looking for your next renovation project, rental investment, or affordable entry into a great location, this property is priced with its condition in mind and off
Key facts
- Original features
- Functional layout
- Corner lot
Tags
Property features AI
Exterior
- Parking: Attached 2-car garage; 2 covered parking spaces
- Utilities: Public water; Public sewer; Natural gas available; Underground utilities
- Home design: Single-family residence; One story; Slab foundation
- Construction: Composition shingle roof
- Exterior features: Chain link fencing; Approximately 0.264-acre lot
Interior
- Flooring: Carpet; Laminate; Vinyl
- Bathrooms: 2 full bathrooms
- Heating & cooling: Central natural gas heating; Central electric cooling; Ceiling fans
- Interior features: Laminate countertops; Ceiling fans
- Laundry & utility: Gas water heater
Neighborhood map
What this means for you Summary
Snapshot
- This is a 4-bed/2.0-bath single-family listed at $250k.
Deal economics
- At list price, monthly cash flow is $85 ($1k/yr) — positive.
- The deal already cash-flows at list — no discount required.
- To meet the 1% rule (rent ≥ 1% of price), the offer needs to be $243k (2.9% below list).
- Recommended offer: $242k (3.0% below list) — sets the bar for market timing.
- Cap rate 6.7% vs local median 3.3% in College Station — top-decile yield for the area; either an underpriced asset or a hidden risk that comps aren't pricing in. Stress-test before assuming the spread holds.
Location & tenants
- Location reads 83/100 on livability (#11 in TX, #994 nationally) — a professional / high-income tenant draw. Strengths: amenities A+, commute A+, crime A-; Watch: employment C-.
- College Station ISD (urban): math 58% / reading 54% proficiency, ranked #113 of 826 in TX (top 14%) — acceptable for families but not a draw, mixed tenant base, ~2y average lease.
- Market conditions: Rents rising (+3.1%/yr); 1168 active listings in the ZIP; 32 comparable units currently listed for rent nearby; rentals at typical pace (median 21d on market — plan ~3-4 weeks tenant-placement turnaround); solid renter incomes; 2,211 units permitted in Brazos County in 2024 (768 in 5+ unit buildings).
- This rent runs 33% of the median local income ($89k/yr) — at the standard rent-burdened threshold; future hikes will face affordability resistance.
Forward outlook
- Local home prices are declining (-3.0%/yr); year-one equity from $2k of loan paydown is wiped out by about $8k of value loss. Plan a longer hold.
- Brazos County population projected at +55% by 2050 — long-run rental-demand tailwind backs the buy-and-hold thesis.
Negotiation context
- It's been on market 36 days — a 3% lower offer ($242k) is reasonable based on typical stale-listing flexibility.
Risks & watch-outs
- Climate carrying-cost: severe wind risk, 80% chance of damaging wind over 30y; extreme-heat days projected 7→24/yr by 2055 (HVAC capex compounding) — expect insurance premiums to compound above CPI over the hold.
Questions for the listing agent
- It's been on market 36 days. Have you received any prior offers? Is the seller open to a 3% concession, seller financing, or rate buy-down credit?
- Built in 1974 — when were the roof, HVAC, electrical panel, plumbing, and water heater last replaced?
- Is there a deadline driving the sale (1031 exchange, divorce, estate, relocation)? That informs how much negotiation room exists.
- Schools are B-rated — typically a magnet for longer-tenancy family renters. What's the average tenant stay here, and is there a school-zone premium baked into asking?
- What's the average days-on-market for RENTAL listings here right now (not sales)? A rising rental-DOM trend means longer vacancies and softer asking-rent achievability than the comps imply.
- What's the recent tenant-quality profile in this submarket — average credit score on applications, eviction rate, late-payment / NSF rate, and stable-employment percentage? A property-management company in the area should have these aggregated.
- How much new for-sale + rental construction is in the pipeline within 1–3 miles? Heavy new supply typically softens prices + rents 12–24 months out; constrained supply supports both.
Investment metrics
- 1% rule
- 0.97% ✗
- Cap rate
- 6.70%
- Cash-on-cash
- 1.47%
- DSCR
- 1.07
- GRM
- 8.6
CMA / ARV
- ARV (median comp)
- $276,839
- List price
- $250,000
- Delta
- -7.89%
- Verdict
- FAIR
- Comps
- 20 within 1.0 mi
Show comp detail 7 sales within ~0.75 mi
| Address | Dist | Beds/Ba | Sqft | Sold | Price | $/sf | Match |
|---|---|---|---|---|---|---|---|
| 2804 Pueblo Ct N | 0.67mi | 4/2.0 | 1,836 (-0%) | 2mo | $365,000 | $199 | 66 |
| 1605 Todd Trl | 0.45mi | 4/2.0 | 1,956 (+6%) | 12mo | $280,000 | $143 | 59 |
| 1902 Bee Creek Dr | 0.55mi | 4/2.0 | 2,004 (+9%) | 2mo | $335,000 | $167 | 58 |
| 2725 Brothers Blvd | 0.45mi | 3/3.0 (-1) | 1,960 (+6%) | 12mo | $299,000 | $153 | 49 |
| 2813 Socorro Ct | 0.50mi | 3/2.5 (-1) | 1,688 (-8%) | 13mo | $308,000 | $182 | 45 |
| 2715 Adrienne Cir | 0.58mi | 3/2.0 (-1) | 1,749 (-5%) | 18mo | $249,000 | $142 | 44 |
| 1206 Haley Pl | 0.23mi | 3/2.0 (-1) | 1,569 (-15%) | 23mo | $339,000 | $216 | 40 |
Match score weights: distance 35% · size 25% · config 20% · recency 20%. Top-matched comps best support the ARV.
Projected returns pro-forma
-3.0% appreciation · 3.13% rent growth · sell at horizon
- IRR
- -13.8%
- Equity multiple
- 0.51×
- Total profit
- $-34,649
- Equity at exit
- $37,276
- IRR
- -4.6%
- Equity multiple
- 0.69×
- Total profit
- $-21,448
- Equity at exit
- $21,615
Cash invested: $70,000 (down + closing). Projections, not guarantees.
Landlord ↔ Tenant lean methodology
- Overall (STATE)
- 87 Strongly Landlord-Friendly
- State Texas
- 87 Strongly Landlord-Friendly · R+5
- County
- — inherits STATE
- City
- — inherits STATE
ZIP-level market 77845
- Rents YoY
- 3.1%
- Active inventory
- 1168
- Price-to-rent
- 8.6×
Monthly cashflow live
- Estimated rent
- $2,426 high interval (Pro) →
- Mortgage (P&I)
- −$1,311
- Tax from tax record
- −$416 /mo · $4,994/yr
- Insurance
- −$104
- HOA
- −$0
- Vacancy / Maint / Mgmt
- −$510
- Net cashflow
- $85
Break-even live
UW: 25.0% down · 7.5% · 30yr · 1.5% tax · 5.0% vac · 8.0% maint · 8.0% mgmt
Financing live
Cash to close
- Down payment
- $62,500
- Closing costs
- $7,500
- Reserves months
- —
- Total cash needed
- —
Loan-product check · same deal, 3 products live
Conventional
25% down · 7.5% · 30yr
- Down + closing
- —
- Monthly P&I
- —
- Monthly cashflow
- —
- DSCR
- —
- Eligible?
- —
Personal DTI + credit; lowest rate.
DSCR
20% down · 8.5% · 30yr
- Down + closing
- —
- Monthly P&I
- —
- Monthly cashflow
- —
- DSCR
- —
- Eligible?
- —
No personal income docs; deal must DSCR.
Hard money
10% down · 12.0% · 12mo
- Down + closing
- —
- Monthly P&I
- —
- Monthly cashflow
- —
- DSCR
- —
- Eligible?
- —
Short-term bridge; refi at stabilization.
Rent comps 32 comps
| Address | Beds | Baths | Sqft | Rent | $/sqft | DOM | Units | Dist |
|---|---|---|---|---|---|---|---|---|
| 2003 Harvey Mitchell Pkwy S College Station, TX | 3.0 | 4.0 | 1838 | $1,950 | $1.06 | 43d | 1 | 0.18mi |
| 1218 Haley Pl College Station, TX | 3.0 | 2.0 | 1418 | $2,195 | $1.55 | 13d | 1 | 0.28mi |
| 1909 Langford St Unit 1328073P College Station, TX | 4.0 | 2.0 | 2271 | $5,828 | $2.57 | 13d | 1 | 0.42mi |
| 701 Balcones Dr Unit 51 College Station, TX | 3.0 | 2.0 | 1235 | $1,375 | $1.11 | 43d | 1 | 0.44mi |
| 1600 Southwest Pkwy College Station, TX | 1.0–3.0 | 1.0–2.5 | 1005 | $1,500 | $1.49 | 13d | 21 | 0.82mi |
| 2310 Pronghorn Ln College Station, TX | 3.0 | 2.0 | 1350 | $1,550 | $1.15 | 13d | 1 | 0.84mi |
| 3013 Normand Dr College Station, TX | 3.0 | 1.5 | 1479 | $1,600 | $1.08 | 13d | 1 | 0.89mi |
| 1302 Laura Ln College Station, TX | 3.0 | 2.0 | 1460 | $1,825 | $1.25 | 21d | 1 | 0.99mi |
| 1301 Haines Dr College Station, TX | 4.0 | 2.0 | 1790 | $2,200 | $1.23 | 21d | 1 | 1.04mi |
| 529 Southwest Pkwy College Station, TX | 1.0–4.0 | 1.0–4.0 | 1218 | $1,750 | $1.44 | 13d | 1 | 1.06mi |
| 400 Heather Ln College Station, TX | 3.0 | 2.0 | 1723 | $2,400 | $1.39 | 43d | 1 | 1.07mi |
| 515 Southwest Pkwy College Station, TX | 1.0–4.0 | 1.0–4.0 | 1236 | $1,960 | $1.59 | 21d | 1 | 1.07mi |
| 511 Fraternity Row College Station, TX | 3.0 | 2.0 | 1278 | $1,800 | $1.41 | 43d | 1 | 1.10mi |
| 521 Southwest Pkwy #303 College Station, TX | 4.0 | 4.0 | 1236 | $460 | $0.37 | 13d | 1 | 1.11mi |
| 527 Southwest Pkwy #103 College Station, TX | 4.0 | 4.0 | 1236 | $2,800 | $2.27 | 21d | 1 | 1.12mi |
| 527 Southwest Pkwy College Station, TX | 4.0 | 4.0 | 1236 | $1,625 | $1.31 | 43d | 2 | 1.13mi |
| 3209 Salzburg Ct College Station, TX | 4.0 | 2.0 | 2253 | $2,800 | $1.24 | 43d | 1 | 1.17mi |
| 602 Townplace Dr Unit 1328092P College Station, TX | 3.0 | 3.0 | 1291 | $3,348 | $2.59 | 21d | 1 | 1.22mi |
| 1409 Clement Ct Unit 1328074P College Station, TX | 4.0 | 2.0 | 1991 | $5,418 | $2.72 | 13d | 1 | 1.23mi |
| 512 Camp Ct Unit 1328090P College Station, TX | 3.0 | 2.0 | 1388 | $3,624 | $2.61 | 13d | 1 | 1.23mi |
| 1105 Glade St Unit 1328055P College Station, TX | 5.0 | 3.0 | 2077 | $6,440 | $3.10 | 13d | 1 | 1.26mi |
| 3210 Neuburg Ct College Station, TX | 5.0 | 4.5 | 2186 | $800 | $0.37 | 43d | 1 | 1.28mi |
| 118 Kimber Ln College Station, TX | 4.0 | 4.0 | 1853 | $500 | $0.27 | 21d | 1 | 1.31mi |
| 104 Tang Cake Dr College Station, TX | 4.0 | 4.0 | 1853 | $2,800 | $1.51 | 13d | 1 | 1.32mi |
| 301 Southwest Pkwy College Station, TX | 4.0 | 4.0–4.5 | 1538 | $2,200 | $1.43 | 43d | 2 | 1.32mi |
| 131 Deacon Dr W College Station, TX | 4.0 | 4.0 | 1775 | $2,000 | $1.13 | 43d | 1 | 1.33mi |
| 2330 Autumn Chase Loop Unit B College Station, TX | 3.0 | 3.0 | 1364 | $1,650 | $1.21 | 21d | 1 | 1.38mi |
| 2409 Colgate Cir College Station, TX | 5.0 | 3.0 | 1870 | $750 | $0.40 | 43d | 1 | 1.43mi |
| 902 Holik Dr College Station, TX | 3.0 | 2.0 | 2013 | $2,400 | $1.19 | 43d | 1 | 1.45mi |
| 1200 Village Dr College Station, TX | 3.0 | 2.0 | 1443 | $1,750 | $1.21 | 13d | 1 | 1.46mi |
| 1200 Village Dr College Station, TX | 3.0 | 2.0 | 1443 | $1,750 | $1.21 | 21d | 1 | 1.46mi |
| 3211 Sergeant Dr College Station, TX | 4.0 | 4.0 | 1618 | $2,400 | $1.48 | 44d | 1 | 1.48mi |
Listing history 17 events
-
2026-06-18days on market $250,000 Active 36 DOM
-
2026-06-17price $250,000 Active 35 DOM
-
2026-06-17days on market $255,000 Active 35 DOM
-
2026-06-16days on market $255,000 Active 34 DOM
-
2026-06-15days on market $255,000 Active 33 DOM
-
2026-06-14days on market $255,000 Active 31 DOM
-
2026-06-13days on market $255,000 Active 30 DOM
-
2026-06-10days on market $255,000 Active 28 DOM
-
2026-06-09days on market $255,000 Active 27 DOM
-
2026-06-08days on market $255,000 Active 26 DOM
-
2026-06-07days on market $255,000 Active 25 DOM
-
2026-06-05days on market $255,000 Active 22 DOM
-
2026-06-02days on market $255,000 Active 20 DOM
-
2026-06-01days on market $255,000 Active 19 DOM
-
2026-05-31days on market $255,000 Active 18 DOM
-
2026-05-30days on market $255,000 Active 17 DOM
-
2026-05-13$255,000 Active 845-char remark
ⓘ Source: listings_history table (triggers on properties + properties_extension) + one-shot
backfill from property_details.listing_events for pre-trigger history.
Tax reassessment forecast TX · Resets to sale price
- Current annual tax
- $4,994 · $416/mo
- Projected year-2 tax
- $4,994 · $416/mo
- Expected delta
- $0/yr ($0/mo · 0.0%)
ⓘ Screening estimate from a state-policy table — verify with the county assessor before closing.
Climate risk First Street
- Flood 1/10 Low FEMA zone X (unshaded) · 0% chance over 30 yrs
- Wildfire 4/10 Moderate
- Heat 8/10 Severe 7 d/yr ≥110°F today · 24 d/yr by 30 yrs out
- Wind 8/10 Severe 80% chance of damaging wind over 30 yrs
- Air quality 1/10 Low 0 unhealthy d/yr today · 0 by 30 yrs out
Nearby sold comps map
Loading sold comps map…
Walkable amenities ~0.75 mi
Loading nearby amenities…
Taxation est. · year 1
- Rental income
- $29,116
- − Mortgage interest
- −$14,004
- − Property taxes
- −$4,994
- − Insurance
- −$1,250
- − Repairs & maintenance
- −$2,329
- − Management
- −$2,329
- − Depreciation
- −$7,273
- Taxable loss
- −$3,063
- Est. tax savings @ 24.0%
- +$735
- After-tax cash flow
- $1,761/yr
For passive investors: Depreciation is non-cash, so a rental often shows a tax loss while cash-flowing — sheltering income. Rental losses are passive: they offset passive income freely, and up to $25,000/yr can offset ordinary (W-2) income if you actively participate and your MAGI is under $100k (phasing out to $0 by $150k); unused losses carry forward. On sale, claimed depreciation is recaptured at up to 25%, and gains may owe capital-gains tax (a 1031 exchange can defer both). Figures are a year-1 estimate at your 24.0% rate — not tax advice; consult a CPA.
Schools (NCES district)
- District
- College Station ISD
- NCES district ID
- 4807350
- Math proficiency
- 58% ▼ -4.00%
- Reading proficiency
- 54% ▼ -2.00%
- Median HH income
- $36,991
- Composite
- 46.54/100
- National rank
- #2428
- State rank
- #113 of 826 in TX
Livability — College Station
- Score
- 83/100
- State rank
- #11
- US rank
- #994
Category grades
Schools grade is shown separately in the Schools card above.
Census & demographics
- Census place
- College Station, TX
- County
- Brazos County · 233,400 people
- City population
- 131,628
- Metro
- College Station-Bryan, TX
- Population (ZIP)
- 76,764
- Household income
- $88,851
- Rent vs Own
- Severe rent burden
- 3329.0
Population outlook (Brazos County) Hauer SSP2
- Today (2025)
- 267,942 people
- By 2030
- 296,630 · +10.7%
- By 2040
- 354,560 · +32.3%
- By 2050
- 414,616 · +54.7%
- By 2075
- 562,158 · +109.8%
- By 2100
- 678,828 · +153.3%
Race, ethnicity, and origin ACS 2023
- Neighborhood character
- Predominantly White (69%)
- Race & ethnicity
- White 69% Hispanic / Latino 16% Two or more races 9% Asian 8% Black 5%
- Hispanic origin (detail)
- Mexican 12%
- Common ancestry
- Lithuanian 2% Romanian 2% Italian 2%
- Foreign-born
- 11% · Canada, China, South Korea
- Languages at home
- 83% English-only · Spanish 8% Other Indo-European 3% Chinese 2%
Political lean MEDSL · Brazos
- 2024 margin
- Strong R (+24.9) · D 36.9% · R 61.7% · Other 1.4%
- 2008→2024 swing
- +4.1pp toward D · 2008: -28.9pp · 2024: -24.9pp
- All cycles
- 2024: R+24.9 2020: R+14.3 2016: R+23.7 2012: R+35.3 2008: R+28.9
Not yet ingested
- Civics
- —
Market trends
- HPI YoY
- ▼ -133.31%
- Current HPI
- 175.9669
- Rent YoY
- ▲ 3.13%
- Metro
- College Station-Bryan, TX
- State GDP YoY
- ▲ 3.95%
- F500 in state
- 110
Industry mix (Fortune 500 HQ in TX)
| Industry | F500 HQs | Revenue |
|---|---|---|
| Energy | 16 | $1,198B |
|
||
| Technology | 5 | $198B |
|
||
| Engineering / Construction | 4 | $72B |
|
||
| Energy Services | 3 | $60B |
|
||
| Utilities | 3 | $41B |
|
||
| Healthcare | 2 | $330B |
|
||
Price history
-2.0% since first listed2 events — show timeline
- 2026-06-12 Price Changed $250,000 BCSRMLS
- 2026-05-13 Listed $255,000 BCSRMLS
Property tax history
+3.4%/yrLatest (2025): $4,994 · -5.6% YoY. Source: county tax records.
Cash-flow waterfall
monthlySold comps — $/sqft
last 12 mo · ≤1 miLoading sold comps…