 Triplex
238 S 5th Ave · Mount Vernon, NY
Flood risk 1/10 · Minimal
- FEMA flood zone
- X (unshaded)
- Chance of flooding over 30 yrs
- 0.0%
- Est. flood insurance / yr
- $507 – $1,088
Fire risk 1/10 · Minimal
- Est. fire insurance / yr
- $691 – $1,283
Heat risk 6/10 · Moderate
- Hot days now (above 98°F)
- 7 days/yr
- Hot days in 30 yrs
- 15 days/yr
Wind risk 6/10 · Moderate
- Chance of severe wind over 30 yrs
- 27.0%
Air-quality risk 5/10 · Moderate
- Unhealthy air days now
- 6 days/yr
- Unhealthy air days in 30 yrs
- 8 days/yr
Risk factors via First Street. Map © Google.
Why this score? — see what drove the C+ grade
The composite is a weighted blend of 9 inputs, each scored 0–100. Each bar is that input's sub-score; the figure is the points it added to the 100-point composite (weight × sub-score).
- Cash flow +26.2/30.0
- DSCR +8.9/10.0
- 1% rule +8.3/10.0
- ARV discount +7.5/15.0
- Schools +3.7/10.0
- Livability +3.6/5.0
- Rent growth +3.3/5.0
- Condition / age +2.5/5.0
- Appreciation +0.0/10.0
$610,000
🖨 Deal sheet (PDF) 📄 Offer letter ✓ Due diligence
Multi-family units
County records classify this as Multi-Family (2-4 Unit). Listing-text estimate: 3 units. confirmed
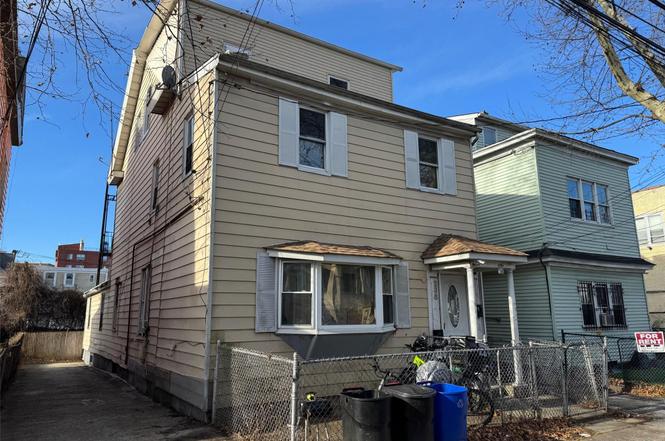
Listing remarks
Occupied detached 3 family home with a long driveway, basement, and small rear yard. Property is occupied and sold subject to them. No access at this time. Please do not disturb occupants. Some work required but awesome potential!
Key facts
- Long driveway
- Small rear yard
- 3,485 sq ft lot
Tags
Property features AI
Finance
- Financial info: Tax year 2025
Exterior
- Parking: Driveway (no carport)
- Utilities: Electricity connected (Con-Edison); Natural gas available; Public sewer; Water connected; Trash collection (public)
- Home design: Triplex
- Construction: Aluminum siding
- Exterior features: Level lot; Not waterfront
Interior
- Bedrooms: Two 3-bedroom units
- Heating & cooling: Baseboard heating; No central cooling
- Interior features: Open kitchen; Partial unfinished basement
Neighborhood map
What this means for you Summary
Snapshot
- This is a 3 × 2-bed/1.0-bath units multifamily listed at $610k.
Deal economics
- At list price, monthly cash flow is $2k ($19k/yr) — positive. Per door: $519/mo.
- The deal already cash-flows at list — no discount required.
- Meets the 1% rule at list price ($8k rent vs $610k).
- Recommended offer: $537k (12.0% below list) — sets the bar for market timing.
- Cap rate 9.4% vs local median 5.2% in Mount Vernon — top-decile yield for the area; either an underpriced asset or a hidden risk that comps aren't pricing in. Stress-test before assuming the spread holds.
Location & tenants
- Location reads 71/100 on livability (#397 in NY) — a middle-class / working-renter tenant base. Strengths: commute A+, health & safety A, employment B; Watch: crime D-, cost of living F.
- Mount Vernon School District (suburban): math 35% / reading 50% proficiency, ranked #485 of 590 in NY (top 82%) — families likely to look elsewhere, expect single-tenant / working-renter base with shorter leases; 62% free/reduced lunch — lower-income household profile, screen leases tightly.
- Zoned schools: Cecil H Parker School (math 12% / reading 32%, grade F, #1,923 of 2,108 statewide, top 92%, 256 students, 80% FRL); Benjamin Turner Middle School (math 8% / reading 32%, grade F, #678 of 729 statewide, top 94%, 196 students, 71% FRL); Mount Vernon High School (math 54% / reading 75%, grade B-, #776 of 1,100 statewide, top 73%, 1,094 students, 76% FRL).
- Market conditions: Rents rising (+3.4%/yr); 130 active listings in the ZIP; 6 comparable units currently listed for rent nearby; rentals at typical pace (median 26d on market — plan ~3-4 weeks tenant-placement turnaround); 954 units permitted in Westchester County in 2024 (649 in 5+ unit buildings).
Forward outlook
- Local home prices are declining (-3.0%/yr); year-one equity from $4k of loan paydown is wiped out by about $18k of value loss. Plan a longer hold.
- Westchester County population projected at +10% by 2050 — modest demand growth; plan on rents tracking national, not racing it.
- At projected returns (-3.0% appreciation + 3.4% rent growth), your $171k cash investment doubles in ~10 years — after that, you're playing with house money.
Negotiation context
- It's been on market 182 days — a 12% lower offer ($537k) is reasonable based on typical stale-listing flexibility.
- 6 sale attempts since 10y ago; this cycle's ask has dropped $90k (13%) from the opening price — seller is motivated, your offer sets the floor, not the list.
- Current owner paid $114k; list at $610k implies a 433% gain — meaningful room to come down on a strong offer.
Risks & watch-outs
- Watch-outs: property tax is 2.8% of price; built in 1930 — expect roof / HVAC / electrical / plumbing capex.
- Climate carrying-cost: major wind risk, 27% chance of damaging wind over 30y; extreme-heat days projected 7→15/yr by 2055 (HVAC capex compounding) — expect insurance premiums to compound above CPI over the hold.
Questions for the listing agent
- It's been on market 182 days. Have you received any prior offers? Is the seller open to a 12% concession, seller financing, or rate buy-down credit?
- Can we see the unit-by-unit rent roll, current vacancy, and any below-market leases? What's the average tenancy length?
- What capital expenditures (roof, boiler, parking lot, exteriors) have been made in the last 5 years, and what's planned in the next 2?
- Built in 1930 — when were the roof, HVAC, electrical panel, plumbing, and water heater last replaced?
- Property tax is high relative to price — has the assessment been appealed recently, and will the sale trigger a re-assessment?
- Why hasn't it sold? Are there any deal-killer items the seller is aware of (foundation, flood, title, zoning, code violations)?
- Is there a deadline driving the sale (1031 exchange, divorce, estate, relocation)? That informs how much negotiation room exists.
- Crime grade is D in this area — have there been break-ins, vandalism, or insurance claims at this property in the last 3 years? What carrier currently insures it and at what premium?
- What's the average days-on-market for RENTAL listings here right now (not sales)? A rising rental-DOM trend means longer vacancies and softer asking-rent achievability than the comps imply.
- What's the recent tenant-quality profile in this submarket — average credit score on applications, eviction rate, late-payment / NSF rate, and stable-employment percentage? A property-management company in the area should have these aggregated.
- How much new apartment / multifamily construction is in the pipeline within 1–3 miles? Heavy new supply (>2% of stock underway) typically softens rents 12–24 months out; light construction supports rent growth.
Investment metrics
- 1% rule
- 1.33% ✓
- Cap rate
- 9.36%
- Cash-on-cash
- 10.95%
- DSCR
- 1.49
- GRM
- 6.3
CMA / ARV
No comps found within radius.
Show comp detail 12 sales within ~0.75 mi
| Address | Dist | Beds/Ba | Sqft | Sold | Price | $/sf | Match |
|---|---|---|---|---|---|---|---|
| 132 East 4th St | 0.36mi | 6/2.0 | 2,800 | 0mo | $700,000 | $250 | 62 |
| 128 E 4th St | 0.35mi | 6/2.0 | — | 2mo | $770,000 | — | 61 |
| 112 S 7th Ave | 0.25mi | 5/3.0 (-1) | 2,200 | 1mo | $445,000 | $202 | 58 |
| 639 S 5th Ave | 0.70mi | 6/— | — | 0mo | $510,000 | — | 54 |
| 4423 Mundy Ln | 0.38mi | 7/3.0 (+1) | — | 1mo | $880,000 | — | 52 |
| 111 S Fulton Ave | 0.52mi | 5/2.0 (-1) | — | 1mo | $415,000 | — | 49 |
| 247 Nuber Ave | 0.68mi | 6/2.0 | — | 1mo | $885,000 | — | 47 |
| 605 S 6th Ave | 0.61mi | 5/2.0 (-1) | — | 0mo | $990,000 | — | 46 |
| 450-452 Franklin Ave | 0.48mi | 7/3.0 (+1) | — | 5mo | $740,000 | — | 44 |
| 557 S 5th Ave | 0.58mi | 5/2.0 (-1) | 1,975 | 4mo | $450,000 | $228 | 44 |
| 4331 Wilder Ave | 0.66mi | 5/2.0 (-1) | 1,574 | 2mo | $803,000 | $510 | 43 |
| 2028 Pitman Ave | 0.71mi | 5/3.0 (-1) | 1,824 | 2mo | $770,000 | $422 | 36 |
Match score weights: distance 35% · size 25% · config 20% · recency 20%. Top-matched comps best support the ARV.
Projected returns pro-forma
-3.0% appreciation · 3.37% rent growth · sell at horizon
- IRR
- 0.6%
- Equity multiple
- 1.02×
- Total profit
- $3,965
- Equity at exit
- $90,953
- IRR
- 10.7%
- Equity multiple
- 1.85×
- Total profit
- $145,907
- Equity at exit
- $52,742
Cash invested: $170,800 (down + closing). Projections, not guarantees.
Landlord ↔ Tenant lean methodology
- Overall (STATE)
- 15 Strongly Tenant-Friendly
- State New York
- 15 Strongly Tenant-Friendly · D+10
- County
- — inherits STATE
- City
- — inherits STATE
ZIP-level market 10550
- Rents YoY
- 3.4%
- Active inventory
- 130
- Price-to-rent
- 18.8×
Monthly cashflow live
- Estimated rent
- $8,120 high interval (Pro) →
- Mortgage (P&I)
- −$3,199
- Tax from tax record
- −$1,403 /mo · $16,839/yr
- Insurance
- −$254
- HOA
- −$0
- Vacancy / Maint / Mgmt
- −$1,705
- Net cashflow
- $1,558
Break-even live
Sensitivity live
| Price | -10% $1,904 | -5% $1,731 | +0% $1,558 | +5% $1,386 | +10% $1,213 |
|---|---|---|---|---|---|
| Rent | -10% $917 | -5% $1,238 | +0% $1,558 | +5% $1,879 | +10% $2,200 |
| Rate | -1.0pp $1,866 | -0.5pp $1,714 | base $1,558 | +0.5pp $1,400 | +1.0pp $1,240 |
3-unit breakdown (identical units grouped — click to expand)
| Units | Beds | Baths | Est. rent |
|---|---|---|---|
| 3× units | 2 | 1 | $8,121 |
| #1 | 2 | 1 | $2,707 |
| #2 | 2 | 1 | $2,707 |
| #3 | 2 | 1 | $2,707 |
| Total (3 units) | $8,120 | ||
UW: 25.0% down · 7.5% · 30yr · 1.5% tax · 5.0% vac · 8.0% maint · 8.0% mgmt
Financing live
Cash to close
- Down payment
- $152,500
- Closing costs
- $18,300
- Reserves months
- —
- Total cash needed
- —
Loan-product check · same deal, 3 products live
Conventional
25% down · 7.5% · 30yr
- Down + closing
- —
- Monthly P&I
- —
- Monthly cashflow
- —
- DSCR
- —
- Eligible?
- —
Personal DTI + credit; lowest rate.
DSCR
20% down · 8.5% · 30yr
- Down + closing
- —
- Monthly P&I
- —
- Monthly cashflow
- —
- DSCR
- —
- Eligible?
- —
No personal income docs; deal must DSCR.
Hard money
10% down · 12.0% · 12mo
- Down + closing
- —
- Monthly P&I
- —
- Monthly cashflow
- —
- DSCR
- —
- Eligible?
- —
Short-term bridge; refi at stabilization.
Rent comps 6 comps
| Address | Beds | Baths | Sqft | Rent | $/sqft | DOM | Units | Dist |
|---|---|---|---|---|---|---|---|---|
| 310 S 7th Ave Mount Vernon, NY | 5.0 | 2.0 | 1000 | $4,800 | $4.80 | 26d | 1 | 0.14mi |
| 142 W 5th St Mount Vernon, NY | 6.0 | 2.0 | 1250 | $3,756 | $3.00 | 20d | 1 | 0.35mi |
| 33 Union Ln Unit 2 Mt Vernon, NY | 5.0 | 1.0 | — | $4,000 | — | 26d | 1 | 0.40mi |
| 33 Union Ln Mount Vernon, NY | 5.0 | 1.0 | 1200 | $4,200 | $3.50 | 26d | 1 | 0.40mi |
| 641 S 5th Ave Unit 2nd/3rd Floor Mt Vernon, NY | 5.0 | 2.0 | 1800 | $3,900 | $2.17 | 6d | 1 | 0.70mi |
| 222 Primrose Ave Unit 2 Mt Vernon, NY | 5.0 | 2.0 | 1900 | $5,250 | $2.76 | 20d | 1 | 1.17mi |
Listing history 33 events
-
2026-06-21days on market $610,000 Active 182 DOM
-
2026-06-18days on market $610,000 Active 179 DOM
-
2026-06-17days on market $610,000 Active 178 DOM
-
2026-06-16days on market $610,000 Active 177 DOM
-
2026-06-15days on market $610,000 Active 176 DOM
-
2026-06-13days on market $610,000 Active 174 DOM
-
2026-06-09days on market $610,000 Active 170 DOM
-
2026-06-08days on market $610,000 Active 169 DOM
-
2026-06-07days on market $610,000 Active 168 DOM
-
2026-06-04days on market $610,000 Active 165 DOM
-
2026-06-03pricedays on market $610,000 Active 164 DOM
-
2026-06-02days on market $650,000 Active 163 DOM
-
2026-06-01days on market $650,000 Active 162 DOM
-
2026-05-31days on market $650,000 Active 161 DOM
-
2026-05-19price $650,000
-
2026-04-24price $625,000
-
2026-03-28price $650,000
-
2025-12-20$700,000 Active
-
2025-09-01historical
-
2025-04-01$755,000 Active
-
2018-10-03historical
-
2018-08-30$629,000 Active
-
2017-01-04price $114,450
-
2017-01-04soldstatus $114,450 Sold
-
2017-01-03soldstatus $114,450
-
2017-01-01historical Pending
-
2016-12-30price $230,000
-
2016-12-21status Active
-
2016-11-08historical Pending
-
2016-10-20$230,000 Active
-
2016-10-20$230,000
-
2006-07-31soldstatus $494,700
-
2001-01-05soldstatus $170,000
ⓘ Source: listings_history table (triggers on properties + properties_extension) + one-shot
backfill from property_details.listing_events for pre-trigger history.
Tax reassessment forecast NY · Partial reset (capped growth)
- Current annual tax
- $16,839 · $1,403/mo
- Projected year-2 tax
- $16,839 · $1,403/mo
- Expected delta
- $0/yr ($0/mo · 0.0%)
ⓘ Screening estimate from a state-policy table — verify with the county assessor before closing.
Climate risk First Street
- Flood 1/10 Low FEMA zone X (unshaded) · 0% chance over 30 yrs
- Wildfire 1/10 Low
- Heat 6/10 Major 7 d/yr ≥98°F today · 15 d/yr by 30 yrs out
- Wind 6/10 Major 27% chance of damaging wind over 30 yrs
- Air quality 5/10 Major 6 unhealthy d/yr today · 8 by 30 yrs out
Nearby sold comps map
Loading sold comps map…
Walkable amenities ~0.75 mi
Loading nearby amenities…
Taxation est. · year 1
- Rental income
- $97,440
- − Mortgage interest
- −$34,169
- − Property taxes
- −$16,839
- − Insurance
- −$3,050
- − Repairs & maintenance
- −$7,795
- − Management
- −$7,795
- − Depreciation
- −$17,745
- Taxable income
- $10,046
- Est. tax owed @ 24.0%
- −$2,411
- After-tax cash flow
- $16,291/yr
For passive investors: Depreciation is non-cash, so a rental often shows a tax loss while cash-flowing — sheltering income. Rental losses are passive: they offset passive income freely, and up to $25,000/yr can offset ordinary (W-2) income if you actively participate and your MAGI is under $100k (phasing out to $0 by $150k); unused losses carry forward. On sale, claimed depreciation is recaptured at up to 25%, and gains may owe capital-gains tax (a 1031 exchange can defer both). Figures are a year-1 estimate at your 24.0% rate — not tax advice; consult a CPA.
Schools (NCES district)
- District
- Mount Vernon School District
- NCES district ID
- 3620100
- Math proficiency
- 35% ▼ -3.00%
- Reading proficiency
- 50% ▲ 6.00%
- Median HH income
- $50,890
- Composite
- 36.59/100
- National rank
- #4631
- State rank
- #485 of 590 in NY
Livability — Mount Vernon
- Score
- 71/100
- State rank
- #397
- US rank
- #6876
Category grades
Schools grade is shown separately in the Schools card above.
Census & demographics
- Census place
- Mount Vernon, NY
- County
- Westchester County · 709,332 people
- City population
- 61,313
- Metro
- New York-Newark-Jersey City, NY-NJ-PA
- Population (ZIP)
- 38,972
- Household income
- $60,701
- Rent vs Own
- Severe rent burden
- 2963.0
Population outlook (Westchester County) Hauer SSP2
- Today (2025)
- 1,028,035 people
- By 2030
- 1,051,636 · +2.3%
- By 2040
- 1,098,520 · +6.9%
- By 2050
- 1,136,044 · +10.5%
- By 2075
- 1,196,925 · +16.4%
- By 2100
- 1,175,147 · +14.3%
Race, ethnicity, and origin ACS 2023
- Neighborhood character
- Predominantly Black (66%)
- Race & ethnicity
- Black 66% Hispanic / Latino 20% Two or more races 12% White 7% Asian 1%
- Hispanic origin (detail)
- Mexican 3% Puerto Rican 5% Dominican 4%
- Common ancestry
- Estonian 2% Hispanic 1% Russian 1%
- Foreign-born
- 34% · Canada, China, Jamaica
- Languages at home
- 73% English-only · Spanish 16% Other Indo-European 4% French/Haitian/Cajun 2%
Political lean MEDSL · Westchester
- 2024 margin
- Strong D (+26.3) · D 63.1% · R 36.9%
- 2008→2024 swing
- -1.3pp toward R · 2008: 27.6pp · 2024: 26.3pp
- All cycles
- 2024: D+26.3 2020: D+36.3 2016: D+32.8 2012: D+22.2 2008: D+27.6
Not yet ingested
- Civics
- —
Market trends
- HPI YoY
- ▼ -140.69%
- Current HPI
- 191.5235
- Rent YoY
- ▲ 3.37%
- Metro
- New York-Newark-Jersey City, NY-NJ-PA
- State GDP YoY
- ▲ 2.60%
- F500 in state
- 92
Industry mix (Fortune 500 HQ in NY)
| Industry | F500 HQs | Revenue |
|---|---|---|
| Financial Services | 10 | $950B |
|
||
| Consumer Goods | 9 | $162B |
|
||
| Insurance | 4 | $225B |
|
||
| Telecommunications | 2 | $144B |
|
||
| Pharmaceuticals | 2 | $112B |
|
||
| Media / Entertainment | 2 | $69B |
|
||
Price history
+282.4% since first listed19 events — show timeline
- 2026-05-19 Price Changed $650,000 OneKey® MLS as Distributed by MLS Grid
- 2026-04-24 Price Changed $625,000 OneKey® MLS as Distributed by MLS Grid
- 2026-03-28 Price Changed $650,000 OneKey® MLS as Distributed by MLS Grid
- 2025-12-20 Listed $700,000 OneKey® MLS as Distributed by MLS Grid
- 2025-09-01 Listing Removed — OneKey® MLS as Distributed by MLS Grid
- 2025-04-01 Listed $755,000 OneKey® MLS as Distributed by MLS Grid
- 2018-10-03 Listing Removed — OneKey® MLS as Distributed by MLS Grid
- 2018-08-30 Listed $629,000 OneKey® MLS as Distributed by MLS Grid
- 2017-01-04 Sold (MLS) $114,450 HGMLS
- 2017-01-04 Price Changed $114,450 HGMLS
- 2017-01-03 Sold (MLS) $114,450 OneKey® MLS as Distributed by MLS Grid
- 2017-01-01 Contingent — HGMLS
- 2016-12-30 Price Changed $230,000 HGMLS
- 2016-12-21 Relisted — HGMLS
- 2016-11-08 Contingent — HGMLS
- 2016-10-20 Listed $230,000 HGMLS
- 2016-10-20 Listed $230,000 OneKey® MLS as Distributed by MLS Grid
- 2006-07-31 Sold (Public Records) $494,700 Public Records
- 2001-01-05 Sold (Public Records) $170,000 Public Records
Property tax history
+8.4%/yrLatest (2025): $16,839 · +2.1% YoY. Source: county tax records.
Cash-flow waterfall
monthlySold comps — $/sqft
last 12 mo · ≤1 miLoading sold comps…