 🏷️ Likely Rental
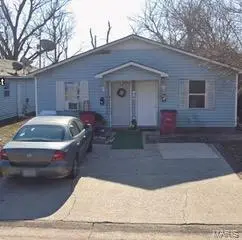
617/619 Daniel St · Sikeston, MO
Flood risk 1/10 · Minimal
- FEMA flood zone
- X
- Chance of flooding over 30 yrs
- 0.0%
- Est. flood insurance / yr
- $507 – $1,088
Fire risk 1/10 · Minimal
- Est. fire insurance / yr
- $1,054 – $1,958
Heat risk 6/10 · Moderate
- Hot days now (above 110°F)
- 7 days/yr
- Hot days in 30 yrs
- 21 days/yr
Wind risk 3/10 · Minor
- Chance of severe wind over 30 yrs
- 4.0%
Air-quality risk 2/10 · Minimal
- Unhealthy air days now
- 0 days/yr
- Unhealthy air days in 30 yrs
- 1 days/yr
Risk factors via First Street. Map © Google.
Why this score? — see what drove the B+ grade
The composite is a weighted blend of 9 inputs, each scored 0–100. Each bar is that input's sub-score; the figure is the points it added to the 100-point composite (weight × sub-score).
- Cash flow +30.0/30.0
- ARV discount +15.0/15.0
- 1% rule +10.0/10.0
- DSCR +10.0/10.0
- Livability +3.2/5.0
- Schools +2.8/10.0
- Rent growth +2.5/5.0
- Condition / age +2.5/5.0
- Appreciation +0.0/10.0
$184,000
🖨 Deal sheet (PDF) 📄 Offer letter ✓ Due diligence
Multi-family units
County records classify this as Multi-Family (2-4 Unit). Listing-text estimate: 1 unit. estimate disagrees with records
Listing remarks MLS
Great investment opportunity featuring two recently remodeled duplexes, offering a total of four 2-bedroom, 1-bath units. These properties have been updated and are ready for immediate occupancy or lease-up. Each unit is thoughtfully laid out with comfortable living spaces, making them attractive to long-term tenants. Three of the four units are currently vacant, providing flexibility for an owner-occupant or the ability to set new market rents. One unit is occupied at $650 per month, with prior rents reaching $750 per unit, demonstrating strong income potential. Whether you're looking to expand your rental portfolio or live in one unit while generating income from the others, this property offers excellent upside and value. Don’t miss this chance to invest in a multi-unit property with proven rental history and room for increased cash flow.
Key facts
- 0.38 acre lot
- Built 1989
- Listed 79 days
Neighborhood map
What this means for you Summary
Snapshot
- This is a 2-bed/1.0-bath multifamily listed at $184k.
Deal economics
- At list price, monthly cash flow is $2k ($19k/yr) — positive.
- The deal already cash-flows at list — no discount required.
- Meets the 1% rule at list price ($3k rent vs $184k).
- Recommended offer: $173k (6.0% below list) — sets the bar for market timing.
- Cap rate 16.4% vs local median 4.0% in Sikeston — top-decile yield for the area; either an underpriced asset or a hidden risk that comps aren't pricing in. Stress-test before assuming the spread holds.
Location & tenants
- Location reads 64/100 on livability (#319 in MO) — a middle-class / working-renter tenant base. Strengths: cost of living A+, housing A+, health & safety A+; Watch: employment D, schools D-, crime F.
- Sikeston R-6 (town): math 33% / reading 34% proficiency, ranked #243 of 324 in MO (top 75%) — families likely to look elsewhere, expect single-tenant / working-renter base with shorter leases; 61% free/reduced lunch — lower-income household profile, screen leases tightly.
- Market conditions: 165 active listings in the ZIP; 1 comparable units currently listed for rent nearby; 123 units permitted in Scott County in 2024 (32 in 5+ unit buildings).
Forward outlook
- Local home prices are declining (-3.0%/yr); year-one equity from $1k of loan paydown is wiped out by about $6k of value loss. Plan a longer hold.
- Scott County population projected at -16% by 2050 — secular population decline; favor cash flow + early exit over multi-decade hold.
- At projected returns (-3.0% appreciation + 3.0% rent growth), your $52k cash investment doubles in ~4 years — after that, you're playing with house money.
Negotiation context
- It's been on market 80 days — a 6% lower offer ($173k) is reasonable based on typical stale-listing flexibility.
- 2 sale attempts; this cycle's ask has dropped $10k (5%) from the opening price — seller is motivated, your offer sets the floor, not the list.
Risks & watch-outs
- Climate carrying-cost: extreme-heat days projected 7→21/yr by 2055 (HVAC capex compounding) — expect insurance premiums to compound above CPI over the hold.
Questions for the listing agent
- It's been on market 80 days. Have you received any prior offers? Is the seller open to a 6% concession, seller financing, or rate buy-down credit?
- Why hasn't it sold? Are there any deal-killer items the seller is aware of (foundation, flood, title, zoning, code violations)?
- Is there a deadline driving the sale (1031 exchange, divorce, estate, relocation)? That informs how much negotiation room exists.
- Schools are D-rated, which usually means shorter tenancies and higher turnover. Who's the typical renter profile here, and what's been the actual vacancy rate?
- Crime grade is F in this area — have there been break-ins, vandalism, or insurance claims at this property in the last 3 years? What carrier currently insures it and at what premium?
- What's the average days-on-market for RENTAL listings here right now (not sales)? A rising rental-DOM trend means longer vacancies and softer asking-rent achievability than the comps imply.
- What's the recent tenant-quality profile in this submarket — average credit score on applications, eviction rate, late-payment / NSF rate, and stable-employment percentage? A property-management company in the area should have these aggregated.
- How much new apartment / multifamily construction is in the pipeline within 1–3 miles? Heavy new supply (>2% of stock underway) typically softens rents 12–24 months out; light construction supports rent growth.
Investment metrics
- 1% rule
- 1.84% ✓
- Cap rate
- 16.43%
- Cash-on-cash
- 36.19%
- DSCR
- 2.61
- GRM
- 4.5
CMA / ARV
- ARV (median comp)
- $242,080
- List price
- $184,000
- Delta
- -23.99%
- Verdict
- UNDERPRICED
- Comps
- 20 within 2.0 mi
Projected returns pro-forma
-3.0% appreciation · 3.0% rent growth · sell at horizon
- IRR
- 31.9%
- Equity multiple
- 2.34×
- Total profit
- $69,100
- Equity at exit
- $27,435
- IRR
- 39.0%
- Equity multiple
- 4.64×
- Total profit
- $187,424
- Equity at exit
- $15,909
Cash invested: $51,520 (down + closing). Projections, not guarantees.
Landlord ↔ Tenant lean methodology
- Overall (STATE)
- 81 Strongly Landlord-Friendly
- State Missouri
- 81 Strongly Landlord-Friendly · R+10
- County
- — inherits STATE
- City
- — inherits STATE
ZIP-level market 63801
- Home prices YoY
- -11.6%
- Active inventory
- 165
- Price-to-rent
- 18.1×
Monthly cashflow live
- Estimated rent
- $3,385 medium interval (Pro) →
- Mortgage (P&I)
- −$965
- Tax from tax record
- −$79 /mo · $946/yr
- Insurance
- −$77
- HOA
- −$0
- Vacancy / Maint / Mgmt
- −$711
- Net cashflow
- $1,554
Break-even live
Sensitivity live
| Price | -10% $1,658 | -5% $1,606 | +0% $1,554 | +5% $1,502 | +10% $1,450 |
|---|---|---|---|---|---|
| Rent | -10% $1,286 | -5% $1,420 | +0% $1,554 | +5% $1,687 | +10% $1,821 |
| Rate | -1.0pp $1,646 | -0.5pp $1,601 | base $1,554 | +0.5pp $1,506 | +1.0pp $1,458 |
4-unit breakdown (identical units grouped — click to expand)
| Units | Beds | Baths | Est. rent |
|---|---|---|---|
| 4× units | 2 | 1 | $3,384 |
| #1 | 2 | 1 | $846 |
| #2 | 2 | 1 | $846 |
| #3 | 2 | 1 | $846 |
| #4 | 2 | 1 | $846 |
| Total (4 units) | $3,385 | ||
UW: 25.0% down · 7.5% · 30yr · 1.5% tax · 5.0% vac · 8.0% maint · 8.0% mgmt
Financing live
Cash to close
- Down payment
- $46,000
- Closing costs
- $5,520
- Reserves months
- —
- Total cash needed
- —
Loan-product check · same deal, 3 products live
Conventional
25% down · 7.5% · 30yr
- Down + closing
- —
- Monthly P&I
- —
- Monthly cashflow
- —
- DSCR
- —
- Eligible?
- —
Personal DTI + credit; lowest rate.
DSCR
20% down · 8.5% · 30yr
- Down + closing
- —
- Monthly P&I
- —
- Monthly cashflow
- —
- DSCR
- —
- Eligible?
- —
No personal income docs; deal must DSCR.
Hard money
10% down · 12.0% · 12mo
- Down + closing
- —
- Monthly P&I
- —
- Monthly cashflow
- —
- DSCR
- —
- Eligible?
- —
Short-term bridge; refi at stabilization.
Rent comps 1 comps
| Address | Beds | Baths | Sqft | Rent | $/sqft | DOM | Units | Dist |
|---|---|---|---|---|---|---|---|---|
| 1203 - 1207 Lawrence Sikeston, MO | 2.0 | 1.5 | 1100 | $890 | $0.81 | 46d | 1 | 0.80mi |
Listing history 20 events
-
2026-06-22days on market $184,000 Active 80 DOM
-
2026-06-19days on market $184,000 Active 77 DOM
-
2026-06-18days on market $184,000 Active 76 DOM
-
2026-06-17days on market $184,000 Active 75 DOM
-
2026-06-16days on market $184,000 Active 74 DOM
-
2026-06-15days on market $184,000 Active 73 DOM
-
2026-06-14days on market $184,000 Active 71 DOM
-
2026-06-13days on market $184,000 Active 70 DOM
-
2026-06-10days on market $184,000 Active 68 DOM
-
2026-06-09days on market $184,000 Active 67 DOM
-
2026-06-09price $184,000 Active 66 DOM
-
2026-06-08days on market $194,000 Active 66 DOM
-
2026-06-07days on market $194,000 Active 65 DOM
-
2026-06-05days on market $194,000 Active 62 DOM
-
2026-05-31days on market $194,000 Active 61 DOM
-
2026-05-30days on market $194,000 Active 60 DOM
-
2026-04-14status Active 861-char remark
Show marketing remark (861 chars)
Great investment opportunity featuring two recently remodeled duplexes, offering a total of four 2-bedroom, 1-bath units. These properties have been updated and are ready for immediate occupancy or lease-up. Each unit is thoughtfully laid out with comfortable living spaces, making them attractive to long-term tenants. Three of the four units are currently vacant, providing flexibility for an owner-occupant or the ability to set new market rents. One unit is occupied at $650 per month, with prior rents reaching $750 per unit, demonstrating strong income potential. Whether you're looking to expand your rental portfolio or live in one unit while generating income from the others, this property offers excellent upside and value. Don’t miss this chance to invest in a multi-unit property with proven rental history and room for increased cash flow.
-
2026-04-01status Pending 861-char remark
Show marketing remark (861 chars)
Great investment opportunity featuring two recently remodeled duplexes, offering a total of four 2-bedroom, 1-bath units. These properties have been updated and are ready for immediate occupancy or lease-up. Each unit is thoughtfully laid out with comfortable living spaces, making them attractive to long-term tenants. Three of the four units are currently vacant, providing flexibility for an owner-occupant or the ability to set new market rents. One unit is occupied at $650 per month, with prior rents reaching $750 per unit, demonstrating strong income potential. Whether you're looking to expand your rental portfolio or live in one unit while generating income from the others, this property offers excellent upside and value. Don’t miss this chance to invest in a multi-unit property with proven rental history and room for increased cash flow.
-
2026-03-18$194,000 Active 861-char remark
Show marketing remark (861 chars)
Great investment opportunity featuring two recently remodeled duplexes, offering a total of four 2-bedroom, 1-bath units. These properties have been updated and are ready for immediate occupancy or lease-up. Each unit is thoughtfully laid out with comfortable living spaces, making them attractive to long-term tenants. Three of the four units are currently vacant, providing flexibility for an owner-occupant or the ability to set new market rents. One unit is occupied at $650 per month, with prior rents reaching $750 per unit, demonstrating strong income potential. Whether you're looking to expand your rental portfolio or live in one unit while generating income from the others, this property offers excellent upside and value. Don’t miss this chance to invest in a multi-unit property with proven rental history and room for increased cash flow.
-
2017-05-26soldstatus
ⓘ Source: listings_history table (triggers on properties + properties_extension) + one-shot
backfill from property_details.listing_events for pre-trigger history.
Tax reassessment forecast MO · Resets to sale price
- Current annual tax
- $946 · $79/mo
- Projected year-2 tax
- $1,785 · $149/mo
- Expected delta
- +$839/yr (+$70/mo · 88.6%)
ⓘ Screening estimate from a state-policy table — verify with the county assessor before closing.
Climate risk First Street
- Flood 1/10 Low FEMA zone X · 0% chance over 30 yrs
- Wildfire 1/10 Low
- Heat 6/10 Major 7 d/yr ≥110°F today · 21 d/yr by 30 yrs out
- Wind 3/10 Moderate 4% chance of damaging wind over 30 yrs
- Air quality 2/10 Low 0 unhealthy d/yr today · 1 by 30 yrs out
Nearby sold comps map
Loading sold comps map…
Walkable amenities ~0.75 mi
Loading nearby amenities…
Taxation est. · year 1
- Rental income
- $40,620
- − Mortgage interest
- −$10,307
- − Property taxes
- −$946
- − Insurance
- −$920
- − Repairs & maintenance
- −$3,250
- − Management
- −$3,250
- − Depreciation
- −$5,353
- Taxable income
- $16,595
- Est. tax owed @ 24.0%
- −$3,983
- After-tax cash flow
- $14,662/yr
For passive investors: Depreciation is non-cash, so a rental often shows a tax loss while cash-flowing — sheltering income. Rental losses are passive: they offset passive income freely, and up to $25,000/yr can offset ordinary (W-2) income if you actively participate and your MAGI is under $100k (phasing out to $0 by $150k); unused losses carry forward. On sale, claimed depreciation is recaptured at up to 25%, and gains may owe capital-gains tax (a 1031 exchange can defer both). Figures are a year-1 estimate at your 24.0% rate — not tax advice; consult a CPA.
Schools (NCES district)
- District
- Sikeston R-6
- NCES district ID
- 2928260
- Math proficiency
- 33% ▼ -4.00%
- Reading proficiency
- 34% ▼ -2.00%
- Median HH income
- $36,800
- Composite
- 27.85/100
- National rank
- #6879
- State rank
- #243 of 324 in MO
Livability — Sikeston
- Score
- 64/100
- State rank
- #319
- US rank
- #14606
Category grades
Schools grade is shown separately in the Schools card above.
Census & demographics
- Census place
- Sikeston, MO
- Population (ZIP)
- 22,121
Population outlook (Scott County) Hauer SSP2
- Today (2025)
- 37,964 people
- By 2030
- 36,963 · -2.6%
- By 2040
- 34,632 · -8.8%
- By 2050
- 32,024 · -15.6%
- By 2075
- 25,250 · -33.5%
- By 2100
- 18,078 · -52.4%
Race, ethnicity, and origin ACS 2023
- Neighborhood character
- Predominantly White (73%)
- Race & ethnicity
- White 73% Black 19% Two or more races 6% Hispanic / Latino 2%
- Common ancestry
- Slovak 2% Lithuanian 1% Italian 1%
- Foreign-born
- 1% · Canada
- Languages at home
- 96% English-only · Spanish 2% Other Indo-European 1%
Political lean MEDSL · Scott
- 2024 margin
- Solid R (+58.9) · D 20.2% · R 79.2%
- 2008→2024 swing
- -29.5pp toward R · 2008: -29.4pp · 2024: -58.9pp
- All cycles
- 2024: R+58.9 2020: R+56.5 2016: R+55.6 2012: R+38.2 2008: R+29.4
Not yet ingested
- Civics
- —
Market trends
- HPI YoY
- ▼ -18.54%
- Current HPI
- 141.0868
- Rent YoY
- —
- Metro
- —
- State GDP YoY
- ▲ 1.84%
- F500 in state
- 20
Industry mix (Fortune 500 HQ in MO)
| Industry | F500 HQs | Revenue |
|---|---|---|
| Healthcare | 1 | $163B |
|
||
| Insurance | 1 | $21B |
|
||
| Industrial Technology | 1 | $17B |
|
||
| Retail | 1 | $16B |
|
||
| Industrial Distribution | 1 | $10B |
|
||
| Utilities | 1 | $9B |
|
||
Price history
4 events — show timeline
- 2026-04-14 Relisted — MARIS as Distributed by MLS Grid
- 2026-04-01 Pending — MARIS as Distributed by MLS Grid
- 2026-03-18 Listed $194,000 MARIS as Distributed by MLS Grid
- 2017-05-26 Sold (Public Records) — Public Records
Property tax history
+2.7%/yrLatest (2025): $946 · +30.3% YoY. Source: county tax records.
Cash-flow waterfall
monthlySold comps — $/sqft
last 12 mo · ≤1 miLoading sold comps…