15 Dali Ct · Fairfield, CA
Flood risk 1/10 · Minimal
- FEMA flood zone
- X (unshaded)
- Chance of flooding over 30 yrs
- 0.0%
- Est. flood insurance / yr
- $507 – $1,088
Fire risk 7/10 · Major
- Est. fire insurance / yr
- $659 – $1,223
Heat risk 5/10 · Moderate
- Hot days now (above 99°F)
- 7 days/yr
- Hot days in 30 yrs
- 14 days/yr
Wind risk 1/10 · Minimal
- Chance of severe wind over 30 yrs
- —
Air-quality risk 10/10 · Severe
- Unhealthy air days now
- 21 days/yr
- Unhealthy air days in 30 yrs
- 22 days/yr
Risk factors via First Street. Map © Google.
Why this score? — see what drove the C+ grade
The composite is a weighted blend of 9 inputs, each scored 0–100. Each bar is that input's sub-score; the figure is the points it added to the 100-point composite (weight × sub-score).
- Cash flow +30.0/30.0
- DSCR +10.0/10.0
- 1% rule +8.9/10.0
- Schools +3.5/10.0
- Livability +3.4/5.0
- Condition / age +2.5/5.0
- Rent growth +2.4/5.0
- ARV discount +0.1/15.0
- Appreciation +0.0/10.0
$166,000
🖨 Deal sheet (PDF) 📄 Offer letter ✓ Due diligence
Listing remarks MLS
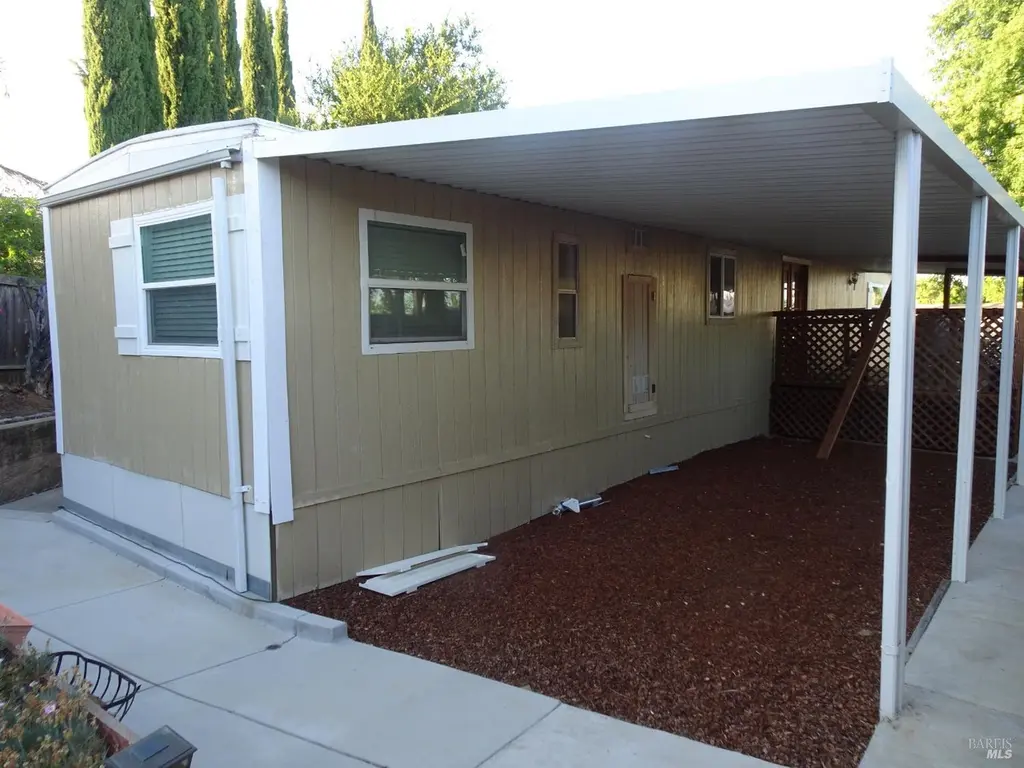
Affordable Remodeled Single Wide. Situated in the Hills of the Desirable Casa Nova Mobile Home Park. 3 Car Carport, 2 Covered Porches. Wood Front Porch & Wooden Railed. Remodeled Rear Porch with New Entrance Way. Quiet Cul-De-Sac with Partial View of Hills. 720 Sq Ft Single Wide 12 X 60. Exterior & Interior Remodel. 2 Bedrooms & 1 Full Bath & 1/2 Bath. Updated Kitchen with New Appliances, Renovated Counter Tops, GE 5 Burner Gas Range with Newer Whirlpool Microwave Over Range. Dual Door Frigidaire Refrigerator Conveys. New GE Dishwasher. Large Deep Karran Quartz Sink by Kitchen Window with Pull Out Faucet. Newer Kitchen Cabinetry. Pantry Cabinets. New Kitchen Vinyl Flooring. Samsung Stackable Washer, Dryer. Dual Pane Windows Throughout. Views of Hills. Remodeled Front Hall Bathroom with New Shower Enclosure. New Vanities & New Toilets, New Bathroom Vinyl Flooring. New Carpeting in Both Bedrooms & Hallway. Newly Painted Textured Walls. Newer Baseboards, Window Trim & Window Casings. Newer Switches, Plugs & Face Plates Throughout. Pex Plumbing. Open Concept Kitchen & Living Room. Newer Central Heat & Air Conditioning. Metal Roof. Water Heater Replaced in 2019. 10 Ft High 8 X 8 Wooden Storage Shed. Low Maintenance Landscaping. Garden Area in the Fenced Private Backyard.
Key facts
- Remodeled rear porch
- Quiet cul-de-sac
- Wood front porch
Tags
Neighborhood map
What this means for you Summary
Snapshot
- This is a 2-bed/1.5-bath manufactured listed at $166k.
Deal economics
- At list price, monthly cash flow is $671 ($8k/yr) — positive.
- The deal already cash-flows at list — no discount required.
- Meets the 1% rule at list price ($2k rent vs $166k).
- Recommended offer: $146k (12.0% below list) — sets the bar for market timing.
- Cap rate 11.1% vs local median 3.0% in Fairfield — top-decile yield for the area; either an underpriced asset or a hidden risk that comps aren't pricing in. Stress-test before assuming the spread holds.
Location & tenants
- Location reads 67/100 on livability (#314 in CA) — a middle-class / working-renter tenant base. Strengths: employment A+, housing A+, health & safety A+; Watch: schools C-, crime D-, commute F.
- Fairfield-Suisun Unified (urban): math 23% / reading 53% proficiency, ranked #238 of 517 in CA (top 46%) — families likely to look elsewhere, expect single-tenant / working-renter base with shorter leases.
- Market conditions: Rents soft (-0.3%/yr); 146 active listings in the ZIP; 9 comparable units currently listed for rent nearby; rentals at typical pace (median 15d on market — plan ~3-4 weeks tenant-placement turnaround); high-income renter base; 1,472 units permitted in Solano County in 2024 (131 in 5+ unit buildings).
Forward outlook
- Local home prices are declining (-3.0%/yr); year-one equity from $1k of loan paydown is wiped out by about $5k of value loss. Plan a longer hold.
- Solano County population projected at +15% by 2050 — modest demand growth; plan on rents tracking national, not racing it.
- At projected returns (-3.0% appreciation + 0.0% rent growth), your $46k cash investment doubles in ~10 years — after that, you're playing with house money.
Negotiation context
- It's been on market 265 days — a 12% lower offer ($146k) is reasonable based on typical stale-listing flexibility.
Risks & watch-outs
- Climate carrying-cost: major wildfire risk; extreme-heat days projected 7→14/yr by 2055 (HVAC capex compounding) — expect insurance premiums to compound above CPI over the hold.
Questions for the listing agent
- It's been on market 265 days. Have you received any prior offers? Is the seller open to a 12% concession, seller financing, or rate buy-down credit?
- Built in 1978 — when were the roof, HVAC, electrical panel, plumbing, and water heater last replaced?
- Why hasn't it sold? Are there any deal-killer items the seller is aware of (foundation, flood, title, zoning, code violations)?
- Is there a deadline driving the sale (1031 exchange, divorce, estate, relocation)? That informs how much negotiation room exists.
- Crime grade is D in this area — have there been break-ins, vandalism, or insurance claims at this property in the last 3 years? What carrier currently insures it and at what premium?
- What's the average days-on-market for RENTAL listings here right now (not sales)? A rising rental-DOM trend means longer vacancies and softer asking-rent achievability than the comps imply.
- What's the recent tenant-quality profile in this submarket — average credit score on applications, eviction rate, late-payment / NSF rate, and stable-employment percentage? A property-management company in the area should have these aggregated.
- How much new for-sale + rental construction is in the pipeline within 1–3 miles? Heavy new supply typically softens prices + rents 12–24 months out; constrained supply supports both.
Investment metrics
- 1% rule
- 1.39% ✓
- Cap rate
- 11.15%
- Cash-on-cash
- 17.34%
- DSCR
- 1.77
- GRM
- 6.0
CMA / ARV
- ARV (median comp)
- $142,500
- List price
- $166,000
- Delta
- 16.49%
- Verdict
- OVERPRICED
- Comps
- 6 within 1.0 mi
Show comp detail 5 sales within ~0.75 mi
| Address | Dist | Beds/Ba | Sqft | Sold | Price | $/sf | Match |
|---|---|---|---|---|---|---|---|
| 41 Goya Dr | 0.14mi | 2/1.0 | 720 (0%) | 0mo | $135,000 | $188 | 91 |
| 17 Dali Ct | 0.06mi | 2/1.0 | 768 (+7%) | 5mo | $65,000 | $85 | 80 |
| 13 Dali Ct | 0.10mi | 2/2.0 | 720 (0%) | 20mo | $118,000 | $164 | 76 |
| 7 Dali Ct | 0.04mi | 2/2.0 | 776 (+8%) | 18mo | $125,900 | $162 | 68 |
| 123 Goya Dr | 0.16mi | 2/1.0 | 643 (-11%) | 20mo | $113,000 | $176 | 56 |
Match score weights: distance 35% · size 25% · config 20% · recency 20%. Top-matched comps best support the ARV.
Projected returns pro-forma
-3.0% appreciation · 0.0% rent growth · sell at horizon
- IRR
- 5.3%
- Equity multiple
- 1.20×
- Total profit
- $9,157
- Equity at exit
- $24,751
- IRR
- 11.8%
- Equity multiple
- 1.80×
- Total profit
- $37,112
- Equity at exit
- $14,353
Cash invested: $46,480 (down + closing). Projections, not guarantees.
Landlord ↔ Tenant lean methodology
- Overall (STATE)
- 18 Strongly Tenant-Friendly
- State California
- 18 Strongly Tenant-Friendly · D+13
- County
- — inherits STATE
- City
- — inherits STATE
ZIP-level market 94534
- Rents YoY
- -0.3%
- Active inventory
- 146
- Price-to-rent
- 6.0×
Monthly cashflow live
- Estimated rent
- $2,302 high interval (Pro) →
- Mortgage (P&I)
- −$871
- Tax est. 1.5%
- −$208 /mo · $2,490/yr
- Insurance
- −$69
- HOA
- −$0
- Vacancy / Maint / Mgmt
- −$483
- Net cashflow
- $671
Break-even live
Sensitivity live
| Price | -10% $786 | -5% $729 | +0% $671 | +5% $614 | +10% $557 |
|---|---|---|---|---|---|
| Rent | -10% $490 | -5% $581 | +0% $671 | +5% $762 | +10% $853 |
| Rate | -1.0pp $755 | -0.5pp $714 | base $671 | +0.5pp $628 | +1.0pp $585 |
UW: 25.0% down · 7.5% · 30yr · 1.5% tax · 5.0% vac · 8.0% maint · 8.0% mgmt
Financing live
Cash to close
- Down payment
- $41,500
- Closing costs
- $4,980
- Reserves months
- —
- Total cash needed
- —
Loan-product check · same deal, 3 products live
Conventional
25% down · 7.5% · 30yr
- Down + closing
- —
- Monthly P&I
- —
- Monthly cashflow
- —
- DSCR
- —
- Eligible?
- —
Personal DTI + credit; lowest rate.
DSCR
20% down · 8.5% · 30yr
- Down + closing
- —
- Monthly P&I
- —
- Monthly cashflow
- —
- DSCR
- —
- Eligible?
- —
No personal income docs; deal must DSCR.
Hard money
10% down · 12.0% · 12mo
- Down + closing
- —
- Monthly P&I
- —
- Monthly cashflow
- —
- DSCR
- —
- Eligible?
- —
Short-term bridge; refi at stabilization.
Rent comps 9 comps
| Address | Beds | Baths | Sqft | Rent | $/sqft | DOM | Units | Dist |
|---|---|---|---|---|---|---|---|---|
| 2550 Hilborn Rd Fairfield, CA | 1.0–2.0 | 1.0–2.0 | 870 | $2,563 | $2.95 | 15d | 16 | 0.34mi |
| 2376 Fairfield Ave Fairfield, CA | 1.0 | 1.0 | 620 | $2,174 | $3.51 | 15d | 2 | 0.54mi |
| 2323 Fairfield Ave Fairfield, CA | 1.0 | 1.0 | 620 | $1,901 | $3.07 | 24d | 5 | 0.56mi |
| 2355 Fairfield Ave Fairfield, CA | 1.0 | 1.0 | 769 | $1,740 | $2.26 | 15d | 3 | 0.56mi |
| 1111 Alaska Ave Fairfield, CA | 1.0–2.0 | 1.0 | 787 | $2,249 | $2.86 | 15d | 10 | 0.57mi |
| 100 Hawthorn Dr Fairfield, CA | 1.0–2.0 | 1.0 | 726 | $2,249 | $3.10 | 15d | 11 | 0.58mi |
| 2215 Peach Tree Dr Fairfield, CA | 1.0–2.0 | 1.0 | 701 | $2,375 | $3.39 | 15d | 3 | 0.81mi |
| 319 E Tabor Ave Fairfield, CA | 1.0–2.0 | 1.0 | 625 | $2,111 | $3.38 | 22d | 4 | 1.33mi |
| 1712 Arthur Ct Unit 1712A Fairfield, CA | 2.0 | 1.0 | 740 | $1,800 | $2.43 | 22d | 1 | 1.46mi |
Listing history 15 events
-
2026-06-18days on market $166,000 Active 265 DOM
-
2026-06-17days on market $166,000 Active 264 DOM
-
2026-06-16days on market $166,000 Active 263 DOM
-
2026-06-15days on market $166,000 Active 262 DOM
-
2026-06-14days on market $166,000 Active 260 DOM
-
2026-06-10days on market $166,000 Active 257 DOM
-
2026-06-09days on market $166,000 Active 256 DOM
-
2026-06-08days on market $166,000 Active 255 DOM
-
2026-06-07days on market $166,000 Active 254 DOM
-
2026-06-03days on market $166,000 Active 250 DOM
-
2026-06-02days on market $166,000 Active 249 DOM
-
2026-06-01days on market $166,000 Active 248 DOM
-
2026-05-31days on market $166,000 Active 247 DOM
-
2026-05-30days on market $166,000 Active 246 DOM
-
2025-09-26$166,000 Active 1328-char remark
Show marketing remark (1328 chars)
Affordable Remodeled Single Wide. Situated in the Hills of the Desirable Casa Nova Mobile Home Park. 3 Car Carport, 2 Covered Porches. Wood Front Porch & Wooden Railed. Remodeled Rear Porch with New Entrance Way. Quiet Cul-De-Sac with Partial View of Hills. 720 Sq Ft Single Wide 12 X 60. Exterior & Interior Remodel. 2 Bedrooms & 1 Full Bath & 1/2 Bath. Updated Kitchen with New Appliances, Renovated Counter Tops, GE 5 Burner Gas Range with Newer Whirlpool Microwave Over Range. Dual Door Frigidaire Refrigerator Conveys. New GE Dishwasher. Large Deep Karran Quartz Sink by Kitchen Window with Pull Out Faucet. Newer Kitchen Cabinetry. Pantry Cabinets. New Kitchen Vinyl Flooring. Samsung Stackable Washer, Dryer. Dual Pane Windows Throughout. Views of Hills. Remodeled Front Hall Bathroom with New Shower Enclosure. New Vanities & New Toilets, New Bathroom Vinyl Flooring. New Carpeting in Both Bedrooms & Hallway. Newly Painted Textured Walls. Newer Baseboards, Window Trim & Window Casings. Newer Switches, Plugs & Face Plates Throughout. Pex Plumbing. Open Concept Kitchen & Living Room. Newer Central Heat & Air Conditioning. Metal Roof. Water Heater Replaced in 2019. 10 Ft High 8 X 8 Wooden Storage Shed. Low Maintenance Landscaping. Garden Area in the Fenced Private Backyard.
ⓘ Source: listings_history table (triggers on properties + properties_extension) + one-shot
backfill from property_details.listing_events for pre-trigger history.
Climate risk First Street
- Flood 1/10 Low FEMA zone X (unshaded) · 0% chance over 30 yrs
- Wildfire 7/10 Severe
- Heat 5/10 Major 7 d/yr ≥99°F today · 14 d/yr by 30 yrs out
- Wind 1/10 Low
- Air quality 10/10 Extreme 21 unhealthy d/yr today · 22 by 30 yrs out
Nearby sold comps map
Loading sold comps map…
Walkable amenities ~0.75 mi
Loading nearby amenities…
Taxation est. · year 1
- Rental income
- $27,626
- − Mortgage interest
- −$9,299
- − Property taxes
- −$2,490
- − Insurance
- −$830
- − Repairs & maintenance
- −$2,210
- − Management
- −$2,210
- − Depreciation
- −$4,829
- Taxable income
- $5,758
- Est. tax owed @ 24.0%
- −$1,382
- After-tax cash flow
- $6,676/yr
For passive investors: Depreciation is non-cash, so a rental often shows a tax loss while cash-flowing — sheltering income. Rental losses are passive: they offset passive income freely, and up to $25,000/yr can offset ordinary (W-2) income if you actively participate and your MAGI is under $100k (phasing out to $0 by $150k); unused losses carry forward. On sale, claimed depreciation is recaptured at up to 25%, and gains may owe capital-gains tax (a 1031 exchange can defer both). Figures are a year-1 estimate at your 24.0% rate — not tax advice; consult a CPA.
Schools (NCES district)
- District
- Fairfield-Suisun Unified
- NCES district ID
- 0613360
- Math proficiency
- 23% ▼ -10.00%
- Reading proficiency
- 53% ▲ 8.00%
- Median HH income
- $69,654
- Composite
- 34.59/100
- National rank
- #5157
- State rank
- #238 of 517 in CA
Livability — Fairfield
- Score
- 67/100
- State rank
- #314
- US rank
- #10551
Category grades
Schools grade is shown separately in the Schools card above.
Census & demographics
- Census place
- Fairfield, CA
- County
- Solano County · 433,239 people
- City population
- 120,008
- Metro
- Vallejo, CA
- Population (ZIP)
- 41,203
- Household income
- $140,198
- Rent vs Own
- Severe rent burden
- 803.0
Population outlook (Solano County) Hauer SSP2
- Today (2025)
- 478,685 people
- By 2030
- 497,974 · +4.0%
- By 2040
- 528,515 · +10.4%
- By 2050
- 549,115 · +14.7%
- By 2075
- 587,229 · +22.7%
- By 2100
- 571,378 · +19.4%
Race, ethnicity, and origin ACS 2023
- Neighborhood character
- Highly diverse neighborhood (Simpson 0.76)
- Race & ethnicity
- White 38% Asian 24% Hispanic / Latino 17% Two or more races 14% Black 12% Pacific Islander 2%
- Hispanic origin (detail)
- Mexican 13%
- Common ancestry
- Italian 6% Lithuanian 2% Russian 1%
- Foreign-born
- 20% · Canada, China, South Korea
- Languages at home
- 75% English-only · Spanish 9% Tagalog/Filipino 6% Chinese 3%
Political lean MEDSL · Solano
- 2024 margin
- Strong D (+23.0) · D 60.0% · R 37.1% · Other 2.9%
- 2008→2024 swing
- -5.6pp toward R · 2008: 28.6pp · 2024: 23.0pp
- All cycles
- 2024: D+23.0 2020: D+30.3 2016: D+30.5 2012: D+28.1 2008: D+28.6
Not yet ingested
- Civics
- —
Market trends
- HPI YoY
- ▼ -360.51%
- Current HPI
- 236.509
- Rent YoY
- ▼ -0.35%
- Metro
- Vallejo, CA
- State GDP YoY
- ▲ 3.21%
- F500 in state
- 116
Industry mix (Fortune 500 HQ in CA)
| Industry | F500 HQs | Revenue |
|---|---|---|
| Technology | 27 | $1,492B |
|
||
| Financial Services | 3 | $174B |
|
||
| Retail | 3 | $44B |
|
||
| Insurance | 3 | $26B |
|
||
| Media / Entertainment | 2 | $115B |
|
||
| Pharmaceuticals / Biotech | 2 | $62B |
|
||
Price history
1 event — show timeline
- 2025-09-26 Listed $166,000 BAREIS
Cash-flow waterfall
monthlySold comps — $/sqft
last 12 mo · ≤1 miLoading sold comps…