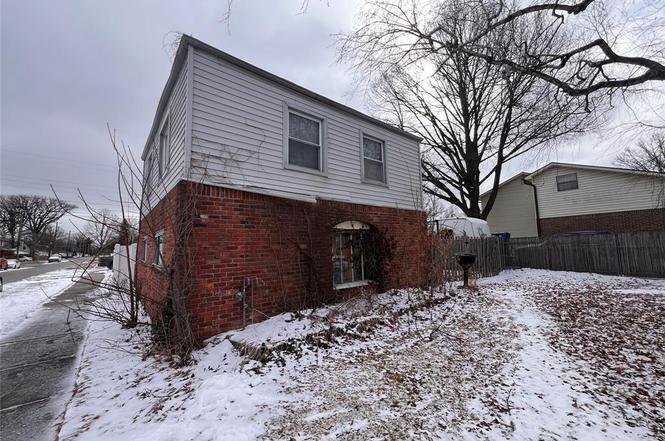
4401 Hipp St · Dearborn Heights, MI
Flood risk 5/10 · Moderate
- FEMA flood zone
- AE
- Chance of flooding over 30 yrs
- 0.64%
- Est. flood insurance / yr
- $1,737 – $8,500
Fire risk 1/10 · Minimal
- Est. fire insurance / yr
- $784 – $1,456
Heat risk 3/10 · Minor
- Hot days now (above 98°F)
- 7 days/yr
- Hot days in 30 yrs
- 14 days/yr
Wind risk 2/10 · Minimal
- Chance of severe wind over 30 yrs
- —
Air-quality risk 3/10 · Minor
- Unhealthy air days now
- 2 days/yr
- Unhealthy air days in 30 yrs
- 4 days/yr
Risk factors via First Street. Map © Google.
Why this score? — see what drove the B- grade
The composite is a weighted blend of 9 inputs, each scored 0–100. Each bar is that input's sub-score; the figure is the points it added to the 100-point composite (weight × sub-score).
- Cash flow +30.0/30.0
- 1% rule +10.0/10.0
- DSCR +10.0/10.0
- ARV discount +7.5/15.0
- Livability +4.0/5.0
- Rent growth +3.0/5.0
- Condition / age +2.5/5.0
- Schools +1.7/10.0
- Appreciation +0.0/10.0
$85,000
🖨 Deal sheet 📄 Offer letter ✓ Due diligence
Listing remarks MLS
Investment opportunity Built in equity
Key facts
- 6,534 sq ft lot
- Garage
- Built 1939
Neighborhood map
What this means for you Summary
Snapshot
- This is a 3-bed/1.5-bath single-family listed at $85k.
Deal economics
- At list price, monthly cash flow is $284 ($3k/yr) — positive.
- The deal already cash-flows at list — no discount required.
- Meets the 1% rule at list price ($2k rent vs $85k).
- Recommended offer: $84k (1.5% below list) — sets the bar for market timing.
- Cap rate 16.3% vs local median 5.5% in Dearborn Heights — top-decile yield for the area; either an underpriced asset or a hidden risk that comps aren't pricing in. Stress-test before assuming the spread holds.
Location & tenants
- Location reads 79/100 on livability (#82 in MI, #1,885 nationally) — a middle-class / working-renter tenant base. Strengths: commute A+, cost of living A+, housing A+; Watch: schools C-, crime D+, employment D+.
- Dearborn Heights School District #7 (suburban): math 13% / reading 26% proficiency, ranked #466 of 540 in MI (top 86%) — low school quality limits family demand, transient renter base, plan for 1-2y turnover; 60% free/reduced lunch — lower-income household profile, screen leases tightly.
- Market conditions: Rents rising (+2.0%/yr); 137 active listings in the ZIP; 17 comparable units currently listed for rent nearby; rentals leasing fast (median 11d on market — plan ~1-2 weeks tenant-placement turnaround); 2,639 units permitted in Wayne County in 2024 (1,216 in 5+ unit buildings).
- This rent runs 33% of the median local income ($60k/yr) — at the standard rent-burdened threshold; future hikes will face affordability resistance.
Forward outlook
- Local home prices are declining (-3.0%/yr); year-one equity from $588 of loan paydown is wiped out by about $3k of value loss. Plan a longer hold.
- Wayne County population projected at -17% by 2050 — secular population decline; favor cash flow + early exit over multi-decade hold.
- At projected returns (-3.0% appreciation + 2.0% rent growth), your $24k cash investment doubles in ~10 years — after that, you're playing with house money.
Negotiation context
- It's been on market 23 days — a 2% lower offer ($84k) is reasonable based on typical stale-listing flexibility.
- 4 sale attempts since 32y ago with the ask held roughly flat each time — persistent listings suggest the price (not the market) is what's stuck; bring a comps-based counter.
- Current owner paid $55k; list at $85k implies a 55% gain — meaningful room to come down on a strong offer.
Risks & watch-outs
- Watch-outs: flood insurance adds $427/mo; built in 1939 — expect roof / HVAC / electrical / plumbing capex.
- Climate carrying-cost: in FEMA flood zone AE (mandatory federal flood insurance) — expect insurance premiums to compound above CPI over the hold.
Questions for the listing agent
- Built in 1939 — when were the roof, HVAC, electrical panel, plumbing, and water heater last replaced?
- What's the actual annual flood-insurance premium (NFIP or private), and is the property in a SFHA with mandatory coverage?
- Is there a deadline driving the sale (1031 exchange, divorce, estate, relocation)? That informs how much negotiation room exists.
- Crime grade is D in this area — have there been break-ins, vandalism, or insurance claims at this property in the last 3 years? What carrier currently insures it and at what premium?
- What's the average days-on-market for RENTAL listings here right now (not sales)? A rising rental-DOM trend means longer vacancies and softer asking-rent achievability than the comps imply.
- What's the recent tenant-quality profile in this submarket — average credit score on applications, eviction rate, late-payment / NSF rate, and stable-employment percentage? A property-management company in the area should have these aggregated.
- How much new for-sale + rental construction is in the pipeline within 1–3 miles? Heavy new supply typically softens prices + rents 12–24 months out; constrained supply supports both.
Investment metrics
- 1% rule
- 1.97% ✓
- Cap rate
- 16.32%
- Cash-on-cash
- 35.82%
- DSCR
- 2.59
- GRM
- 4.2
CMA / ARV
- ARV (on-the-fly)
- $170,016
- Comps found
- 12
Show comp detail 12 sales within ~0.75 mi
| Address | Dist | Beds/Ba | Sqft | Sold | Price | $/sf | Match |
|---|---|---|---|---|---|---|---|
| 4401 Hipp St | 0.00mi | 3/1.5 | 1,011 (-0%) | 2mo | $90,000 | $89 | 98 |
| 4012 Weddell St | 0.21mi | 3/1.0 | 1,007 (-0%) | 1mo | $220,000 | $218 | 86 |
| 4408 Gertrude St | 0.29mi | 3/1.0 | 1,000 (-1%) | 1mo | $155,000 | $155 | 81 |
| 4663 Mayfair St | 0.22mi | 3/1.0 | 1,074 (+6%) | 1mo | $180,000 | $168 | 77 |
| 4932 Pelham St | 0.44mi | 3/1.0 | 1,000 (-1%) | 0mo | $170,000 | $170 | 75 |
| 4845 Dudley St | 0.55mi | 3/1.0 | 1,020 (+1%) | 1mo | $147,000 | $144 | 70 |
| 4993 Clippert St | 0.49mi | 3/1.0 | 988 (-2%) | 2mo | $159,000 | $161 | 70 |
| 20728 Carlysle St | 0.41mi | 3/1.0 | 1,087 (+7%) | 2mo | $185,000 | $170 | 64 |
| 4205 Katherine St | 0.57mi | 3/1.5 | 1,080 (+7%) | 1mo | $205,000 | $190 | 62 |
| 3837 Katherine St | 0.63mi | 3/1.5 | 962 (-5%) | 2mo | $208,000 | $216 | 60 |
| 21919 Powers Ave | 0.71mi | 3/1.0 | 988 (-2%) | 2mo | $105,000 | $106 | 60 |
| 5636 Hipp St | 0.53mi | 3/1.0 | 894 (-12%) | 1mo | $121,300 | $136 | 53 |
Match score weights: distance 35% · size 25% · config 20% · recency 20%. Top-matched comps best support the ARV.
Projected returns pro-forma
-3.0% appreciation · 2.03% rent growth · sell at horizon
- IRR
- 3.3%
- Equity multiple
- 1.13×
- Total profit
- $2,994
- Equity at exit
- $12,674
- IRR
- 11.7%
- Equity multiple
- 1.87×
- Total profit
- $20,607
- Equity at exit
- $7,349
Cash invested: $23,800 (down + closing). Projections, not guarantees.
Landlord ↔ Tenant lean methodology
- Overall (STATE)
- 62 Landlord-Friendly
- State Michigan
- 62 Landlord-Friendly · EVEN
- County
- — inherits STATE
- City
- — inherits STATE
ZIP-level market 48125
- Rents YoY
- 2.0%
- Active inventory
- 137
- Price-to-rent
- 4.2×
Monthly cashflow live
- Estimated rent
- $1,677 high interval (Pro) →
- Mortgage (P&I)
- −$446
- Tax from tax record
- −$133 /mo · $1,594/yr
- Insurance
- −$35
- Flood insurance flood zone
- −$427 /mo · $5,118/yr
- HOA
- −$0
- Vacancy / Maint / Mgmt
- −$352
- Net cashflow
- $284
Break-even live
UW: 25.0% down · 7.5% · 30yr · 1.5% tax · 5.0% vac · 8.0% maint · 8.0% mgmt
Financing live
Cash to close
- Down payment
- $21,250
- Closing costs
- $2,550
- Reserves months
- —
- Total cash needed
- —
Loan-product check · same deal, 3 products live
Conventional
25% down · 7.5% · 30yr
- Down + closing
- —
- Monthly P&I
- —
- Monthly cashflow
- —
- DSCR
- —
- Eligible?
- —
Personal DTI + credit; lowest rate.
DSCR
20% down · 8.5% · 30yr
- Down + closing
- —
- Monthly P&I
- —
- Monthly cashflow
- —
- DSCR
- —
- Eligible?
- —
No personal income docs; deal must DSCR.
Hard money
10% down · 12.0% · 12mo
- Down + closing
- —
- Monthly P&I
- —
- Monthly cashflow
- —
- DSCR
- —
- Eligible?
- —
Short-term bridge; refi at stabilization.
Rent comps 17 comps
| Address | Beds | Baths | Sqft | Rent | $/sqft | DOM | Units | Dist |
|---|---|---|---|---|---|---|---|---|
| 4681 Weddell St Dearborn Heights, MI | 3.0 | 1.0 | 860 | $1,600 | $1.86 | 2d | 1 | 0.27mi |
| 4704 Jackson St Dearborn Heights, MI | 3.0 | 1.0 | 1000 | $1,500 | $1.50 | 22d | 1 | 0.31mi |
| 4631 Ziegler St Dearborn Heights, MI | 3.0 | 1.0 | 1050 | $1,650 | $1.57 | 44d | 1 | 0.34mi |
| 4638 Gertrude St Dearborn Heights, MI | 3.0 | 1.0 | 1020 | $1,700 | $1.67 | 5d | 1 | 0.36mi |
| 20728 Carlysle St Dearborn, MI | 3.0 | 1.0 | 1087 | $1,850 | $1.70 | 2d | 1 | 0.40mi |
| 4914 Gertrude St Dearborn Heights, MI | 2.0 | 1.0 | 908 | $1,230 | $1.35 | 17d | 1 | 0.43mi |
| 4810 Campbell St Dearborn Heights, MI | 3.0 | 1.0 | 1000 | $1,700 | $1.70 | 2d | 1 | 0.43mi |
| 4757 Dudley St Dearborn Heights, MI | 3.0 | 1.0 | 995 | $1,350 | $1.36 | 11d | 1 | 0.57mi |
| 5371 Culver St Dearborn Heights, MI | 3.0 | 1.0 | 980 | $1,500 | $1.53 | 11d | 1 | 0.76mi |
| 5371 Culver St Dearborn Heights, MI | 3.0 | 1.0 | 980 | $1,450 | $1.48 | 2d | 1 | 0.76mi |
| 3620 Monroe St Dearborn, MI | 3.0 | 2.0 | 1100 | $1,800 | $1.64 | 10d | 1 | 0.79mi |
| 4565 Fleming St Dearborn Heights, MI | 3.0 | 1.0 | 1200 | $1,600 | $1.33 | 10d | 1 | 0.85mi |
| 4934 McKinley St Dearborn Heights, MI | 3.0 | 1.0 | 1051 | $1,700 | $1.62 | 2d | 1 | 0.86mi |
| 2631 Woodside St Dearborn, MI | 3.0 | 1.0 | 894 | $1,650 | $1.85 | 2d | 1 | 0.86mi |
| 21337 Audette St Dearborn, MI | 3.0 | 1.0 | 964 | $1,850 | $1.92 | 44d | 1 | 0.97mi |
| 3901 Academy St Dearborn Heights, MI | 4.0 | 2.0 | 1400 | $2,100 | $1.50 | 2d | 1 | 1.34mi |
| 2825 Queen St Dearborn, MI | 2.0 | 1.0 | 1000 | $1,299 | $1.30 | 44d | 1 | 1.50mi |
Listing history 11 events
-
2026-04-02status Pending 38-char remark
Show marketing remark (38 chars)
Investment opportunity Built in equity
-
2026-04-02status Pending
Show marketing remark (38 chars)
Investment opportunity Built in equity
-
2026-03-10$85,000 Active
Show marketing remark (38 chars)
Investment opportunity Built in equity
-
2026-03-10$85,000 Active 38-char remark
Show marketing remark (38 chars)
Investment opportunity Built in equity
-
2008-11-17soldstatus $55,000
-
2008-10-07soldstatus $55,000 246-char remark
Show marketing remark (246 chars)
SELLER WILL GIVE BUYER $4,000 FOR CLOSING COSTS & PREPAIDS. PRICED TO SELL. FURNACE & CENTRAL AIR NEW IN 2003. 22X24 GARAGE IN 1996. DECK OFF 2ND FLOOR BEDROOM. 16X12 YARD DECK. PRIVACY FENCE. APPLIANCES TO REMAIN. SOME VINYL WINDOWS.
-
2008-01-23$56,500 246-char remark
Show marketing remark (246 chars)
SELLER WILL GIVE BUYER $4,000 FOR CLOSING COSTS & PREPAIDS. PRICED TO SELL. FURNACE & CENTRAL AIR NEW IN 2003. 22X24 GARAGE IN 1996. DECK OFF 2ND FLOOR BEDROOM. 16X12 YARD DECK. PRIVACY FENCE. APPLIANCES TO REMAIN. SOME VINYL WINDOWS.
-
1994-12-01soldstatus $46,000
-
1994-11-28soldstatus $46,000
-
1994-11-01$49,900
-
1994-02-08soldstatus $42,000
ⓘ Source: listings_history table (triggers on properties + properties_extension) + one-shot
backfill from property_details.listing_events for pre-trigger history.
Tax reassessment forecast MI · Partial reset (capped growth)
- Current annual tax
- $1,594 · $133/mo
- Projected year-2 tax
- $1,594 · $133/mo
- Expected delta
- $0/yr ($0/mo · 0.0%)
ⓘ Screening estimate from a state-policy table — verify with the county assessor before closing.
Climate risk First Street
- Flood 5/10 Major FEMA zone AE · 64% chance over 30 yrs
- Wildfire 1/10 Low
- Heat 3/10 Moderate 7 d/yr ≥98°F today · 14 d/yr by 30 yrs out
- Wind 2/10 Low
- Air quality 3/10 Moderate 2 unhealthy d/yr today · 4 by 30 yrs out
Nearby sold comps map
Loading sold comps map…
Walkable amenities ~0.75 mi
Loading nearby amenities…
Taxation est. · year 1
- Rental income
- $20,119
- − Mortgage interest
- −$4,761
- − Property taxes
- −$1,594
- − Insurance
- −$5,544
- − Repairs & maintenance
- −$1,610
- − Management
- −$1,610
- − Depreciation
- −$2,473
- Taxable income
- $2,528
- Est. tax owed @ 24.0%
- −$607
- After-tax cash flow
- $2,801/yr
For passive investors: Depreciation is non-cash, so a rental often shows a tax loss while cash-flowing — sheltering income. Rental losses are passive: they offset passive income freely, and up to $25,000/yr can offset ordinary (W-2) income if you actively participate and your MAGI is under $100k (phasing out to $0 by $150k); unused losses carry forward. On sale, claimed depreciation is recaptured at up to 25%, and gains may owe capital-gains tax (a 1031 exchange can defer both). Figures are a year-1 estimate at your 24.0% rate — not tax advice; consult a CPA.
Schools (NCES district)
- District
- Dearborn Heights School District #7
- NCES district ID
- 2611610
- Math proficiency
- 13% ▼ -10.00%
- Reading proficiency
- 26% ▼ -7.00%
- Median HH income
- $47,468
- Composite
- 17.21/100
- National rank
- #9101
- State rank
- #466 of 540 in MI
Livability — Dearborn Heights
- Score
- 79/100
- State rank
- #82
- US rank
- #1885
Category grades
Schools grade is shown separately in the Schools card above.
Census & demographics
- Census place
- Dearborn Heights, MI
- County
- Wayne County · 1,562,939 people
- City population
- 61,771
- Metro
- Detroit-Warren-Dearborn, MI
- Population (ZIP)
- 22,125
- Household income
- $60,195
- Rent vs Own
- Severe rent burden
- 654.0
Population outlook (Wayne County) Hauer SSP2
- Today (2025)
- 1,675,273 people
- By 2030
- 1,620,300 · -3.3%
- By 2040
- 1,502,341 · -10.3%
- By 2050
- 1,384,039 · -17.4%
- By 2075
- 1,124,592 · -32.9%
- By 2100
- 881,193 · -47.4%
Race, ethnicity, and origin ACS 2023
- Neighborhood character
- Predominantly White (76%)
- Race & ethnicity
- White 76% Black 10% Two or more races 9% Hispanic / Latino 9%
- Hispanic origin (detail)
- Mexican 6%
- Common ancestry
- Romanian 11% Arab 3% Slovak 2%
- Foreign-born
- 11% · Canada
- Languages at home
- 82% English-only · Arabic 13% Spanish 3% Russian/Polish/Slavic 1%
Political lean MEDSL · Wayne
- 2024 margin
- Strong D (+29.0) · D 62.7% · R 33.7% · Other 3.6%
- 2008→2024 swing
- -20.5pp toward R · 2008: 49.5pp · 2024: 29.0pp
- All cycles
- 2024: D+29.0 2020: D+38.1 2016: D+37.3 2012: D+46.9 2008: D+49.5
Not yet ingested
- Civics
- —
Market trends
- HPI YoY
- ▼ -214.70%
- Current HPI
- 218.4698
- Rent YoY
- ▲ 2.03%
- Metro
- Detroit-Warren-Dearborn, MI
- State GDP YoY
- ▲ 1.37%
- F500 in state
- 28
Industry mix (Fortune 500 HQ in MI)
| Industry | F500 HQs | Revenue |
|---|---|---|
| Automotive Parts | 3 | $48B |
|
||
| Automotive | 2 | $372B |
|
||
| Chemicals | 1 | $45B |
|
||
| Automotive Retail | 1 | $29B |
|
||
| Healthcare / Medical Devices | 1 | $23B |
|
||
| Automotive Technology | 1 | $20B |
|
||
Price history
+102.4% since first listed11 events — show timeline
- 2026-04-02 Pending — MiRealSource-MiMLS
- 2026-04-02 Pending — REALCOMP
- 2026-03-10 Listed $85,000 REALCOMP
- 2026-03-10 Listed $85,000 MiRealSource-MiMLS
- 2008-11-17 Sold (Public Records) $55,000 Public Records
- 2008-10-07 Sold (MLS) $55,000 REALCOMP
- 2008-01-23 Listed $56,500 REALCOMP
- 1994-12-01 Sold (Public Records) $46,000 Public Records
- 1994-11-28 Sold (MLS) $46,000 MiRealSource-MiMLS
- 1994-11-01 Listed $49,900 MiRealSource-MiMLS
- 1994-02-08 Sold (Public Records) $42,000 Public Records
Property tax history
-0.7%/yrLatest (2025): $1,594 · -26.9% YoY. Source: county tax records.
Cash-flow waterfall
monthlySold comps — $/sqft
last 12 mo · ≤1 miLoading sold comps…