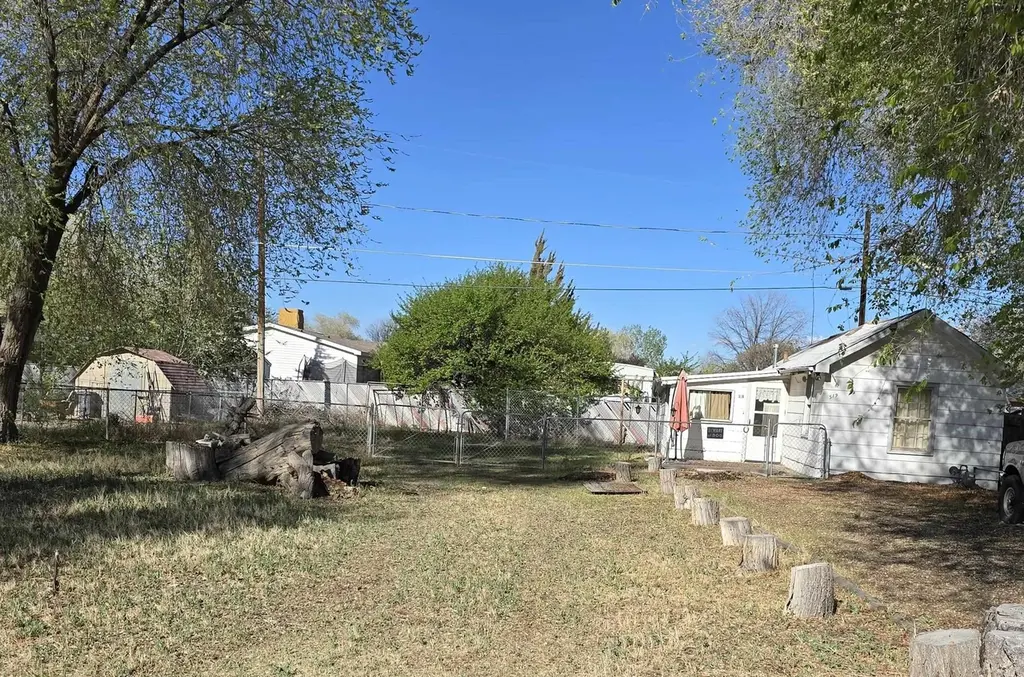
519 Florence Ave · Grand Junction, CO
Flood risk 1/10 · Minimal
- FEMA flood zone
- X (unshaded)
- Chance of flooding over 30 yrs
- 0.0%
- Est. flood insurance / yr
- $507 – $1,088
Fire risk 1/10 · Minimal
- Est. fire insurance / yr
- $939 – $1,743
Heat risk 5/10 · Moderate
- Hot days now (above 95°F)
- 7 days/yr
- Hot days in 30 yrs
- 18 days/yr
Wind risk 1/10 · Minimal
- Chance of severe wind over 30 yrs
- —
Air-quality risk 2/10 · Minimal
- Unhealthy air days now
- 1 days/yr
- Unhealthy air days in 30 yrs
- 1 days/yr
Risk factors via First Street. Map © Google.
Why this score? — see what drove the C+ grade
The composite is a weighted blend of 9 inputs, each scored 0–100. Each bar is that input's sub-score; the figure is the points it added to the 100-point composite (weight × sub-score).
- Cash flow +23.0/30.0
- ARV discount +15.0/15.0
- DSCR +7.4/10.0
- 1% rule +5.0/10.0
- Livability +4.0/5.0
- Rent growth +3.3/5.0
- Schools +2.8/10.0
- Condition / age +2.5/5.0
- Appreciation +0.0/10.0
$160,000
🖨 Deal sheet 📄 Offer letter ✓ Due diligence
Listing remarks MLS
2 bedroom 1 full bath Newly remodeled house with new carpet , new linoleum , new paint inside and out, new kitchen. New bathroom. Newer roof and newer furnace large lot with irrigation water . Large shade trees and grass Front and back yard No homeowners association / no covenants. Great house on quiet street
Key facts
- 0.24 acre lot
- Built 1928
- Listed 3 days
Neighborhood map
What this means for you Summary
Snapshot
- This is a 2-bed/1.0-bath single-family listed at $160k.
Deal economics
- At list price, monthly cash flow is $283 ($3k/yr) — positive.
- The deal already cash-flows at list — no discount required.
- Meets the 1% rule at list price ($2k rent vs $160k).
- Cap rate 8.4% vs local median 3.1% in Grand Junction — top-decile yield for the area; either an underpriced asset or a hidden risk that comps aren't pricing in. Stress-test before assuming the spread holds.
Location & tenants
- Location reads 79/100 on livability (#15 in CO, #2,222 nationally) — a middle-class / working-renter tenant base. Strengths: commute A+, health & safety A+, housing A; Watch: employment D+, crime F.
- Mesa County Valley School District No. 51 (suburban): math 26% / reading 38% proficiency, ranked #43 of 86 in CO (top 50%) — families likely to look elsewhere, expect single-tenant / working-renter base with shorter leases.
- Zoned schools: Fruitvale Elementary School (math 22% / reading 32%, grade F, #568 of 966 statewide, top 60%, 412 students, 59% FRL); Bookcliff Middle School (math 18% / reading 26%, grade F, #188 of 270 statewide, top 72%, 449 students, 59% FRL); Central High School (math 19% / reading 43%, grade F, #229 of 381 statewide, top 60%, 1,613 students, 45% FRL) — zoned schools average 54% FRL vs 39% district-wide (15 pts higher); higher-poverty schools than district average — tighter screening recommended.
- Market conditions: Rents rising (+3.2%/yr); 280 active listings in the ZIP; 9 comparable units currently listed for rent nearby; rentals at typical pace (median 21d on market — plan ~3-4 weeks tenant-placement turnaround); 1,014 units permitted in Mesa County in 2024 (240 in 5+ unit buildings).
Forward outlook
- Local home prices are declining (-3.0%/yr); year-one equity from $1k of loan paydown is wiped out by about $5k of value loss. Plan a longer hold.
Negotiation context
- Only 3 days on market — expect competitive offers; lowballing is unlikely to land.
- 2 sale attempts since 7y ago with the ask held roughly flat each time — persistent listings suggest the price (not the market) is what's stuck; bring a comps-based counter.
Risks & watch-outs
- Watch-outs: built in 1928 — expect roof / HVAC / electrical / plumbing capex.
- Climate carrying-cost: extreme-heat days projected 7→18/yr by 2055 (HVAC capex compounding) — expect insurance premiums to compound above CPI over the hold.
Questions for the listing agent
- Built in 1928 — when were the roof, HVAC, electrical panel, plumbing, and water heater last replaced?
- Is there a deadline driving the sale (1031 exchange, divorce, estate, relocation)? That informs how much negotiation room exists.
- Schools are D-rated, which usually means shorter tenancies and higher turnover. Who's the typical renter profile here, and what's been the actual vacancy rate?
- Crime grade is F in this area — have there been break-ins, vandalism, or insurance claims at this property in the last 3 years? What carrier currently insures it and at what premium?
- What's the average days-on-market for RENTAL listings here right now (not sales)? A rising rental-DOM trend means longer vacancies and softer asking-rent achievability than the comps imply.
- What's the recent tenant-quality profile in this submarket — average credit score on applications, eviction rate, late-payment / NSF rate, and stable-employment percentage? A property-management company in the area should have these aggregated.
- How much new for-sale + rental construction is in the pipeline within 1–3 miles? Heavy new supply typically softens prices + rents 12–24 months out; constrained supply supports both.
Investment metrics
- 1% rule
- 1.00% ✓
- Cap rate
- 8.41%
- Cash-on-cash
- 7.58%
- DSCR
- 1.34
- GRM
- 8.3
CMA / ARV
- ARV (on-the-fly)
- $280,528
- Comps found
- 2
Show comp detail 2 sales within ~0.75 mi
| Address | Dist | Beds/Ba | Sqft | Sold | Price | $/sf | Match |
|---|---|---|---|---|---|---|---|
| 525 30 Rd | 0.11mi | 2/1.0 | 786 (-0%) | 6mo | $280,000 | $356 | 89 |
| 517 1/2 Florence Rd | 0.02mi | 1/1.0 (-1) | 806 (+2%) | 13mo | $277,500 | $344 | 80 |
Match score weights: distance 35% · size 25% · config 20% · recency 20%. Top-matched comps best support the ARV.
Projected returns pro-forma
-3.0% appreciation · 3.2% rent growth · sell at horizon
- IRR
- -4.6%
- Equity multiple
- 0.83×
- Total profit
- $-7,638
- Equity at exit
- $23,857
- IRR
- 5.3%
- Equity multiple
- 1.39×
- Total profit
- $17,671
- Equity at exit
- $13,834
Cash invested: $44,800 (down + closing). Projections, not guarantees.
Landlord ↔ Tenant lean methodology
- Overall (STATE)
- 38 Tenant-Leaning
- State Colorado
- 38 Tenant-Leaning · D+4
- County
- — inherits STATE
- City
- — inherits STATE
ZIP-level market 81504
- Rents YoY
- 3.2%
- Active inventory
- 280
- Price-to-rent
- 8.3×
Monthly cashflow live
- Estimated rent
- $1,602 high interval (Pro) →
- Mortgage (P&I)
- −$839
- Tax from tax record
- −$77 /mo · $919/yr
- Insurance
- −$67
- HOA
- −$0
- Vacancy / Maint / Mgmt
- −$336
- Net cashflow
- $283
Break-even live
UW: 25.0% down · 7.5% · 30yr · 1.5% tax · 5.0% vac · 8.0% maint · 8.0% mgmt
Financing live
Cash to close
- Down payment
- $40,000
- Closing costs
- $4,800
- Reserves months
- —
- Total cash needed
- —
Loan-product check · same deal, 3 products live
Conventional
25% down · 7.5% · 30yr
- Down + closing
- —
- Monthly P&I
- —
- Monthly cashflow
- —
- DSCR
- —
- Eligible?
- —
Personal DTI + credit; lowest rate.
DSCR
20% down · 8.5% · 30yr
- Down + closing
- —
- Monthly P&I
- —
- Monthly cashflow
- —
- DSCR
- —
- Eligible?
- —
No personal income docs; deal must DSCR.
Hard money
10% down · 12.0% · 12mo
- Down + closing
- —
- Monthly P&I
- —
- Monthly cashflow
- —
- DSCR
- —
- Eligible?
- —
Short-term bridge; refi at stabilization.
Rent comps 9 comps
| Address | Beds | Baths | Sqft | Rent | $/sqft | DOM | Units | Dist |
|---|---|---|---|---|---|---|---|---|
| 541-529 E 1/2 Rd Grand Junction, CO | 1.0–2.0 | 1.0 | 687 | $1,510 | $2.20 | 13d | 1 | 0.49mi |
| 2961 1/2 Cedar Pl Grand Junction, CO | 2.0 | 1.0 | 720 | $1,250 | $1.74 | 21d | 1 | 0.51mi |
| 451 Davis Rd Grand Junction, CO | 2.0 | 1.0 | 1102 | $1,400 | $1.27 | 21d | 1 | 0.88mi |
| 2909 Dawn Dr Grand Junction, CO | 2.0 | 1.5 | 950 | $1,650 | $1.74 | 21d | 1 | 0.91mi |
| 2907 Dawn Dr Grand Junction, CO | 3.0 | 1.5 | 1000 | $1,650 | $1.65 | 13d | 1 | 0.93mi |
| 2907 Dawn Dr Unit 4 Grand Junction, CO | 3.0 | 1.5 | 1000 | $1,650 | $1.65 | 21d | 1 | 0.93mi |
| 568 Dawn Ct Unit 1 Grand Junction, CO | 2.0 | 1.0 | 1038 | $1,100 | $1.06 | 13d | 1 | 0.94mi |
| 2855 Elm Cir Unit 35 Grand Junction, CO | 2.0 | 1.0 | 840 | $1,050 | $1.25 | 21d | 1 | 1.32mi |
| 521 28 1/2 Rd Grand Junction, CO | 3.0 | 1.0 | 1040 | $2,100 | $2.02 | 21d | 1 | 1.38mi |
Listing history 4 events
-
2026-04-20status Pending
-
2026-04-17$160,000 Active
-
2019-11-21soldstatus $143,900 312-char remark
Show marketing remark (312 chars)
2 bedroom 1 full bath Newly remodeled house with new carpet , new linoleum , new paint inside and out, new kitchen. New bathroom. Newer roof and newer furnace large lot with irrigation water . Large shade trees and grass Front and back yard No homeowners association / no covenants. Great house on quiet street
-
2019-08-28$139,900 312-char remark
Show marketing remark (312 chars)
2 bedroom 1 full bath Newly remodeled house with new carpet , new linoleum , new paint inside and out, new kitchen. New bathroom. Newer roof and newer furnace large lot with irrigation water . Large shade trees and grass Front and back yard No homeowners association / no covenants. Great house on quiet street
ⓘ Source: listings_history table (triggers on properties + properties_extension) + one-shot
backfill from property_details.listing_events for pre-trigger history.
Tax reassessment forecast CO · Resets to sale price
- Current annual tax
- $919 · $77/mo
- Projected year-2 tax
- $919 · $77/mo
- Expected delta
- $0/yr ($0/mo · 0.0%)
ⓘ Screening estimate from a state-policy table — verify with the county assessor before closing.
Climate risk First Street
- Flood 1/10 Low FEMA zone X (unshaded) · 0% chance over 30 yrs
- Wildfire 1/10 Low
- Heat 5/10 Major 7 d/yr ≥95°F today · 18 d/yr by 30 yrs out
- Wind 1/10 Low
- Air quality 2/10 Low 1 unhealthy d/yr today · 1 by 30 yrs out
Nearby sold comps map
Loading sold comps map…
Walkable amenities ~0.75 mi
Loading nearby amenities…
Taxation est. · year 1
- Rental income
- $19,219
- − Mortgage interest
- −$8,962
- − Property taxes
- −$919
- − Insurance
- −$800
- − Repairs & maintenance
- −$1,538
- − Management
- −$1,538
- − Depreciation
- −$4,655
- Taxable income
- $807
- Est. tax owed @ 24.0%
- −$194
- After-tax cash flow
- $3,201/yr
For passive investors: Depreciation is non-cash, so a rental often shows a tax loss while cash-flowing — sheltering income. Rental losses are passive: they offset passive income freely, and up to $25,000/yr can offset ordinary (W-2) income if you actively participate and your MAGI is under $100k (phasing out to $0 by $150k); unused losses carry forward. On sale, claimed depreciation is recaptured at up to 25%, and gains may owe capital-gains tax (a 1031 exchange can defer both). Figures are a year-1 estimate at your 24.0% rate — not tax advice; consult a CPA.
Schools (NCES district)
- District
- Mesa County Valley School District No. 51
- NCES district ID
- 0804350
- Math proficiency
- 26% ▲ 1.00%
- Reading proficiency
- 38% ▬ 0.00%
- Median HH income
- $50,189
- Composite
- 27.83/100
- National rank
- #6884
- State rank
- #43 of 86 in CO
Livability — Grand Junction
- Score
- 79/100
- State rank
- #15
- US rank
- #2222
Category grades
Schools grade is shown separately in the Schools card above.
Census & demographics
- County
- Mesa County · 143,088 people
- City population
- 113,583
- Metro
- Grand Junction, CO
- Population (ZIP)
- 32,376
- Household income
- $70,958
- Rent vs Own
- Severe rent burden
- 808.0
Population outlook (Mesa County) Hauer SSP2
- Today (2025)
- 153,000 people
- By 2030
- 154,479 · +1.0%
- By 2040
- 155,257 · +1.5%
- By 2050
- 153,384 · +0.3%
- By 2075
- 144,735 · -5.4%
- By 2100
- 123,825 · -19.1%
Race, ethnicity, and origin ACS 2023
- Neighborhood character
- Predominantly White (73%)
- Race & ethnicity
- White 73% Hispanic / Latino 21% Two or more races 18%
- Hispanic origin (detail)
- Mexican 13%
- Common ancestry
- Iranian 2% Slovak 2% Italian 2%
- Foreign-born
- 6% · Canada, Vietnam
- Languages at home
- 90% English-only · Spanish 8%
Political lean MEDSL · Mesa
- 2024 margin
- Strong R (+24.3) · D 36.6% · R 61.0% · Other 2.4%
- 2008→2024 swing
- +5.2pp toward D · 2008: -29.5pp · 2024: -24.3pp
- All cycles
- 2024: R+24.3 2020: R+28.0 2016: R+36.3 2012: R+32.8 2008: R+29.5
Not yet ingested
- Civics
- —
Market trends
- HPI YoY
- ▼ -345.40%
- Current HPI
- 309.0092
- Rent YoY
- ▲ 3.20%
- Metro
- Grand Junction, CO
- State GDP YoY
- ▲ 1.95%
- F500 in state
- 14
Industry mix (Fortune 500 HQ in CO)
| Industry | F500 HQs | Revenue |
|---|---|---|
| Technology Distribution | 1 | $31B |
|
||
| Food / Agriculture | 1 | $18B |
|
||
| Packaging | 1 | $14B |
|
||
| Healthcare | 1 | $13B |
|
||
| Energy | 1 | $10B |
|
||
| Technology | 1 | $4B |
|
||
Price history
+14.4% since first listed4 events — show timeline
- 2026-04-20 Pending — GJARA
- 2026-04-17 Listed $160,000 GJARA
- 2019-11-21 Sold (MLS) $143,900 GJARA
- 2019-08-28 Listed $139,900 GJARA
Property tax history
+2.8%/yrLatest (2025): $919 · +97.7% YoY. Source: county tax records.
Cash-flow waterfall
monthlySold comps — $/sqft
last 12 mo · ≤1 miLoading sold comps…