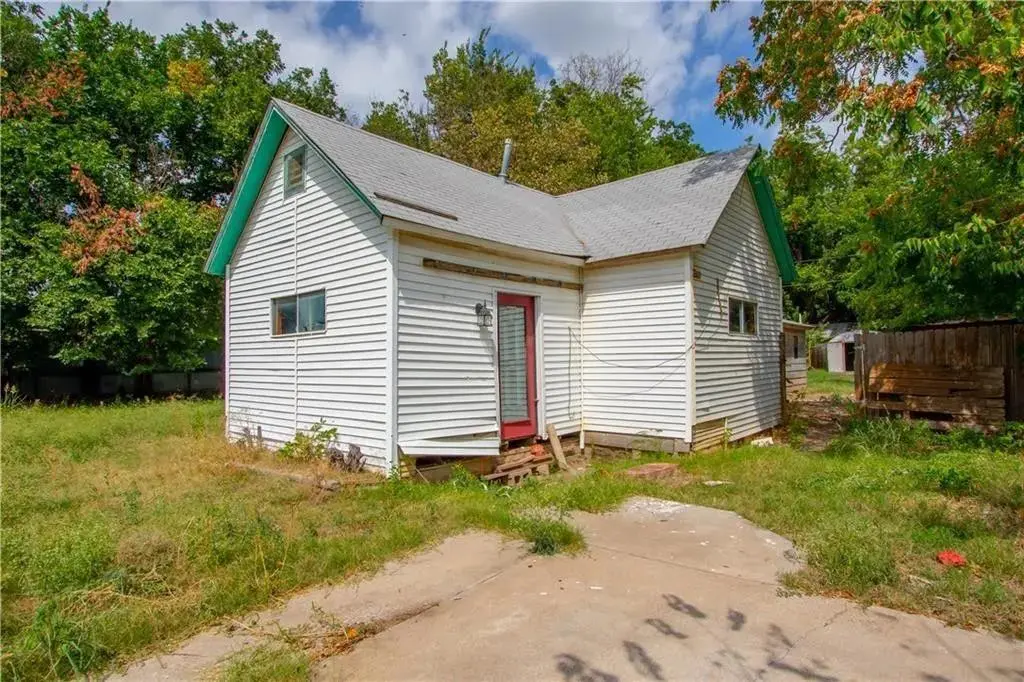
503 SW I Ave · Lawton, OK
Flood risk 6/10 · Moderate
- FEMA flood zone
- AE
- Chance of flooding over 30 yrs
- 0.73%
- Est. flood insurance / yr
- $1,737 – $8,500
Fire risk 7/10 · Major
- Est. fire insurance / yr
- $2,463 – $4,575
Heat risk 6/10 · Moderate
- Hot days now (above 109°F)
- 7 days/yr
- Hot days in 30 yrs
- 19 days/yr
Wind risk 3/10 · Minor
- Chance of severe wind over 30 yrs
- 5.0%
Air-quality risk 1/10 · Minimal
- Unhealthy air days now
- 0 days/yr
- Unhealthy air days in 30 yrs
- 0 days/yr
Risk factors via First Street. Map © Google.
Why this score? — see what drove the A- grade
The composite is a weighted blend of 9 inputs, each scored 0–100. Each bar is that input's sub-score; the figure is the points it added to the 100-point composite (weight × sub-score).
- Cash flow +30.0/30.0
- ARV discount +15.0/15.0
- 1% rule +10.0/10.0
- DSCR +10.0/10.0
- Appreciation +4.6/10.0
- Livability +3.2/5.0
- Rent growth +2.9/5.0
- Condition / age +2.5/5.0
- Schools +2.0/10.0
$29,000
🖨 Deal sheet 📄 Offer letter ✓ Due diligence
Listing remarks
Wholesale opportunity in Lawton, OK. This 2 bed, 1 bath single-family home offers 1,176 sq ft and was built in 1915 on a ~6,998 sq ft lot. The property includes a garage, central HVAC, breaker panel, and city sewer, but is in fixer-upper condition and will require repairs and updates. Asking price is $30,000 with an estimated as-is value around $43,000+ based on nearby comparable sales. The property is vacant and ready for walkthrough. Closing timeline is 30 days or less. This is a strong opportunity for investors seeking a low entry point with value-add potential. Cash or hard money buyers only. Buyer to perform their own due diligence
Key facts
- 7,000 sq ft lot
- Built 1915
- Listed 56 days
Property features AI
Finance
- Financial info: Listing terms: Cash or Conventional
- HOA & community: No mandatory association dues
Exterior
- Home design: Single family residence; One-level property; Located in the Woods addition
- Construction: Other construction materials; Other roof type; Conventional foundation; Built prior to current listing (existing property)
- Exterior features: Interior lot; No exterior features listed; Property is existing (not new construction)
Interior
- Bedrooms: 2 bedrooms
- Bathrooms: 1 full bathroom
- Heating & cooling: No heating; No cooling
- Interior features: One living area; No fireplace
Neighborhood map
What this means for you Summary
Snapshot
- This is a 2-bed/1.0-bath single-family listed at $29k.
Deal economics
- At list price, monthly cash flow is $344 ($4k/yr) — positive.
- The deal already cash-flows at list — no discount required.
- Meets the 1% rule at list price ($1k rent vs $29k).
- Recommended offer: $28k (3.0% below list) — sets the bar for market timing.
- Cap rate 38.2% vs local median 6.1% in Lawton — top-decile yield for the area; either an underpriced asset or a hidden risk that comps aren't pricing in. Stress-test before assuming the spread holds.
Location & tenants
- Location reads 63/100 on livability (#206 in OK) — a middle-class / working-renter tenant base. Strengths: cost of living A+, housing A+; Watch: employment D, schools D-, crime F.
- Lawton (urban): math 20% / reading 26% proficiency, ranked #137 of 270 in OK (top 51%) — low school quality limits family demand, transient renter base, plan for 1-2y turnover.
- Market conditions: Rents rising (+1.7%/yr); 117 active listings in the ZIP; 133 units permitted in Comanche County in 2024 (0 in 5+ unit buildings).
Forward outlook
- Local home prices are declining (-0.7%/yr); year-one equity from $200 of loan paydown is wiped out by about $206 of value loss. Plan a longer hold.
- Comanche County population projected to shrink 3% by 2050 — rents likely to lag national; underwrite the cash flow, not the appreciation.
- At projected returns (-0.7% appreciation + 1.7% rent growth), your $8k cash investment doubles in ~2 years — after that, you're playing with house money.
Negotiation context
- It's been on market 57 days — a 3% lower offer ($28k) is reasonable based on typical stale-listing flexibility.
- 2 sale attempts since 7y ago; this cycle's ask has dropped $10k (26%) from the opening price — seller is motivated, your offer sets the floor, not the list.
- Current owner paid $14k; list at $29k implies a 115% gain — meaningful room to come down on a strong offer.
Risks & watch-outs
- Watch-outs: flood insurance adds $427/mo; built in 1915 — expect roof / HVAC / electrical / plumbing capex.
- Climate carrying-cost: in FEMA flood zone AE (mandatory federal flood insurance); major wildfire risk; extreme-heat days projected 7→19/yr by 2055 (HVAC capex compounding) — expect insurance premiums to compound above CPI over the hold.
Questions for the listing agent
- It's been on market 57 days. Have you received any prior offers? Is the seller open to a 3% concession, seller financing, or rate buy-down credit?
- Built in 1915 — when were the roof, HVAC, electrical panel, plumbing, and water heater last replaced?
- What's the actual annual flood-insurance premium (NFIP or private), and is the property in a SFHA with mandatory coverage?
- Is there a deadline driving the sale (1031 exchange, divorce, estate, relocation)? That informs how much negotiation room exists.
- Schools are D-rated, which usually means shorter tenancies and higher turnover. Who's the typical renter profile here, and what's been the actual vacancy rate?
- Crime grade is F in this area — have there been break-ins, vandalism, or insurance claims at this property in the last 3 years? What carrier currently insures it and at what premium?
- What's the average days-on-market for RENTAL listings here right now (not sales)? A rising rental-DOM trend means longer vacancies and softer asking-rent achievability than the comps imply.
- What's the recent tenant-quality profile in this submarket — average credit score on applications, eviction rate, late-payment / NSF rate, and stable-employment percentage? A property-management company in the area should have these aggregated.
- How much new for-sale + rental construction is in the pipeline within 1–3 miles? Heavy new supply typically softens prices + rents 12–24 months out; constrained supply supports both.
Investment metrics
- 1% rule
- 4.14% ✓
- Cap rate
- 38.19%
- Cash-on-cash
- 113.92%
- DSCR
- 6.07
- GRM
- 2.0
CMA / ARV
- ARV (on-the-fly)
- $55,272
- Comps found
- 12
Show comp detail 12 sales within ~0.75 mi
| Address | Dist | Beds/Ba | Sqft | Sold | Price | $/sf | Match |
|---|---|---|---|---|---|---|---|
| 917 SW 5th St | 0.12mi | 3/1.0 (+1) | 1,200 (+2%) | 13mo | $56,900 | $47 | 76 |
| 213 SW Park Ave | 0.27mi | 2/1.0 | 1,000 (-15%) | 2mo | $30,000 | $30 | 60 |
| 312 SW H Ave | 0.14mi | 2/2.0 | 1,000 (-15%) | 7mo | $152,700 | $153 | 58 |
| 903 SW Garfield Ave | 0.69mi | 3/1.0 (+1) | 1,210 (+3%) | 1mo | $100,000 | $83 | 57 |
| 909 SW 5th St | 0.08mi | 2/1.0 | 1,000 (-15%) | 17mo | $36,500 | $37 | 57 |
| 802 SW 5th St | 0.05mi | 2/1.0 | 1,000 (-15%) | 19mo | $68,900 | $69 | 57 |
| 908 SW 3rd St | 0.23mi | 3/1.0 (+1) | 1,324 (+13%) | 10mo | $75,000 | $57 | 55 |
| 909 SW Garfield Ave | 0.70mi | 2/1.0 | 1,200 (+2%) | 12mo | $41,000 | $34 | 54 |
| 709 SW Garfield Ave | 0.62mi | 3/1.0 (+1) | 1,100 (-6%) | 2mo | $19,000 | $17 | 53 |
| 914 SW Monroe | 0.68mi | 2/1.0 | 1,000 (-15%) | 4mo | $11,000 | $11 | 40 |
| 616 SW Jefferson Ave | 0.50mi | 2/1.0 | 1,010 (-14%) | 16mo | $76,000 | $75 | 40 |
| 1505 SW 8th St | 0.62mi | 3/1.0 (+1) | 1,000 (-15%) | 11mo | $40,000 | $40 | 32 |
Match score weights: distance 35% · size 25% · config 20% · recency 20%. Top-matched comps best support the ARV.
Projected returns pro-forma
-0.71% appreciation · 1.7% rent growth · sell at horizon
- IRR
- 49.5%
- Equity multiple
- 3.32×
- Total profit
- $18,842
- Equity at exit
- $7,407
- IRR
- 52.0%
- Equity multiple
- 6.21×
- Total profit
- $42,286
- Equity at exit
- $8,130
Cash invested: $8,120 (down + closing). Projections, not guarantees.
Landlord ↔ Tenant lean methodology
- Overall (STATE)
- 83 Strongly Landlord-Friendly
- State Oklahoma
- 83 Strongly Landlord-Friendly · R+20
- County
- — inherits STATE
- City
- — inherits STATE
ZIP-level market 73501
- Home prices YoY
- -0.4%
- Rents YoY
- 1.7%
- Active inventory
- 117
- Price-to-rent
- 2.0×
Monthly cashflow live
- Estimated rent
- $1,202 medium interval (Pro) →
- Mortgage (P&I)
- −$152
- Tax from tax record
- −$14 /mo · $172/yr
- Insurance
- −$12
- Flood insurance flood zone
- −$427 /mo · $5,118/yr
- HOA
- −$0
- Vacancy / Maint / Mgmt
- −$252
- Net cashflow
- $344
Break-even live
UW: 25.0% down · 7.5% · 30yr · 1.5% tax · 5.0% vac · 8.0% maint · 8.0% mgmt
Financing live
Cash to close
- Down payment
- $7,250
- Closing costs
- $870
- Reserves months
- —
- Total cash needed
- —
Loan-product check · same deal, 3 products live
Conventional
25% down · 7.5% · 30yr
- Down + closing
- —
- Monthly P&I
- —
- Monthly cashflow
- —
- DSCR
- —
- Eligible?
- —
Personal DTI + credit; lowest rate.
DSCR
20% down · 8.5% · 30yr
- Down + closing
- —
- Monthly P&I
- —
- Monthly cashflow
- —
- DSCR
- —
- Eligible?
- —
No personal income docs; deal must DSCR.
Hard money
10% down · 12.0% · 12mo
- Down + closing
- —
- Monthly P&I
- —
- Monthly cashflow
- —
- DSCR
- —
- Eligible?
- —
Short-term bridge; refi at stabilization.
Listing history 22 events
-
2026-06-19days on market $29,000 Active 57 DOM
-
2026-06-18days on market $29,000 Active 56 DOM
-
2026-06-17days on market $29,000 Active 55 DOM
-
2026-06-16days on market $29,000 Active 54 DOM
-
2026-06-15days on market $29,000 Active 53 DOM
-
2026-06-14days on market $29,000 Active 51 DOM
-
2026-06-13days on market $29,000 Active 50 DOM
-
2026-06-10days on market $29,000 Active 48 DOM
-
2026-06-09days on market $29,000 Active 47 DOM
-
2026-06-08days on market $29,000 Active 46 DOM
-
2026-06-07days on market $29,000 Active 45 DOM
-
2026-06-05days on market $29,000 Active 42 DOM
-
2026-06-03days on market $29,000 Active 41 DOM
-
2026-06-03price $29,000 Active 40 DOM
-
2026-06-02days on market $39,000 Active 40 DOM
-
2026-06-01days on market $39,000 Active 39 DOM
-
2026-05-31days on market $39,000 Active 38 DOM
-
2026-05-30days on market $39,000 Active 37 DOM
-
2026-04-23$39,000 Active
-
2019-11-30historical
-
2019-09-21$15,500
-
2006-05-24soldstatus $13,500
ⓘ Source: listings_history table (triggers on properties + properties_extension) + one-shot
backfill from property_details.listing_events for pre-trigger history.
Tax reassessment forecast OK · Resets to sale price
- Current annual tax
- $172 · $14/mo
- Projected year-2 tax
- $261 · $22/mo
- Expected delta
- +$89/yr (+$7/mo · 51.7%)
ⓘ Screening estimate from a state-policy table — verify with the county assessor before closing.
Climate risk First Street
- Flood 6/10 Major FEMA zone AE · 73% chance over 30 yrs
- Wildfire 7/10 Severe
- Heat 6/10 Major 7 d/yr ≥109°F today · 19 d/yr by 30 yrs out
- Wind 3/10 Moderate 5% chance of damaging wind over 30 yrs
- Air quality 1/10 Low 0 unhealthy d/yr today · 0 by 30 yrs out
Nearby sold comps map
Loading sold comps map…
Walkable amenities ~0.75 mi
Loading nearby amenities…
Taxation est. · year 1
- Rental income
- $14,420
- − Mortgage interest
- −$1,624
- − Property taxes
- −$172
- − Insurance
- −$5,264
- − Repairs & maintenance
- −$1,154
- − Management
- −$1,154
- − Depreciation
- −$844
- Taxable income
- $4,209
- Est. tax owed @ 24.0%
- −$1,010
- After-tax cash flow
- $3,121/yr
For passive investors: Depreciation is non-cash, so a rental often shows a tax loss while cash-flowing — sheltering income. Rental losses are passive: they offset passive income freely, and up to $25,000/yr can offset ordinary (W-2) income if you actively participate and your MAGI is under $100k (phasing out to $0 by $150k); unused losses carry forward. On sale, claimed depreciation is recaptured at up to 25%, and gains may owe capital-gains tax (a 1031 exchange can defer both). Figures are a year-1 estimate at your 24.0% rate — not tax advice; consult a CPA.
Schools (NCES district)
- District
- Lawton
- NCES district ID
- 4017250
- Math proficiency
- 20% ▼ -12.00%
- Reading proficiency
- 26% ▼ -9.00%
- Median HH income
- $42,618
- Composite
- 19.68/100
- National rank
- #8732
- State rank
- #137 of 270 in OK
Livability — Lawton
- Score
- 63/100
- State rank
- #206
- US rank
- #15131
Category grades
Schools grade is shown separately in the Schools card above.
Census & demographics
- Census place
- Lawton, OK
- County
- Comanche County · 96,361 people
- City population
- 89,233
- Metro
- Lawton, OK
- Population (ZIP)
- 20,397
- Household income
- $49,741
- Rent vs Own
- Severe rent burden
- 742.0
Population outlook (Comanche County) Hauer SSP2
- Today (2025)
- 124,518 people
- By 2030
- 124,231 · -0.2%
- By 2040
- 122,193 · -1.9%
- By 2050
- 120,368 · -3.3%
- By 2075
- 120,492 · -3.2%
- By 2100
- 123,113 · -1.1%
Race, ethnicity, and origin ACS 2023
- Neighborhood character
- Highly diverse neighborhood (Simpson 0.73)
- Race & ethnicity
- White 45% Black 20% Two or more races 18% Hispanic / Latino 14% Native American 7% Asian 3%
- Hispanic origin (detail)
- Mexican 7% Puerto Rican 4%
- Common ancestry
- Lithuanian 2% Italian 2% Slovak 1%
- Foreign-born
- 6% · Canada, Vietnam, South Korea
- Languages at home
- 88% English-only · Spanish 8% Tagalog/Filipino 1% German/W. Germanic 1%
Political lean MEDSL · Comanche
- 2024 margin
- Strong R (+23.3) · D 37.4% · R 60.7% · Other 1.9%
- 2008→2024 swing
- -5.8pp toward R · 2008: -17.5pp · 2024: -23.3pp
- All cycles
- 2024: R+23.3 2020: R+20.1 2016: R+23.7 2012: R+17.0 2008: R+17.5
Not yet ingested
- Civics
- —
Market trends
- HPI YoY
- ▼ -0.71%
- Current HPI
- 172.4877
- Rent YoY
- ▲ 1.70%
- Metro
- Lawton, OK
- State GDP YoY
- ▲ 1.55%
- F500 in state
- 6
Industry mix (Fortune 500 HQ in OK)
| Industry | F500 HQs | Revenue |
|---|---|---|
| Energy | 3 | $48B |
|
||
Price history
+188.9% since first listed4 events — show timeline
- 2026-04-23 Listed $39,000 MLSOK
- 2019-11-30 Listing Removed — MLSOK
- 2019-09-21 Listed $15,500 MLSOK
- 2006-05-24 Sold (Public Records) $13,500 Public Records
Property tax history
+2.6%/yrLatest (2025): $172 · +39.8% YoY. Source: county tax records.
Cash-flow waterfall
monthlySold comps — $/sqft
last 12 mo · ≤1 miLoading sold comps…