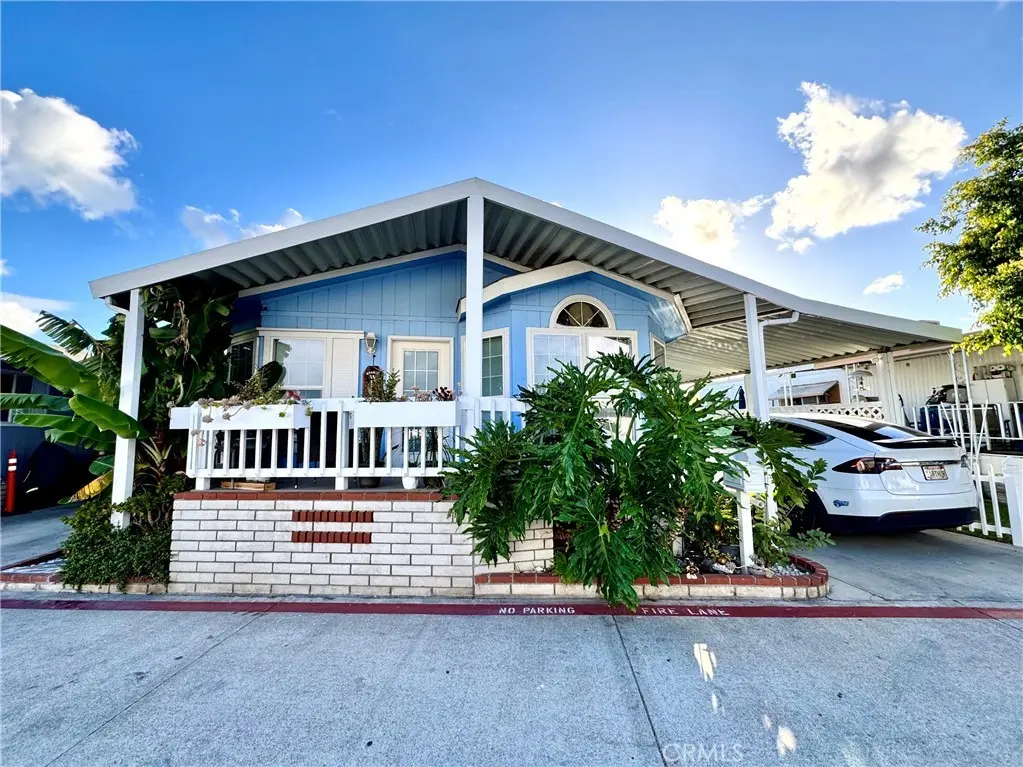
122 S Colombo Ln #77 · Tustin, CA
Flood risk 1/10 · Minimal
- FEMA flood zone
- X (unshaded)
- Chance of flooding over 30 yrs
- 0.0%
- Est. flood insurance / yr
- $507 – $1,088
Fire risk 1/10 · Minimal
- Est. fire insurance / yr
- $659 – $1,223
Heat risk 5/10 · Moderate
- Hot days now (above 92°F)
- 7 days/yr
- Hot days in 30 yrs
- 20 days/yr
Wind risk 1/10 · Minimal
- Chance of severe wind over 30 yrs
- —
Air-quality risk 4/10 · Minor
- Unhealthy air days now
- 3 days/yr
- Unhealthy air days in 30 yrs
- 5 days/yr
Risk factors via First Street. Map © Google.
Why this score? — see what drove the B- grade
The composite is a weighted blend of 9 inputs, each scored 0–100. Each bar is that input's sub-score; the figure is the points it added to the 100-point composite (weight × sub-score).
- Cash flow +30.0/30.0
- DSCR +10.0/10.0
- 1% rule +8.5/10.0
- Schools +5.0/10.0
- ARV discount +4.2/15.0
- Livability +3.6/5.0
- Rent growth +3.5/5.0
- Condition / age +2.2/5.0
- Appreciation +0.0/10.0
$205,000
🖨 Deal sheet (PDF) 📄 Offer letter ✓ Due diligence
Listing remarks MLS
* * * Beautiful 2001 Hallmark Double Wide Home!!! Wonderfully maintained. .. 2 Bed/2 Bath with an additional room that can be used as an office. .. .Raised Ceilings in Living Room. .. Lots of Windows for Natural Light. .. Nice Size Bedrooms with great closet space. .. Has Air. .ALL-AGE PARK. .. Wonderful Community Amenities. .. PARK RESIDENCY APPROVAL NECESSARY. .Agents-Please see the "Showing Instructions" section for requirements. .. Nice Home that needs a New Owner!!!!!
Key facts
- Raised ceilings
- Double-wide home
- Bonus room
Tags
Property features AI
Finance
- Other: Park name: Tustin Village Mobile Home Park; Number of pads: 1; Body type: Double; Mobile home remains on site
- Financial info: Land lease: $2,300 monthly (seller provided)
- HOA & community: Located in Tustin Village Mobile Home Park; Manager approval required; Community features include biking
Exterior
- Parking: Attached carport; 2 covered parking spaces (carport)
- Utilities: Electricity on property / connected; Natural gas connected; Public sewer / sewer connected; District/public water / water connected; Telephone available in street; Cable available
- Home design: Single-story home; Entry at front; Entry level: 1; Turnkey condition; Mobile home model CHARLESTON IV; Mobile dimensions approximately 22 ft by 49 ft
- Construction: Wood construction; Shingle roof; Pier jacks foundation
- Exterior features: Front porch; Porch; Community pool; Shed; Wood and brick skirting; Zero lot line; Lot density 0-1 unit/acre; Paved road frontage (access via city streets)
Interior
- Kitchen: Dishwasher; Gas range; Range/stove hood; Garbage disposal; Water heater unit; Laminate counters
- Bedrooms: All bedrooms on ground floor; Main floor primary bedroom; Main floor bedroom; Bonus room
- Flooring: Vinyl flooring; Laminate flooring
- Bathrooms: 2 full bathrooms; Soaking tub; Bathtub; Shower; Shower in tub; Walk-in shower; Laminate counters in bathrooms
- Heating & cooling: Central cooling; Central furnace heating
- Interior features: Unfurnished; High ceilings (9+ feet); Ceiling fan; Double-pane windows; Community spa
- Laundry & utility: Washer included; Dryer included; Gas and electric dryer hookups
Neighborhood map
What this means for you Summary
Snapshot
- This is a 2-bed/2.0-bath manufactured listed at $205k. Condition is rated fair.
Deal economics
- At list price, monthly cash flow is $773 ($9k/yr) — positive.
- The deal already cash-flows at list — no discount required.
- Meets the 1% rule at list price ($3k rent vs $205k).
- Recommended offer: $202k (1.5% below list) — sets the bar for market timing.
- Cap rate 10.8% vs local median 1.9% in Tustin — top-decile yield for the area; either an underpriced asset or a hidden risk that comps aren't pricing in. Stress-test before assuming the spread holds.
Location & tenants
- Location reads 71/100 on livability (#215 in CA) — a middle-class / working-renter tenant base. Strengths: employment A+, commute B; Watch: health & safety D+, cost of living F.
- Tustin Unified (urban): math 46% / reading 65% proficiency, ranked #91 of 517 in CA (top 18%) — acceptable for families but not a draw, mixed tenant base, ~2y average lease.
- Zoned schools: Helen Estock Elementary (454 students, 89% FRL); Columbus Tustin Middle (math 24% / reading 24%, grade F, #277 of 498 statewide, top 73%, 609 students, 79% FRL); Foothill High (math 57% / reading 81%, grade B, #131 of 1,170 statewide, top 11%, 2,276 students, 26% FRL) — zoned schools average 65% FRL vs 33% district-wide (32 pts higher); higher-poverty schools than district average — tighter screening recommended.
- Market conditions: Rents rising fast (+4.1%/yr); 70 active listings in the ZIP; 40 comparable units currently listed for rent nearby; rentals at typical pace (median 24d on market — plan ~3-4 weeks tenant-placement turnaround); solid renter incomes; 6,974 units permitted in Orange County in 2024 (3,839 in 5+ unit buildings).
- This rent runs 33% of the median local income ($101k/yr) — at the standard rent-burdened threshold; future hikes will face affordability resistance.
Forward outlook
- Local home prices are declining (-3.0%/yr); year-one equity from $1k of loan paydown is wiped out by about $6k of value loss. Plan a longer hold.
- Orange County population projected at +14% by 2050 — modest demand growth; plan on rents tracking national, not racing it.
- At projected returns (-3.0% appreciation + 4.1% rent growth), your $57k cash investment doubles in ~7 years — after that, you're playing with house money.
Negotiation context
- It's been on market 23 days — a 2% lower offer ($202k) is reasonable based on typical stale-listing flexibility.
- 2 sale attempts since 8y ago with the ask held roughly flat each time — persistent listings suggest the price (not the market) is what's stuck; bring a comps-based counter.
- Current owner paid $34k; list at $205k implies a 503% gain — meaningful room to come down on a strong offer.
Risks & watch-outs
- Climate carrying-cost: extreme-heat days projected 7→20/yr by 2055 (HVAC capex compounding) — expect insurance premiums to compound above CPI over the hold.
Questions for the listing agent
- Have any recent inspections been done? Can we get a copy of the seller's disclosures and any deferred-maintenance estimates?
- Is there a deadline driving the sale (1031 exchange, divorce, estate, relocation)? That informs how much negotiation room exists.
- What's the average days-on-market for RENTAL listings here right now (not sales)? A rising rental-DOM trend means longer vacancies and softer asking-rent achievability than the comps imply.
- What's the recent tenant-quality profile in this submarket — average credit score on applications, eviction rate, late-payment / NSF rate, and stable-employment percentage? A property-management company in the area should have these aggregated.
- How much new for-sale + rental construction is in the pipeline within 1–3 miles? Heavy new supply typically softens prices + rents 12–24 months out; constrained supply supports both.
Investment metrics
- 1% rule
- 1.35% ✓
- Cap rate
- 10.82%
- Cash-on-cash
- 16.16%
- DSCR
- 1.72
- GRM
- 6.2
CMA / ARV
- ARV (on-the-fly)
- $190,806
- Comps found
- 7
Show comp detail 7 sales within ~0.75 mi
| Address | Dist | Beds/Ba | Sqft | Sold | Price | $/sf | Match |
|---|---|---|---|---|---|---|---|
| 123 S Colombo Ln #78 | 0.02mi | 2/2.0 | 1,081 (+0%) | 10mo | $146,000 | $135 | 90 |
| 138 E Balboa Ln #138 | 0.07mi | 2/2.0 | 1,080 (+0%) | 16mo | $117,500 | $109 | 83 |
| 121 S Portola Ln | 0.02mi | 3/2.0 (+1) | 1,120 (+4%) | 12mo | $129,900 | $116 | 78 |
| 130 Serra Ln #130 | 0.07mi | 3/2.0 (+1) | 1,054 (-2%) | 17mo | $217,500 | $206 | 74 |
| 128 E Balboa Ln | 0.06mi | 3/2.0 (+1) | 1,144 (+6%) | 12mo | $210,000 | $184 | 72 |
| 108 E Balboa Ln | 0.09mi | 3/2.0 (+1) | 1,200 (+11%) | 17mo | $212,000 | $177 | 58 |
| 1500 Warren St #155 | 0.72mi | 3/2.0 (+1) | 1,200 (+11%) | 17mo | $215,000 | $179 | 28 |
Match score weights: distance 35% · size 25% · config 20% · recency 20%. Top-matched comps best support the ARV.
Projected returns pro-forma
-3.0% appreciation · 4.12% rent growth · sell at horizon
- IRR
- 8.4%
- Equity multiple
- 1.33×
- Total profit
- $19,210
- Equity at exit
- $30,566
- IRR
- 18.6%
- Equity multiple
- 2.63×
- Total profit
- $93,546
- Equity at exit
- $17,725
Cash invested: $57,400 (down + closing). Projections, not guarantees.
Landlord ↔ Tenant lean methodology
- Overall (STATE)
- 18 Strongly Tenant-Friendly
- State California
- 18 Strongly Tenant-Friendly · D+13
- County
- — inherits STATE
- City
- — inherits STATE
ZIP-level market 92780
- Rents YoY
- 4.1%
- Active inventory
- 70
- Price-to-rent
- 6.2×
Monthly cashflow live
- Estimated rent
- $2,772 high interval (Pro) →
- Mortgage (P&I)
- −$1,075
- Tax est. 1.5%
- −$256 /mo · $3,075/yr
- Insurance
- −$85
- HOA
- −$0
- Vacancy / Maint / Mgmt
- −$582
- Net cashflow
- $773
Break-even live
Sensitivity live
| Price | -10% $915 | -5% $844 | +0% $773 | +5% $702 | +10% $631 |
|---|---|---|---|---|---|
| Rent | -10% $554 | -5% $663 | +0% $773 | +5% $882 | +10% $992 |
| Rate | -1.0pp $876 | -0.5pp $825 | base $773 | +0.5pp $720 | +1.0pp $666 |
UW: 25.0% down · 7.5% · 30yr · 1.5% tax · 5.0% vac · 8.0% maint · 8.0% mgmt
Financing live
Cash to close
- Down payment
- $51,250
- Closing costs
- $6,150
- Reserves months
- —
- Total cash needed
- —
Loan-product check · same deal, 3 products live
Conventional
25% down · 7.5% · 30yr
- Down + closing
- —
- Monthly P&I
- —
- Monthly cashflow
- —
- DSCR
- —
- Eligible?
- —
Personal DTI + credit; lowest rate.
DSCR
20% down · 8.5% · 30yr
- Down + closing
- —
- Monthly P&I
- —
- Monthly cashflow
- —
- DSCR
- —
- Eligible?
- —
No personal income docs; deal must DSCR.
Hard money
10% down · 12.0% · 12mo
- Down + closing
- —
- Monthly P&I
- —
- Monthly cashflow
- —
- DSCR
- —
- Eligible?
- —
Short-term bridge; refi at stabilization.
Rent comps 40 comps
| Address | Beds | Baths | Sqft | Rent | $/sqft | DOM | Units | Dist |
|---|---|---|---|---|---|---|---|---|
| 16586 Montego Way Tustin, CA | 3.0 | 2.0 | 1188 | $3,900 | $3.28 | 45d | 1 | 0.10mi |
| 15512 Williams St Unit A89 Tustin, CA | 2.0 | 2.0 | 1047 | $2,950 | $2.82 | 45d | 1 | 0.15mi |
| 15512 Williams St Apt L Tustin, CA | 2.0 | 2.0 | 1050 | $2,595 | $2.47 | 1d | 1 | 0.16mi |
| 15513 Williams St Unit Q013 Tustin, CA | 2.0 | 1.0 | 910 | $2,525 | $2.77 | 17d | 1 | 0.18mi |
| 16571 Alliance Ave Tustin, CA | 1.0–2.0 | 1.0 | 865 | $2,100 | $2.43 | 9d | 1 | 0.21mi |
| 15601 Tustin Village Way Tustin, CA | 1.0 | 1.0 | 800 | $2,245 | $2.81 | 5d | 1 | 0.21mi |
| 15610 Tustin Village Way Unit 09 Tustin, CA | 1.0 | 1.0 | 720 | $2,250 | $3.12 | 14d | 1 | 0.26mi |
| 15610 Tustin Village Way Unit 24 Tustin, CA | 1.0 | 1.0 | 720 | $2,100 | $2.92 | 26d | 1 | 0.26mi |
| 15610 Tustin Village Way Tustin, CA | 1.0 | 1.0 | 720 | $2,295 | $3.19 | 17d | 3 | 0.27mi |
| 15501 Pasadena Ave Tustin, CA | 1.0–2.0 | 1.0–2.0 | 750 | $2,800 | $3.73 | 1d | 11 | 0.28mi |
| 15701 Tustin Village Way Tustin, CA | 2.0 | 1.0 | 1062 | $2,850 | $2.68 | 17d | 1 | 0.28mi |
| 15701 Tustin Village Way Unit A-12 Tustin, CA | 2.0 | 1.0 | 1062 | $2,850 | $2.68 | 26d | 1 | 0.28mi |
| 15513 Williams St Apt J10 Tustin, CA | 1.0 | 1.0 | 716 | $2,150 | $3.00 | 13d | 1 | 0.29mi |
| 15513 Williams St Unit F018 Tustin, CA | 1.0 | 1.0 | 716 | $2,150 | $3.00 | 19d | 1 | 0.29mi |
| 15513 Williams St Unit O013 Tustin, CA | 1.0 | 1.0 | 716 | $2,150 | $3.00 | 45d | 1 | 0.29mi |
| 15660 Tustin Village Way Tustin, CA | 1.0–2.0 | 1.0 | 875 | $2,695 | $3.08 | 45d | 1 | 0.30mi |
| 15652 Williams St Tustin, CA | 1.0–2.0 | 1.0 | 862 | $2,750 | $3.19 | 45d | 9 | 0.32mi |
| 2112 E 1st St Santa Ana, CA | 1.0–4.0 | 1.0–2.0 | 939 | $2,135 | $2.27 | 17d | 1 | 0.34mi |
| 16661 McFadden Ave Unit 65 Tustin, CA | 1.0 | 1.0 | 700 | $2,150 | $3.07 | 45d | 1 | 0.38mi |
| 15742 Williams St Tustin, CA | 2.0 | 2.0 | 1100 | $2,798 | $2.54 | 4d | 1 | 0.39mi |
| 15482 Pasadena Ave Tustin, CA | 1.0–2.0 | 1.0–2.0 | 788 | $2,936 | $3.73 | 8d | 6 | 0.39mi |
| 17045 Medallion Ave Tustin, CA | 2.0 | 1.5 | 1200 | $3,100 | $2.58 | 45d | 1 | 0.43mi |
| 340 Pacific St Tustin, CA | 2.0 | 1.0 | 900 | $3,095 | $3.44 | 45d | 1 | 0.43mi |
| 16331 McFadden Ave Tustin, CA | 1.0 | 1.0 | 735 | $2,550 | $3.47 | 1d | 11 | 0.43mi |
| 15731 Pasadena Ave Unit 16 Tustin, CA | 2.0 | 1.0 | 1013 | $2,600 | $2.57 | 45d | 1 | 0.46mi |
| 1901 E 1st St Santa Ana, CA | 1.0–2.0 | 1.0–2.5 | 1267 | $4,467 | $3.53 | 1d | 16 | 0.47mi |
| 100 S Zoo Ln Santa Ana, CA | 2.0 | 1.0–2.0 | 864 | $4,987 | $5.77 | 0d | 27 | 0.51mi |
| 1001 S Lyon St Unit 24-S Santa Ana, CA | 2.0 | 2.0 | 1020 | $2,800 | $2.75 | 20d | 1 | 0.52mi |
| 1001 S Lyon St Unit 12-N Santa Ana, CA | 2.0 | 2.0 | 1020 | $2,800 | $2.75 | 45d | 1 | 0.52mi |
| 1001 S Lyon St Unit 8-N Santa Ana, CA | 2.0 | 2.0 | 1020 | $2,850 | $2.79 | 45d | 1 | 0.52mi |
| 1001 S Lyon St Unit 20-N Santa Ana, CA | 2.0 | 2.0 | 1020 | $2,650 | $2.60 | 45d | 1 | 0.52mi |
| 15695 S B St Tustin, CA | 2.0 | 1.0 | 1000 | $2,795 | $2.79 | 45d | 1 | 0.64mi |
| 17200 McFadden Ave Unit 11F Tustin, CA | 1.0 | 1.0 | 750 | $2,300 | $3.07 | 26d | 1 | 0.66mi |
| 17200 McFadden Ave Unit 06A Tustin, CA | 2.0 | 1.5 | 1230 | $3,195 | $2.60 | 26d | 1 | 0.66mi |
| 17272 Walnut Ave Tustin, CA | 1.0–2.0 | 1.0 | 750 | $2,785 | $3.71 | 5d | 2 | 0.67mi |
| 15722 S B St Tustin, CA | 2.0 | 2.0 | 1200 | $3,050 | $2.54 | 26d | 1 | 0.68mi |
| 521 N Tustin Ave Santa Ana, CA | 1.0 | 1.0 | 617 | $2,100 | $3.40 | 17d | 5 | 0.70mi |
| 15991 Altadena Dr Unit Domus Villas 16001 C Tustin, CA | 2.0 | 1.0 | 990 | $2,800 | $2.83 | 24d | 1 | 0.70mi |
| 17062 Altadena Dr., 15991 & 16001 Pasadena AVE Tustin, CA | 2.0 | 1.0 | 990 | $2,900 | $2.93 | 17d | 1 | 0.70mi |
| 15991 Bliss Ln Tustin, CA | 2.0 | 1.0 | 990 | $2,900 | $2.93 | 24d | 1 | 0.70mi |
Listing history 15 events
-
2026-06-21days on market $205,000 Active 23 DOM
-
2026-06-18days on market $205,000 Active 20 DOM
-
2026-06-17days on market $205,000 Active 19 DOM
-
2026-06-16days on market $205,000 Active 18 DOM
-
2026-06-15days on market $205,000 Active 17 DOM
-
2026-06-13days on market $205,000 Active 15 DOM
-
2026-06-13days on market $205,000 Active 14 DOM
-
2026-06-09days on market $205,000 Active 11 DOM
-
2026-06-08days on market $205,000 Active 10 DOM
-
2026-06-07days on market $205,000 Active 9 DOM
-
2026-06-04days on market $205,000 Active 6 DOM
-
2026-06-03days on market $205,000 Active 5 DOM
-
2026-06-02days on market $205,000 Active 4 DOM
-
2026-06-01days on market $205,000 Active 3 DOM
-
2026-05-31days on market $205,000 Active 2 DOM
ⓘ Source: listings_history table (triggers on properties + properties_extension) + one-shot
backfill from property_details.listing_events for pre-trigger history.
Climate risk First Street
- Flood 1/10 Low FEMA zone X (unshaded) · 0% chance over 30 yrs
- Wildfire 1/10 Low
- Heat 5/10 Major 7 d/yr ≥92°F today · 20 d/yr by 30 yrs out
- Wind 1/10 Low
- Air quality 4/10 Moderate 3 unhealthy d/yr today · 5 by 30 yrs out
Nearby sold comps map
Loading sold comps map…
Walkable amenities ~0.75 mi
Loading nearby amenities…
Taxation est. · year 1
- Rental income
- $33,260
- − Mortgage interest
- −$11,483
- − Property taxes
- −$3,075
- − Insurance
- −$1,025
- − Repairs & maintenance
- −$2,661
- − Management
- −$2,661
- − Depreciation
- −$5,964
- Taxable income
- $6,392
- Est. tax owed @ 24.0%
- −$1,534
- After-tax cash flow
- $7,741/yr
For passive investors: Depreciation is non-cash, so a rental often shows a tax loss while cash-flowing — sheltering income. Rental losses are passive: they offset passive income freely, and up to $25,000/yr can offset ordinary (W-2) income if you actively participate and your MAGI is under $100k (phasing out to $0 by $150k); unused losses carry forward. On sale, claimed depreciation is recaptured at up to 25%, and gains may owe capital-gains tax (a 1031 exchange can defer both). Figures are a year-1 estimate at your 24.0% rate — not tax advice; consult a CPA.
Condition & rehab AI · 2 photos
This manufactured home requires significant exterior and interior repairs and updates to improve its condition and value.
Repairs flagged
- Major exterior siding — Significant wear and tear
- Major exterior paint — Peeling and chipped
- Major interior paint — Chipped and worn
Value-add opportunities
- Resale exterior paint — Fresh paint can significantly improve curb appeal
- Resale interior paint — Fresh paint can make the interior look more modern and inviting
- Resale exterior siding — New siding can improve the home's appearance and increase its value
- Both interior updates — Updating the interior can make the home more appealing to both buyers and renters
Renovation cost estimate screening
| Repair item | Severity | Est. cost |
|---|---|---|
| exterior siding · Significant wear and tear | Major | $15,000–50,000 |
| exterior paint · Peeling and chipped | Major | $15,000–50,000 |
| interior paint · Chipped and worn | Major | $15,000–50,000 |
| Total estimated repair cost · 3 items | $45,000–150,000 |
Value-add ROI direction
- Resale exterior paint — Fresh paint can significantly improve curb appeal ↑
- Resale interior paint — Fresh paint can make the interior look more modern and inviting ↑
- Resale exterior siding — New siding can improve the home's appearance and increase its value ↑
- Both interior updates — Updating the interior can make the home more appealing to both buyers and renters ↑
ⓘ Cost ranges are severity-bucket heuristics (US national rule-of-thumb). Get contractor quotes + a written scope before underwriting a rehab budget.
Schools (NCES district)
- District
- Tustin Unified
- NCES district ID
- 0640150
- Math proficiency
- 46% ▼ -6.00%
- Reading proficiency
- 65% ▲ 4.00%
- Median HH income
- $81,864
- Composite
- 50.32/100
- National rank
- #1880
- State rank
- #91 of 517 in CA
Livability — Tustin
- Score
- 71/100
- State rank
- #215
- US rank
- #6806
Category grades
Schools grade is shown separately in the Schools card above.
Census & demographics
- Census place
- Tustin, CA
- County
- Orange County · 3,096,323 people
- City population
- 84,447
- Metro
- Los Angeles-Long Beach-Anaheim, CA
- Population (ZIP)
- 54,374
- Household income
- $101,017
- Rent vs Own
- Severe rent burden
- 3031.0
Population outlook (Orange County) Hauer SSP2
- Today (2025)
- 3,477,456 people
- By 2030
- 3,613,117 · +3.9%
- By 2040
- 3,835,945 · +10.3%
- By 2050
- 3,968,736 · +14.1%
- By 2075
- 4,097,053 · +17.8%
- By 2100
- 3,903,633 · +12.3%
Race, ethnicity, and origin ACS 2023
- Neighborhood character
- Diverse neighborhood (Simpson 0.64)
- Race & ethnicity
- Hispanic / Latino 52% White 27% Two or more races 16% Asian 14% Black 3%
- Hispanic origin (detail)
- Mexican 43%
- Common ancestry
- Romanian 1% Slovak 1% Italian 1%
- Foreign-born
- 33% · Canada, Vietnam, China
- Languages at home
- 47% English-only · Spanish 40% Other Indo-European 3% Tagalog/Filipino 2%
Political lean MEDSL · Orange
- 2024 margin
- Toss-up / Even · D 49.7% · R 47.1% · Other 3.2%
- 2008→2024 swing
- +5.2pp toward D · 2008: -2.6pp · 2024: 2.6pp
- All cycles
- 2024: D+2.6 2020: D+9.0 2016: D+7.7 2012: R+8.3 2008: R+2.6
Not yet ingested
- Civics
- —
Market trends
- HPI YoY
- ▼ -924.13%
- Current HPI
- 482.9143
- Rent YoY
- ▲ 4.12%
- Metro
- Los Angeles-Long Beach-Anaheim, CA
- State GDP YoY
- ▲ 3.21%
- F500 in state
- 116
Industry mix (Fortune 500 HQ in CA)
| Industry | F500 HQs | Revenue |
|---|---|---|
| Technology | 27 | $1,492B |
|
||
| Financial Services | 3 | $174B |
|
||
| Retail | 3 | $44B |
|
||
| Insurance | 3 | $26B |
|
||
| Media / Entertainment | 2 | $115B |
|
||
| Pharmaceuticals / Biotech | 2 | $62B |
|
||
Price history
+377.9% since first listed7 events — show timeline
- 2026-05-29 Listed $205,000 CRMLS
- 2018-06-21 Sold (MLS) $34,000 CRMLS
- 2018-06-09 Pending — CRMLS
- 2018-05-25 Contingent — CRMLS
- 2018-05-17 Price Changed $35,900 CRMLS
- 2018-05-17 Price Changed $33,900 CRMLS
- 2018-04-06 Listed $42,900 CRMLS
Cash-flow waterfall
monthlySold comps — $/sqft
last 12 mo · ≤1 miLoading sold comps…