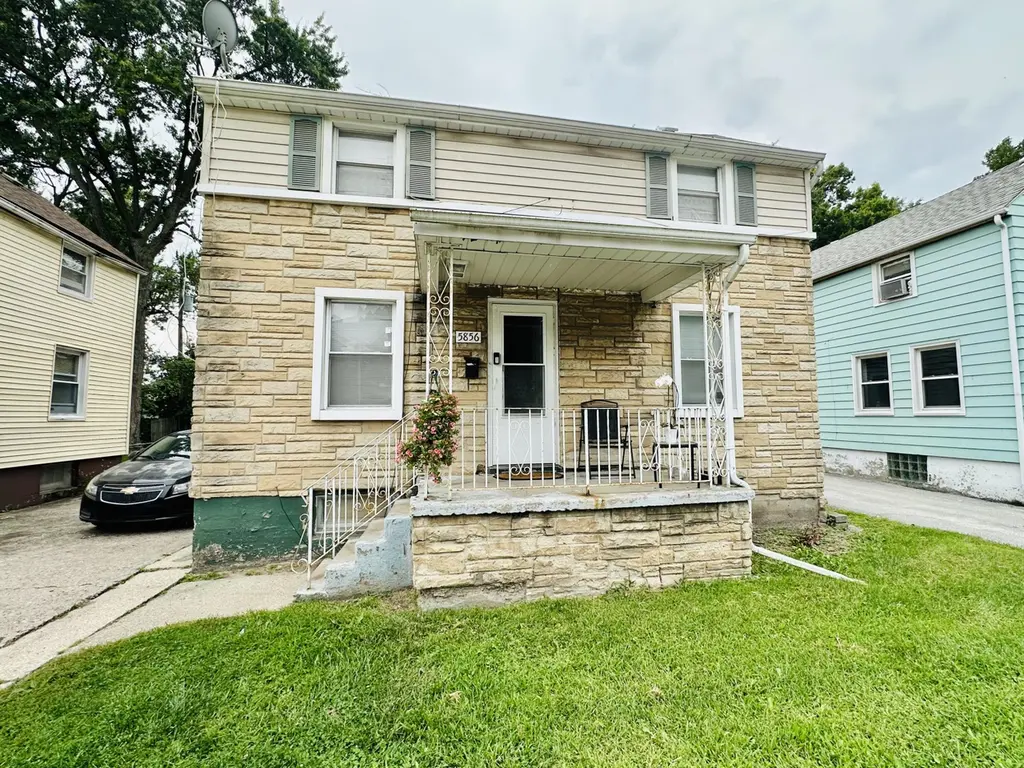
5856 Wallace Rd · Hammond, IN
Flood risk 1/10 · Minimal
- FEMA flood zone
- X (unshaded)
- Chance of flooding over 30 yrs
- 0.0%
- Est. flood insurance / yr
- $507 – $1,088
Fire risk 1/10 · Minimal
- Est. fire insurance / yr
- $717 – $1,331
Heat risk 3/10 · Minor
- Hot days now (above 102°F)
- 7 days/yr
- Hot days in 30 yrs
- 15 days/yr
Wind risk 2/10 · Minimal
- Chance of severe wind over 30 yrs
- 0.0%
Air-quality risk 4/10 · Minor
- Unhealthy air days now
- 5 days/yr
- Unhealthy air days in 30 yrs
- 6 days/yr
Risk factors via First Street. Map © Google.
Why this score? — see what drove the B grade
The composite is a weighted blend of 9 inputs, each scored 0–100. Each bar is that input's sub-score; the figure is the points it added to the 100-point composite (weight × sub-score).
- Cash flow +21.9/30.0
- ARV discount +15.0/15.0
- Appreciation +10.0/10.0
- DSCR +7.0/10.0
- 1% rule +5.7/10.0
- Rent growth +4.4/5.0
- Livability +3.5/5.0
- Condition / age +2.5/5.0
- Schools +1.1/10.0
$139,900
🖨 Deal sheet 📄 Offer letter ✓ Due diligence
Listing remarks
Three Bedroom two story home located in Hammond Indiana is looking for its new owners! This home has a nice floor plan with a bedroom, living room, dining room, kitchen and breakfast room all on the main level. The upper level features two large bedrooms, a full sized bathroom and large foyer. This home is conveniently located within shopping, highways and train. Take advantage of Hammond's down payment assistance program for owner occupants or by it as an investment and keep the current tenant!
Key facts
- Large foyer
- Main level
- Full sized bathroom
Tags
Property features AI
Finance
- Other: Currently tenant-occupied
Exterior
- Utilities: Public water; Public sewer; 100 amp electric service
- Home design: Two-story home; Built in 1917
- Construction: Unfinished basement
- Exterior features: Neighborhood view; Has unfinished basement
Interior
- Kitchen: Gas range; Range hood; Refrigerator
- Bedrooms: Primary bedroom; Two additional bedrooms
- Flooring: Laminate counters noted (flooring type not specified)
- Bathrooms: 1 full bathroom
- Heating & cooling: Forced air heating; Ceiling fan(s) for cooling
- Interior features: Ceiling fans; Country kitchen; Laminate countertops; Eat-in kitchen
- Laundry & utility: Washer; Dryer
Neighborhood map
What this means for you Summary
Snapshot
- This is a 3-bed/1.0-bath single-family listed at $140k.
Deal economics
- At list price, monthly cash flow is $220 ($3k/yr) — positive.
- The deal already cash-flows at list — no discount required.
- Meets the 1% rule at list price ($2k rent vs $140k).
- Recommended offer: $132k (6.0% below list) — sets the bar for market timing.
- Cap rate 8.2% vs local median 5.8% in Hammond — top-decile yield for the area; either an underpriced asset or a hidden risk that comps aren't pricing in. Stress-test before assuming the spread holds.
Location & tenants
- Location reads 70/100 on livability (#143 in IN) — a middle-class / working-renter tenant base. Strengths: cost of living A+, housing A+, commute A; Watch: health & safety D+, employment D, schools F.
- School City Of Hammond (suburban): math 8% / reading 18% proficiency, ranked #289 of 301 in IN (top 96%) — low school quality limits family demand, transient renter base, plan for 1-2y turnover; 74% free/reduced lunch — lower-income household profile, screen leases tightly.
- Market conditions: Rents rising fast (+7.6%/yr); 52 active listings in the ZIP; 11 comparable units currently listed for rent nearby; rentals at typical pace (median 15d on market — plan ~3-4 weeks tenant-placement turnaround); lower-income renter base — watch delinquency; 1,642 units permitted in Lake County in 2024 (14 in 5+ unit buildings).
- At $1,500/mo this rent would consume 48% of the median local household income ($37k/yr) (locally 900% of renters already pay >50% of income on rent) — very limited rent-growth headroom before tenants either downsize or default.
Forward outlook
- In year one you build about $15k of equity ($967 loan paydown + $14k appreciation (10.0% local appreciation)).
- Lake County population projected to shrink 7% by 2050 — rents likely to lag national; underwrite the cash flow, not the appreciation.
- At projected returns (10.0% appreciation + 7.6% rent growth), your $39k cash investment doubles in ~3 years — after that, you're playing with house money.
- By year 3, paydown + projected appreciation supports a ~$38k cash-out refi (75% LTV) — recoverable capital for the next deal without selling this one.
Negotiation context
- It's been on market 70 days — a 6% lower offer ($132k) is reasonable based on typical stale-listing flexibility.
- 4 sale attempts since 21y ago with the ask held roughly flat each time — persistent listings suggest the price (not the market) is what's stuck; bring a comps-based counter.
Risks & watch-outs
- Watch-outs: built in 1917 — expect roof / HVAC / electrical / plumbing capex.
Questions for the listing agent
- It's been on market 70 days. Have you received any prior offers? Is the seller open to a 6% concession, seller financing, or rate buy-down credit?
- Built in 1917 — when were the roof, HVAC, electrical panel, plumbing, and water heater last replaced?
- Why hasn't it sold? Are there any deal-killer items the seller is aware of (foundation, flood, title, zoning, code violations)?
- Is there a deadline driving the sale (1031 exchange, divorce, estate, relocation)? That informs how much negotiation room exists.
- Schools are F-rated, which usually means shorter tenancies and higher turnover. Who's the typical renter profile here, and what's been the actual vacancy rate?
- Crime grade is F in this area — have there been break-ins, vandalism, or insurance claims at this property in the last 3 years? What carrier currently insures it and at what premium?
- What's the average days-on-market for RENTAL listings here right now (not sales)? A rising rental-DOM trend means longer vacancies and softer asking-rent achievability than the comps imply.
- What's the recent tenant-quality profile in this submarket — average credit score on applications, eviction rate, late-payment / NSF rate, and stable-employment percentage? A property-management company in the area should have these aggregated.
- How much new for-sale + rental construction is in the pipeline within 1–3 miles? Heavy new supply typically softens prices + rents 12–24 months out; constrained supply supports both.
Investment metrics
- 1% rule
- 1.07% ✓
- Cap rate
- 8.18%
- Cash-on-cash
- 6.73%
- DSCR
- 1.30
- GRM
- 7.8
CMA / ARV
- ARV (on-the-fly)
- $169,260
- Comps found
- 12
Show comp detail 12 sales within ~0.75 mi
| Address | Dist | Beds/Ba | Sqft | Sold | Price | $/sf | Match |
|---|---|---|---|---|---|---|---|
| 5901 Columbia Ave | 0.03mi | 3/1.0 | 1,092 (0%) | 3mo | $158,000 | $145 | 96 |
| 1524-26 Truman St | 0.50mi | 3/1.0 | 1,120 (+3%) | 7mo | $165,000 | $147 | 67 |
| 907 Carroll St | 0.47mi | 3/1.0 | 1,008 (-8%) | 0mo | $257,000 | $255 | 65 |
| 1119 Sibley St | 0.45mi | 3/1.0 | 1,016 (-7%) | 3mo | $200,000 | $197 | 65 |
| 5960 White Oak Ave | 0.46mi | 3/1.0 | 1,032 (-6%) | 8mo | $110,000 | $107 | 62 |
| 1458 Shell St | 0.60mi | 3/1.0 | 1,065 (-2%) | 11mo | $165,000 | $155 | 59 |
| 934 Field St | 0.46mi | 2/1.0 (-1) | 963 (-12%) | 4mo | $132,500 | $138 | 50 |
| 1235 Logan St | 0.45mi | 3/1.0 | 962 (-12%) | 12mo | $85,000 | $88 | 49 |
| 817 Merrill St | 0.52mi | 4/2.0 (+1) | 956 (-12%) | 1mo | $228,000 | $238 | 45 |
| 904 Field St | 0.51mi | 4/1.0 (+1) | 1,250 (+14%) | 4mo | $221,400 | $177 | 44 |
| 913 Summer St | 0.53mi | 3/2.0 | 1,234 (+13%) | 8mo | $169,900 | $138 | 43 |
| 1476 Shell St | 0.60mi | 2/2.0 (-1) | 1,240 (+14%) | 8mo | $195,000 | $157 | 34 |
Match score weights: distance 35% · size 25% · config 20% · recency 20%. Top-matched comps best support the ARV.
Projected returns pro-forma
10.0% appreciation · 7.61% rent growth · sell at horizon
- IRR
- 31.1%
- Equity multiple
- 3.49×
- Total profit
- $97,478
- Equity at exit
- $126,033
- IRR
- 28.4%
- Equity multiple
- 8.50×
- Total profit
- $293,869
- Equity at exit
- $271,795
Cash invested: $39,172 (down + closing). Projections, not guarantees.
Landlord ↔ Tenant lean methodology
- Overall (STATE)
- 90 Strongly Landlord-Friendly
- State Indiana
- 90 Strongly Landlord-Friendly · R+11
- County
- — inherits STATE
- City
- — inherits STATE
ZIP-level market 46320
- Home prices YoY
- 5.0%
- Rents YoY
- 7.6%
- Active inventory
- 52
- Price-to-rent
- 7.8×
Monthly cashflow live
- Estimated rent
- $1,500 high interval (Pro) →
- Mortgage (P&I)
- −$734
- Tax from tax record
- −$174 /mo · $2,082/yr
- Insurance
- −$58
- HOA
- −$0
- Vacancy / Maint / Mgmt
- −$315
- Net cashflow
- $220
Break-even live
UW: 25.0% down · 7.5% · 30yr · 1.5% tax · 5.0% vac · 8.0% maint · 8.0% mgmt
Financing live
Cash to close
- Down payment
- $34,975
- Closing costs
- $4,197
- Reserves months
- —
- Total cash needed
- —
Loan-product check · same deal, 3 products live
Conventional
25% down · 7.5% · 30yr
- Down + closing
- —
- Monthly P&I
- —
- Monthly cashflow
- —
- DSCR
- —
- Eligible?
- —
Personal DTI + credit; lowest rate.
DSCR
20% down · 8.5% · 30yr
- Down + closing
- —
- Monthly P&I
- —
- Monthly cashflow
- —
- DSCR
- —
- Eligible?
- —
No personal income docs; deal must DSCR.
Hard money
10% down · 12.0% · 12mo
- Down + closing
- —
- Monthly P&I
- —
- Monthly cashflow
- —
- DSCR
- —
- Eligible?
- —
Short-term bridge; refi at stabilization.
Rent comps 11 comps
| Address | Beds | Baths | Sqft | Rent | $/sqft | DOM | Units | Dist |
|---|---|---|---|---|---|---|---|---|
| 1454 Sherman St Hammond, IN | 3.0 | 1.0 | 960 | $1,400 | $1.46 | 3d | 1 | 0.29mi |
| 1227 Logan St Hammond, IN | 2.0 | 1.0 | 768 | $1,350 | $1.76 | 15d | 1 | 0.50mi |
| 1227 Logan St Hammond, IN | 2.0 | 1.0 | 768 | $1,350 | $1.76 | 10d | 1 | 0.50mi |
| 1344 Michigan St Hammond, IN | 3.0 | 1.0 | 1006 | $1,595 | $1.59 | 15d | 1 | 0.57mi |
| 407 Kenwood St Hammond, IN | 2.0 | 1.0 | 920 | $1,495 | $1.62 | 24d | 1 | 1.09mi |
| 407 Kenwood St Hammond, IN | 2.0 | 1.0 | 920 | $1,495 | $1.62 | 16d | 1 | 1.09mi |
| 3 Waltham St Hammond, IN | 3.0 | 1.0 | 1200 | $1,095 | $0.91 | 24d | 1 | 1.35mi |
| 5 Ruth St Unit 2W Hammond, IN | 2.0 | 1.0 | 900 | $1,250 | $1.39 | 12d | 1 | 1.35mi |
| 3 Ruth St Hammond, IN | 2.0 | 1.0 | 900 | $1,250 | $1.39 | 24d | 1 | 1.35mi |
| 7019 Chestnut Ave Hammond, IN | 3.0 | 1.5 | 1440 | $1,895 | $1.32 | 20d | 1 | 1.40mi |
| 34 Elizabeth St Calumet City, IL | 3.0 | 1.0 | 1246 | $2,400 | $1.93 | 1d | 1 | 1.45mi |
Listing history 19 events
-
2026-06-18days on market $139,900 Active 70 DOM
-
2026-06-17days on market $139,900 Active 69 DOM
-
2026-06-16days on market $139,900 Active 68 DOM
-
2026-06-15days on market $139,900 Active 67 DOM
-
2026-06-13days on market $139,900 Active 65 DOM
-
2026-06-09days on market $139,900 Active 61 DOM
-
2026-06-08days on market $139,900 Active 60 DOM
-
2026-06-07days on market $139,900 Active 59 DOM
-
2026-06-04days on market $139,900 Active 56 DOM
-
2026-06-03days on market $139,900 Active 55 DOM
-
2026-06-02days on market $139,900 Active 54 DOM
-
2026-06-01days on market $139,900 Active 53 DOM
-
2026-05-31days on market $139,900 Active 52 DOM
-
2026-04-09$139,900 Active
-
2026-03-10historical
-
2025-09-07$139,900 Active
-
2013-05-13historical
-
2012-11-12$21,900
-
2005-02-11$79,900
ⓘ Source: listings_history table (triggers on properties + properties_extension) + one-shot
backfill from property_details.listing_events for pre-trigger history.
Tax reassessment forecast IN · Partial reset (capped growth)
- Current annual tax
- $2,082 · $174/mo
- Projected year-2 tax
- $2,082 · $174/mo
- Expected delta
- $0/yr ($0/mo · 0.0%)
ⓘ Screening estimate from a state-policy table — verify with the county assessor before closing.
Climate risk First Street
- Flood 1/10 Low FEMA zone X (unshaded) · 0% chance over 30 yrs
- Wildfire 1/10 Low
- Heat 3/10 Moderate 7 d/yr ≥102°F today · 15 d/yr by 30 yrs out
- Wind 2/10 Low 0% chance of damaging wind over 30 yrs
- Air quality 4/10 Moderate 5 unhealthy d/yr today · 6 by 30 yrs out
Nearby sold comps map
Loading sold comps map…
Walkable amenities ~0.75 mi
Loading nearby amenities…
Taxation est. · year 1
- Rental income
- $18,000
- − Mortgage interest
- −$7,837
- − Property taxes
- −$2,082
- − Insurance
- −$700
- − Repairs & maintenance
- −$1,440
- − Management
- −$1,440
- − Depreciation
- −$4,070
- Taxable income
- $432
- Est. tax owed @ 24.0%
- −$104
- After-tax cash flow
- $2,531/yr
For passive investors: Depreciation is non-cash, so a rental often shows a tax loss while cash-flowing — sheltering income. Rental losses are passive: they offset passive income freely, and up to $25,000/yr can offset ordinary (W-2) income if you actively participate and your MAGI is under $100k (phasing out to $0 by $150k); unused losses carry forward. On sale, claimed depreciation is recaptured at up to 25%, and gains may owe capital-gains tax (a 1031 exchange can defer both). Figures are a year-1 estimate at your 24.0% rate — not tax advice; consult a CPA.
Schools (NCES district)
- District
- School City Of Hammond
- NCES district ID
- 1804320
- Math proficiency
- 8% ▼ -18.00%
- Reading proficiency
- 18% ▼ -15.00%
- Median HH income
- $39,970
- Composite
- 11.11/100
- National rank
- #9730
- State rank
- #289 of 301 in IN
Livability — Hammond
- Score
- 70/100
- State rank
- #143
- US rank
- #7343
Category grades
Schools grade is shown separately in the Schools card above.
Census & demographics
- Census place
- Hammond, IN
- County
- Lake County · 422,878 people
- City population
- 58,809
- Metro
- Chicago-Naperville-Elgin, IL-IN-WI
- Population (ZIP)
- 14,353
- Household income
- $37,158
- Rent vs Own
- Severe rent burden
- 900.0
Population outlook (Lake County) Hauer SSP2
- Today (2025)
- 484,026 people
- By 2030
- 478,091 · -1.2%
- By 2040
- 462,974 · -4.3%
- By 2050
- 449,894 · -7.1%
- By 2075
- 436,169 · -9.9%
- By 2100
- 426,607 · -11.9%
Race, ethnicity, and origin ACS 2023
- Neighborhood character
- Diverse neighborhood (Simpson 0.64)
- Race & ethnicity
- Black 44% Hispanic / Latino 39% White 14% Two or more races 12% Asian 1%
- Hispanic origin (detail)
- Mexican 31% Puerto Rican 4%
- Common ancestry
- Romanian 2% Lithuanian 1%
- Foreign-born
- 14% · Canada
- Languages at home
- 68% English-only · Spanish 31%
Political lean MEDSL · Lake
- 2024 margin
- Lean D (+5.6) · D 52.1% · R 46.5% · Other 1.5%
- 2008→2024 swing
- -28.6pp toward R · 2008: 34.3pp · 2024: 5.6pp
- All cycles
- 2024: D+5.6 2020: D+15.1 2016: D+20.6 2012: D+31.0 2008: D+34.3
Not yet ingested
- Civics
- —
Market trends
- HPI YoY
- ▲ 13.81%
- Current HPI
- 288.1513
- Rent YoY
- ▲ 7.61%
- Metro
- Chicago-Naperville-Elgin, IL-IN-WI
- State GDP YoY
- ▲ 2.90%
- F500 in state
- 18
Industry mix (Fortune 500 HQ in IN)
| Industry | F500 HQs | Revenue |
|---|---|---|
| Industrial Machinery | 2 | $37B |
|
||
| Healthcare | 1 | $177B |
|
||
| Pharmaceuticals | 1 | $45B |
|
||
| Metals / Steel | 1 | $18B |
|
||
| Agriculture | 1 | $17B |
|
||
| Packaging | 1 | $12B |
|
||
Price history
+75.1% since first listed6 events — show timeline
- 2026-04-09 Listed $139,900 NIRA MLS as Distributed by MLS Grid
- 2026-03-10 Listing Removed — NIRA MLS as Distributed by MLS Grid
- 2025-09-07 Listed $139,900 NIRA MLS as Distributed by MLS Grid
- 2013-05-13 Listing Removed — NIRA MLS as Distributed by MLS Grid
- 2012-11-12 Listed $21,900 NIRA MLS as Distributed by MLS Grid
- 2005-02-11 Listed $79,900 NIRA MLS as Distributed by MLS Grid
Property tax history
+0.2%/yrLatest (2024): $2,082 · -10.4% YoY. Source: county tax records.
Cash-flow waterfall
monthlySold comps — $/sqft
last 12 mo · ≤1 miLoading sold comps…