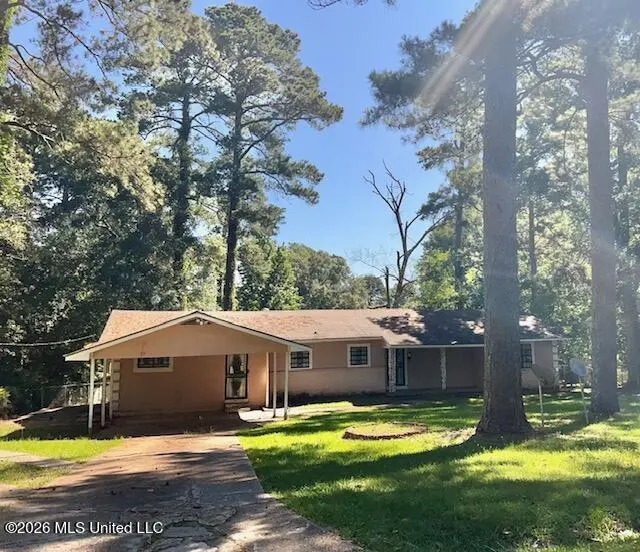
360 Pine Ridge Rd · Jackson, MS
Flood risk 1/10 · Minimal
- FEMA flood zone
- X (unshaded)
- Chance of flooding over 30 yrs
- 0.0%
- Est. flood insurance / yr
- $507 – $1,088
Fire risk 1/10 · Minimal
- Est. fire insurance / yr
- $1,241 – $2,305
Heat risk 7/10 · Major
- Hot days now (above 108°F)
- 7 days/yr
- Hot days in 30 yrs
- 19 days/yr
Wind risk 8/10 · Major
- Chance of severe wind over 30 yrs
- 80.0%
Air-quality risk 2/10 · Minimal
- Unhealthy air days now
- 0 days/yr
- Unhealthy air days in 30 yrs
- 1 days/yr
Risk factors via First Street. Map © Google.
Why this score? — see what drove the B grade
The composite is a weighted blend of 9 inputs, each scored 0–100. Each bar is that input's sub-score; the figure is the points it added to the 100-point composite (weight × sub-score).
- Cash flow +30.0/30.0
- ARV discount +11.9/15.0
- 1% rule +10.0/10.0
- DSCR +10.0/10.0
- Livability +3.4/5.0
- Rent growth +3.2/5.0
- Condition / age +2.5/5.0
- Schools +1.1/10.0
- Appreciation +0.0/10.0
$64,900
🖨 Deal sheet 📄 Offer letter ✓ Due diligence
Listing remarks
Welcome to your new home at 360 Pine Ridge Rd. , Jackson, MS. This 4/2 is close to schools, shopping, places of worship and restaurants. Huge fenced backyard with so much to offer. Don't miss seeing this home before it's gone. Call your Realtor today! Auction Dates - TBD - Selling As-Is. * * * This property is now active in an online auction. All offers must be submitted through the property's listing page on www. servicelinkauction.com. This sale is subject to a 5% or $2,500 minimum buyer's premium pursuant to the auction Terms & Conditions. All bids will be subject to seller approval (minimums may apply).
Key facts
- Close to schools
- Close to restaurants
- Fenced backyard
Tags
Property features AI
Exterior
- Parking: Carport with space for 2 vehicles
- Utilities: Public water; Public sewer
- Home design: Single-family house; One story; Living area reported as 2,000 (per public records)
- Construction: Brick construction; Conventional foundation; Year built (per public records)
- Exterior features: Asphalt shingle roof; Lot approximately 0.56 acres
Interior
- Bathrooms: Two full bathrooms
- Heating & cooling: Central heating; Central air; Ceiling fans
- Interior features: Fireplace
Neighborhood map
What this means for you Summary
Snapshot
- This is a 4-bed/2.0-bath single-family listed at $65k.
Deal economics
- At list price, monthly cash flow is $970 ($12k/yr) — positive.
- The deal already cash-flows at list — no discount required.
- Meets the 1% rule at list price ($2k rent vs $65k).
- Cap rate 24.2% vs local median 9.9% in Jackson — top-decile yield for the area; either an underpriced asset or a hidden risk that comps aren't pricing in. Stress-test before assuming the spread holds.
Location & tenants
- Location reads 68/100 on livability (#66 in MS) — a middle-class / working-renter tenant base. Strengths: commute A+, cost of living A+, housing A+; Watch: schools F, amenities F, employment F.
- Jackson Public School District (urban): math 9% / reading 18% proficiency, ranked #112 of 130 in MS (top 86%) — low school quality limits family demand, transient renter base, plan for 1-2y turnover; 88% free/reduced lunch — lower-income household profile, screen leases tightly.
- Market conditions: Rents rising (+2.8%/yr); 119 active listings in the ZIP; 11 comparable units currently listed for rent nearby; rentals at typical pace (median 24d on market — plan ~3-4 weeks tenant-placement turnaround); lower-income renter base — watch delinquency; 167 units permitted in Hinds County in 2024 (0 in 5+ unit buildings).
- At $1,795/mo this rent would consume 50% of the median local household income ($43k/yr) (locally 1554% of renters already pay >50% of income on rent) — very limited rent-growth headroom before tenants either downsize or default.
Forward outlook
- Local home prices are declining (-3.0%/yr); year-one equity from $449 of loan paydown is wiped out by about $2k of value loss. Plan a longer hold.
- Hinds County population projected to shrink 6% by 2050 — rents likely to lag national; underwrite the cash flow, not the appreciation.
- At projected returns (-3.0% appreciation + 2.8% rent growth), your $18k cash investment doubles in ~2 years — after that, you're playing with house money.
Negotiation context
- Only 1 days on market — expect competitive offers; lowballing is unlikely to land.
- 2 sale attempts with the ask held roughly flat each time — persistent listings suggest the price (not the market) is what's stuck; bring a comps-based counter.
Risks & watch-outs
- Watch-outs: built in 1956 — expect roof / HVAC / electrical / plumbing capex.
- Climate carrying-cost: severe wind risk, 80% chance of damaging wind over 30y; extreme-heat days projected 7→19/yr by 2055 (HVAC capex compounding) — expect insurance premiums to compound above CPI over the hold.
Questions for the listing agent
- Built in 1956 — when were the roof, HVAC, electrical panel, plumbing, and water heater last replaced?
- Is there a deadline driving the sale (1031 exchange, divorce, estate, relocation)? That informs how much negotiation room exists.
- Schools are F-rated, which usually means shorter tenancies and higher turnover. Who's the typical renter profile here, and what's been the actual vacancy rate?
- What's the average days-on-market for RENTAL listings here right now (not sales)? A rising rental-DOM trend means longer vacancies and softer asking-rent achievability than the comps imply.
- What's the recent tenant-quality profile in this submarket — average credit score on applications, eviction rate, late-payment / NSF rate, and stable-employment percentage? A property-management company in the area should have these aggregated.
- How much new for-sale + rental construction is in the pipeline within 1–3 miles? Heavy new supply typically softens prices + rents 12–24 months out; constrained supply supports both.
Investment metrics
- 1% rule
- 2.77% ✓
- Cap rate
- 24.22%
- Cash-on-cash
- 64.04%
- DSCR
- 3.85
- GRM
- 3.0
CMA / ARV
- ARV (on-the-fly)
- $72,000
- Comps found
- 11
Show comp detail 11 sales within ~0.75 mi
| Address | Dist | Beds/Ba | Sqft | Sold | Price | $/sf | Match |
|---|---|---|---|---|---|---|---|
| 411 Forest Ave | 0.09mi | 4/2.0 | 1,824 (-9%) | 9mo | $55,000 | $30 | 74 |
| 262 Iris Ave | 0.23mi | 3/2.0 (-1) | 1,768 (-12%) | 5mo | $59,900 | $34 | 61 |
| 436 Forest Ave | 0.22mi | 4/2.0 | 1,706 (-15%) | 8mo | $119,500 | $70 | 58 |
| 554 N North Park Dr | 0.44mi | 4/3.0 | 1,912 (-4%) | 12mo | $179,000 | $94 | 58 |
| 638 Elmwood Cir | 0.60mi | 5/2.0 (+1) | 2,019 (+1%) | 12mo | $39,900 | $20 | 56 |
| 644 Heather Lane Ln | 0.46mi | 3/2.5 (-1) | 1,980 (-1%) | 20mo | $55,000 | $28 | 53 |
| 4313 El Paso St | 0.25mi | 4/1.0 | 1,726 (-14%) | 16mo | $58,000 | $34 | 48 |
| 408 Robinhood Rd | 0.66mi | 4/3.0 | 2,112 (+6%) | 13mo | $75,000 | $36 | 45 |
| 4650 Manila Dr | 0.68mi | 4/2.0 | 1,732 (-13%) | 7mo | $169,000 | $98 | 41 |
| 4736 Kings Highway Hwy | 0.73mi | 4/2.5 | 2,200 (+10%) | 17mo | $135,000 | $61 | 33 |
| 4656 Meadowridge Dr | 0.73mi | 4/3.0 | 1,848 (-8%) | 20mo | $155,000 | $84 | 32 |
Match score weights: distance 35% · size 25% · config 20% · recency 20%. Top-matched comps best support the ARV.
Projected returns pro-forma
-3.0% appreciation · 2.83% rent growth · sell at horizon
- IRR
- 62.9%
- Equity multiple
- 3.80×
- Total profit
- $50,968
- Equity at exit
- $9,677
- IRR
- 67.4%
- Equity multiple
- 7.76×
- Total profit
- $122,770
- Equity at exit
- $5,611
Cash invested: $18,172 (down + closing). Projections, not guarantees.
Landlord ↔ Tenant lean methodology
- Overall (STATE)
- 90 Strongly Landlord-Friendly
- State Mississippi
- 90 Strongly Landlord-Friendly · R+11
- County
- — inherits STATE
- City
- — inherits STATE
ZIP-level market 39206
- Home prices YoY
- -10.3%
- Rents YoY
- 2.8%
- Active inventory
- 119
- Price-to-rent
- 3.0×
Monthly cashflow live
- Estimated rent
- $1,795 high interval (Pro) →
- Mortgage (P&I)
- −$340
- Tax est. 1.5%
- −$81 /mo · $974/yr
- Insurance
- −$27
- HOA
- −$0
- Vacancy / Maint / Mgmt
- −$377
- Net cashflow
- $970
Break-even live
UW: 25.0% down · 7.5% · 30yr · 1.5% tax · 5.0% vac · 8.0% maint · 8.0% mgmt
Financing live
Cash to close
- Down payment
- $16,225
- Closing costs
- $1,947
- Reserves months
- —
- Total cash needed
- —
Loan-product check · same deal, 3 products live
Conventional
25% down · 7.5% · 30yr
- Down + closing
- —
- Monthly P&I
- —
- Monthly cashflow
- —
- DSCR
- —
- Eligible?
- —
Personal DTI + credit; lowest rate.
DSCR
20% down · 8.5% · 30yr
- Down + closing
- —
- Monthly P&I
- —
- Monthly cashflow
- —
- DSCR
- —
- Eligible?
- —
No personal income docs; deal must DSCR.
Hard money
10% down · 12.0% · 12mo
- Down + closing
- —
- Monthly P&I
- —
- Monthly cashflow
- —
- DSCR
- —
- Eligible?
- —
Short-term bridge; refi at stabilization.
Rent comps 11 comps
| Address | Beds | Baths | Sqft | Rent | $/sqft | DOM | Units | Dist |
|---|---|---|---|---|---|---|---|---|
| 612 Heather Ln Jackson, MS | 4.0 | 2.0 | 1642 | $1,675 | $1.02 | 23d | 1 | 0.43mi |
| 220 Melbourne Rd Jackson, MS | 4.0 | 2.0 | 1744 | $1,350 | $0.77 | 43d | 1 | 0.79mi |
| 701 Cedarhurst Dr Jackson, MS | 4.0 | 2.0 | 1419 | $1,250 | $0.88 | 23d | 1 | 0.80mi |
| 341 E Northside Dr Jackson, MS | 4.0 | 2.0 | 1732 | $1,775 | $1.02 | 23d | 1 | 0.81mi |
| 622 Naples Rd Jackson, MS | 4.0 | 2.5 | 2210 | $1,650 | $0.75 | 23d | 1 | 0.99mi |
| 4627 Estelle Dr Jackson, MS | 3.0 | 2.0 | 1489 | $1,475 | $0.99 | 23d | 1 | 1.10mi |
| 724 Meadowbrook Rd Jackson, MS | 3.0 | 2.0 | 1593 | $2,150 | $1.35 | 43d | 1 | 1.20mi |
| 4091 Pine Hill Dr Jackson, MS | 3.0 | 2.0 | 1551 | $3,000 | $1.93 | 23d | 1 | 1.25mi |
| 4220 Council Cir Jackson, MS | 3.0 | 2.5 | 1780 | $1,850 | $1.04 | 23d | 1 | 1.33mi |
| 4056 Redwing Ave Jackson, MS | 3.0 | 2.0 | 1678 | $1,850 | $1.10 | 43d | 1 | 1.38mi |
| 20 N Hill Pkwy Jackson, MS | 1.0–3.0 | 1.0–2.5 | 1046 | $1,100 | $1.05 | 14d | 31 | 1.38mi |
Listing history 2 events
-
2026-06-18remarks 620-char remark
-
2026-06-18$64,900 Active 1 DOM
ⓘ Source: listings_history table (triggers on properties + properties_extension) + one-shot
backfill from property_details.listing_events for pre-trigger history.
Climate risk First Street
- Flood 1/10 Low FEMA zone X (unshaded) · 0% chance over 30 yrs
- Wildfire 1/10 Low
- Heat 7/10 Severe 7 d/yr ≥108°F today · 19 d/yr by 30 yrs out
- Wind 8/10 Severe 80% chance of damaging wind over 30 yrs
- Air quality 2/10 Low 0 unhealthy d/yr today · 1 by 30 yrs out
Nearby sold comps map
Loading sold comps map…
Walkable amenities ~0.75 mi
Loading nearby amenities…
Taxation est. · year 1
- Rental income
- $21,543
- − Mortgage interest
- −$3,635
- − Property taxes
- −$974
- − Insurance
- −$324
- − Repairs & maintenance
- −$1,723
- − Management
- −$1,723
- − Depreciation
- −$1,888
- Taxable income
- $11,275
- Est. tax owed @ 24.0%
- −$2,706
- After-tax cash flow
- $8,931/yr
For passive investors: Depreciation is non-cash, so a rental often shows a tax loss while cash-flowing — sheltering income. Rental losses are passive: they offset passive income freely, and up to $25,000/yr can offset ordinary (W-2) income if you actively participate and your MAGI is under $100k (phasing out to $0 by $150k); unused losses carry forward. On sale, claimed depreciation is recaptured at up to 25%, and gains may owe capital-gains tax (a 1031 exchange can defer both). Figures are a year-1 estimate at your 24.0% rate — not tax advice; consult a CPA.
Schools (NCES district)
- District
- Jackson Public School District
- NCES district ID
- 2802190
- Math proficiency
- 9% ▼ -14.00%
- Reading proficiency
- 18% ▼ -7.00%
- Median HH income
- $33,234
- Composite
- 10.89/100
- National rank
- #9755
- State rank
- #112 of 130 in MS
Livability — Jackson
- Score
- 68/100
- State rank
- #66
- US rank
- #9695
Category grades
Schools grade is shown separately in the Schools card above.
Census & demographics
- Census place
- Jackson, MS
- County
- Hinds County · 167,040 people
- City population
- 140,204
- Metro
- Jackson, MS
- Population (ZIP)
- 23,257
- Household income
- $42,686
- Rent vs Own
- Severe rent burden
- 1554.0
Population outlook (Hinds County) Hauer SSP2
- Today (2025)
- 242,528 people
- By 2030
- 241,113 · -0.6%
- By 2040
- 235,557 · -2.9%
- By 2050
- 226,946 · -6.4%
- By 2075
- 199,995 · -17.5%
- By 2100
- 164,165 · -32.3%
Race, ethnicity, and origin ACS 2023
- Neighborhood character
- Predominantly Black (85%)
- Race & ethnicity
- Black 85% White 9% Hispanic / Latino 3% Two or more races 3%
- Common ancestry
- Italian 1%
- Foreign-born
- 2% · Canada
- Languages at home
- 96% English-only · Spanish 3%
Political lean MEDSL · Hinds
- 2024 margin
- Solid D (+46.1) · D 72.4% · R 26.3% · Other 1.4%
- 2008→2024 swing
- +7.1pp toward D · 2008: 39.0pp · 2024: 46.1pp
- All cycles
- 2024: D+46.1 2020: D+48.3 2016: D+43.7 2012: D+45.1 2008: D+39.0
Not yet ingested
- Civics
- —
Market trends
- HPI YoY
- ▼ -22.38%
- Current HPI
- 194.5873
- Rent YoY
- ▲ 2.83%
- Metro
- Jackson, MS
- State GDP YoY
- —
- F500 in state
- 0
Price history
-38.8% since first listed10 events — show timeline
- 2026-06-18 Listed $64,900 MLSU
- 2026-04-27 Listing Removed — MLSU
- 2026-04-14 Price Changed $62,500 MLSU
- 2026-03-13 Price Changed $69,300 MLSU
- 2026-02-26 Price Changed $81,900 MLSU
- 2026-02-05 Listed $106,000 MLSU
- 2000-08-03 Sold (Public Records) — Public Records
- 1998-08-14 Sold (Public Records) — Public Records
- 1997-12-12 Sold (Public Records) — Public Records
- 1980-11-12 Sold (Public Records) — Public Records
Cash-flow waterfall
monthlySold comps — $/sqft
last 12 mo · ≤1 miLoading sold comps…