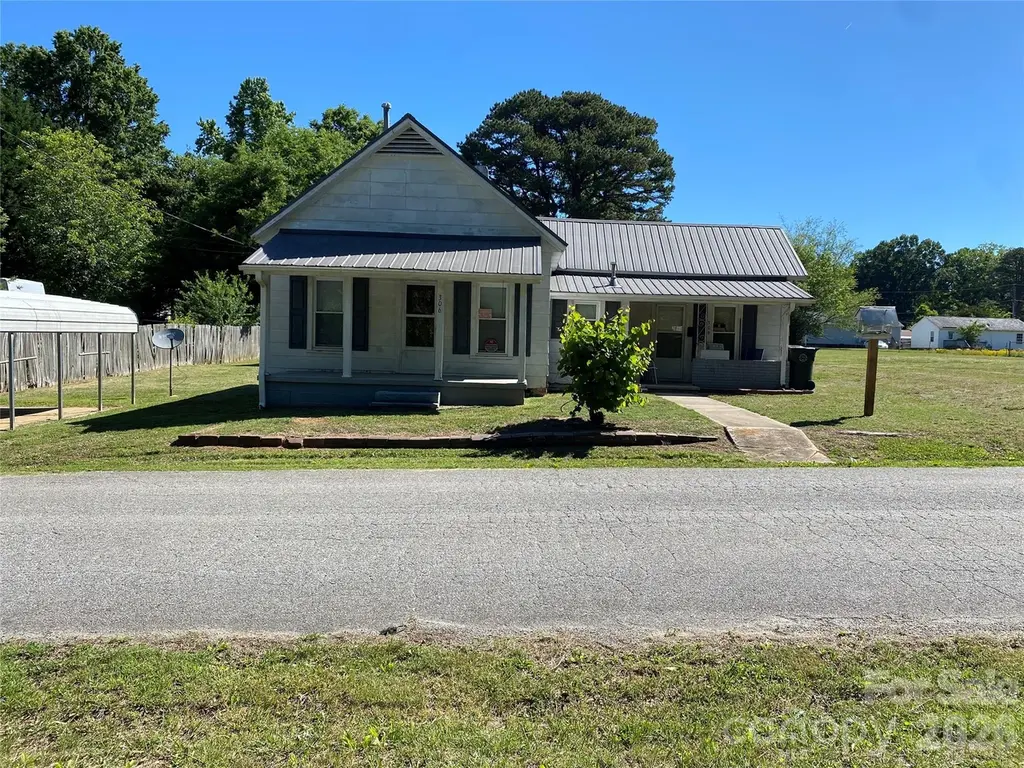
306 Howell St · Cherryville, NC
Flood risk 1/10 · Minimal
- FEMA flood zone
- X (unshaded)
- Chance of flooding over 30 yrs
- 0.0%
- Est. flood insurance / yr
- $507 – $1,088
Fire risk 3/10 · Minor
- Est. fire insurance / yr
- $906 – $1,684
Heat risk 6/10 · Moderate
- Hot days now (above 103°F)
- 7 days/yr
- Hot days in 30 yrs
- 17 days/yr
Wind risk 3/10 · Minor
- Chance of severe wind over 30 yrs
- 5.0%
Air-quality risk 3/10 · Minor
- Unhealthy air days now
- 3 days/yr
- Unhealthy air days in 30 yrs
- 3 days/yr
Risk factors via First Street. Map © Google.
Why this score? — see what drove the B- grade
The composite is a weighted blend of 9 inputs, each scored 0–100. Each bar is that input's sub-score; the figure is the points it added to the 100-point composite (weight × sub-score).
- Cash flow +25.6/30.0
- ARV discount +15.0/15.0
- DSCR +8.5/10.0
- 1% rule +5.5/10.0
- Livability +3.7/5.0
- Schools +3.6/10.0
- Rent growth +2.5/5.0
- Condition / age +2.5/5.0
- Appreciation +0.0/10.0
$125,000
🖨 Deal sheet (PDF) 📄 Offer letter ✓ Due diligence
Listing remarks
Investor special with endless potential in the heart of Cherryville! This charming 2-bedroom, 1-bath home is located on a quiet street and offers a great opportunity for investors, first-time buyers, or anyone looking for a fixer-upper project. Enjoy relaxing on the inviting front porch or envision the possibilities inside the cozy living room and functional layout. The property also includes an outbuilding for extra storage or workshop space and features a gas water heater. With a little vision and TLC, this home could truly shine!
Key facts
- Quiet street
- Gas water heater
- Inviting front porch
Tags
Property features AI
Finance
- HOA & community: No HOA
Exterior
- Parking: Parking spaces available
- Utilities: City water; Public sewer
- Home design: Single-family residence; Residential property; One level
- Construction: Site-built construction; Hardboard siding; Crawl space foundation
- Exterior features: Concrete road access; Publicly maintained road
Interior
- Kitchen: Gas cooktop
- Bedrooms: 2 bedrooms on the main level
- Bathrooms: 1 full bathroom on the main level
- Heating & cooling: Natural gas heating; Central air conditioning
- Interior features: 3 total rooms; Gas water heater
- Laundry & utility: Laundry inside the home
Neighborhood map
What this means for you Summary
Snapshot
- This is a 2-bed/1.0-bath single-family listed at $125k.
Deal economics
- At list price, monthly cash flow is $296 ($4k/yr) — positive.
- The deal already cash-flows at list — no discount required.
- Meets the 1% rule at list price ($1k rent vs $125k).
- Recommended offer: $121k (3.0% below list) — sets the bar for market timing.
- Cap rate 9.1% vs local median 4.2% in Cherryville — top-decile yield for the area; either an underpriced asset or a hidden risk that comps aren't pricing in. Stress-test before assuming the spread holds.
Location & tenants
- Location reads 74/100 on livability (#59 in NC, #4,744 nationally) — a middle-class / working-renter tenant base. Strengths: cost of living A+, housing A+, health & safety A+; Watch: amenities F, commute F.
- Gaston County Schools (suburban): math 44% / reading 42% proficiency, ranked #93 of 178 in NC (top 52%) — families likely to look elsewhere, expect single-tenant / working-renter base with shorter leases.
- Zoned schools: Cherryville Elementary (math 52% / reading 37%, grade F, #574 of 1,410 statewide, top 43%, 383 students, 67% FRL); John Chavis Middle School (math 43% / reading 38%, grade F, #215 of 475 statewide, top 46%, 413 students, 70% FRL); Cherryville High (math 62% / reading 57%, grade C+, #216 of 535 statewide, top 43%, 492 students, 59% FRL) — zoned schools average 65% FRL vs 37% district-wide (29 pts higher); higher-poverty schools than district average — tighter screening recommended.
- Market conditions: 128 active listings in the ZIP; 9 comparable units currently listed for rent nearby; rentals leasing fast (median 5d on market — plan ~1-2 weeks tenant-placement turnaround); 2,069 units permitted in Gaston County in 2024 (142 in 5+ unit buildings).
Forward outlook
- Local home prices are declining (-3.0%/yr); year-one equity from $864 of loan paydown is wiped out by about $4k of value loss. Plan a longer hold.
- Gaston County population projected at +12% by 2050 — modest demand growth; plan on rents tracking national, not racing it.
Negotiation context
- It's been on market 36 days — a 3% lower offer ($121k) is reasonable based on typical stale-listing flexibility.
Risks & watch-outs
- Watch-outs: built in 1920 — expect roof / HVAC / electrical / plumbing capex.
- Climate carrying-cost: extreme-heat days projected 7→17/yr by 2055 (HVAC capex compounding) — expect insurance premiums to compound above CPI over the hold.
Questions for the listing agent
- It's been on market 36 days. Have you received any prior offers? Is the seller open to a 3% concession, seller financing, or rate buy-down credit?
- Built in 1920 — when were the roof, HVAC, electrical panel, plumbing, and water heater last replaced?
- Is there a deadline driving the sale (1031 exchange, divorce, estate, relocation)? That informs how much negotiation room exists.
- Schools are D-rated, which usually means shorter tenancies and higher turnover. Who's the typical renter profile here, and what's been the actual vacancy rate?
- What's the average days-on-market for RENTAL listings here right now (not sales)? A rising rental-DOM trend means longer vacancies and softer asking-rent achievability than the comps imply.
- What's the recent tenant-quality profile in this submarket — average credit score on applications, eviction rate, late-payment / NSF rate, and stable-employment percentage? A property-management company in the area should have these aggregated.
- How much new for-sale + rental construction is in the pipeline within 1–3 miles? Heavy new supply typically softens prices + rents 12–24 months out; constrained supply supports both.
Investment metrics
- 1% rule
- 1.05% ✓
- Cap rate
- 9.13%
- Cash-on-cash
- 10.15%
- DSCR
- 1.45
- GRM
- 7.9
CMA / ARV
- ARV (on-the-fly)
- $194,106
- Comps found
- 12
Show comp detail 12 sales within ~0.75 mi
| Address | Dist | Beds/Ba | Sqft | Sold | Price | $/sf | Match |
|---|---|---|---|---|---|---|---|
| 302 W Carroll St | 0.49mi | 2/1.0 | 1,000 (-4%) | 5mo | $178,000 | $178 | 67 |
| 411 N Mulberry St | 0.57mi | 3/2.0 (+1) | 1,037 (-0%) | 1mo | $200,000 | $193 | 63 |
| 203 Putnam St | 0.08mi | 3/2.0 (+1) | 1,186 (+14%) | 5mo | $210,000 | $177 | 59 |
| 910 Delview Rd | 0.49mi | 3/1.0 (+1) | 1,104 (+6%) | 3mo | $152,900 | $138 | 59 |
| 702 Maple St | 0.25mi | 2/2.0 | 1,121 (+8%) | 19mo | $210,000 | $187 | 55 |
| 612 W Church St | 0.21mi | 2/2.0 | 1,135 (+9%) | 21mo | $142,749 | $126 | 53 |
| 402 Self St | 0.28mi | 2/1.0 | 884 (-15%) | 16mo | $190,000 | $215 | 49 |
| 502 North Dr | 0.49mi | 2/2.0 | 1,113 (+7%) | 16mo | $230,000 | $207 | 48 |
| 606 S Styers St | 0.31mi | 3/1.0 (+1) | 1,160 (+12%) | 16mo | $165,860 | $143 | 47 |
| 614 N Mountain St | 0.74mi | 2/1.0 | 997 (-4%) | 15mo | $200,000 | $201 | 46 |
| 500 North Dr | 0.47mi | 3/2.0 (+1) | 1,173 (+13%) | 10mo | $273,900 | $234 | 39 |
| 503 Mulberry St | 0.59mi | 3/2.5 (+1) | 1,160 (+12%) | 24mo | $215,000 | $185 | 22 |
Match score weights: distance 35% · size 25% · config 20% · recency 20%. Top-matched comps best support the ARV.
Projected returns pro-forma
-3.0% appreciation · 3.0% rent growth · sell at horizon
- IRR
- -1.1%
- Equity multiple
- 0.96×
- Total profit
- $-1,459
- Equity at exit
- $18,638
- IRR
- 8.5%
- Equity multiple
- 1.65×
- Total profit
- $22,785
- Equity at exit
- $10,808
Cash invested: $35,000 (down + closing). Projections, not guarantees.
Landlord ↔ Tenant lean methodology
- Overall (STATE)
- 85 Strongly Landlord-Friendly
- State North Carolina
- 85 Strongly Landlord-Friendly · R+3
- County
- — inherits STATE
- City
- — inherits STATE
ZIP-level market 28021
- Home prices YoY
- -20.8%
- Active inventory
- 128
- Price-to-rent
- 7.9×
Monthly cashflow live
- Estimated rent
- $1,317 high interval (Pro) →
- Mortgage (P&I)
- −$656
- Tax from tax record
- −$37 /mo · $439/yr
- Insurance
- −$52
- HOA
- −$0
- Vacancy / Maint / Mgmt
- −$276
- Net cashflow
- $296
Break-even live
Sensitivity live
| Price | -10% $367 | -5% $331 | +0% $296 | +5% $261 | +10% $225 |
|---|---|---|---|---|---|
| Rent | -10% $192 | -5% $244 | +0% $296 | +5% $348 | +10% $400 |
| Rate | -1.0pp $359 | -0.5pp $328 | base $296 | +0.5pp $264 | +1.0pp $231 |
UW: 25.0% down · 7.5% · 30yr · 1.5% tax · 5.0% vac · 8.0% maint · 8.0% mgmt
Financing live
Cash to close
- Down payment
- $31,250
- Closing costs
- $3,750
- Reserves months
- —
- Total cash needed
- —
Loan-product check · same deal, 3 products live
Conventional
25% down · 7.5% · 30yr
- Down + closing
- —
- Monthly P&I
- —
- Monthly cashflow
- —
- DSCR
- —
- Eligible?
- —
Personal DTI + credit; lowest rate.
DSCR
20% down · 8.5% · 30yr
- Down + closing
- —
- Monthly P&I
- —
- Monthly cashflow
- —
- DSCR
- —
- Eligible?
- —
No personal income docs; deal must DSCR.
Hard money
10% down · 12.0% · 12mo
- Down + closing
- —
- Monthly P&I
- —
- Monthly cashflow
- —
- DSCR
- —
- Eligible?
- —
Short-term bridge; refi at stabilization.
Rent comps 9 comps
| Address | Beds | Baths | Sqft | Rent | $/sqft | DOM | Units | Dist |
|---|---|---|---|---|---|---|---|---|
| 1006 Delview Rd Cherryville, NC | 3.0 | 1.0 | 1090 | $1,350 | $1.24 | 0d | 1 | 0.53mi |
| 516 North Dr Cherryville, NC | 3.0 | 1.0 | 1088 | $1,295 | $1.19 | 0d | 1 | 0.60mi |
| 1465 W Academy St Cherryville, NC | 1.0–2.0 | 1.0 | 788 | $1,225 | $1.55 | 0d | 22 | 0.60mi |
| 524 North Dr Cherryville, NC | 2.0 | 1.0 | 845 | $1,350 | $1.60 | 23d | 1 | 0.65mi |
| 512 N Mulberry St Cherryville, NC | 3.0 | 2.5 | 1384 | $1,800 | $1.30 | 18d | 1 | 0.66mi |
| 104 E Old Post Rd Cherryville, NC | 3.0 | 1.0 | 1000 | $1,200 | $1.20 | 25d | 1 | 0.86mi |
| 121 S Depot St Cherryville, NC | 2.0 | 1.5 | 1150 | $1,250 | $1.09 | 12d | 1 | 0.97mi |
| 808 E Main St Cherryville, NC | 2.0 | 1.0 | 790 | $1,050 | $1.33 | 0d | 1 | 1.20mi |
| 1200 E Academy St Apt 7 Cherryville, NC | 2.0 | 1.0 | 932 | $1,095 | $1.17 | 4d | 1 | 1.46mi |
Listing history 15 events
-
2026-06-21days on market $125,000 Active 36 DOM
-
2026-06-18days on market $125,000 Active 33 DOM
-
2026-06-17days on market $125,000 Active 32 DOM
-
2026-06-16days on market $125,000 Active 31 DOM
-
2026-06-15days on market $125,000 Active 30 DOM
-
2026-06-13days on market $125,000 Active 28 DOM
-
2026-06-09days on market $125,000 Active 24 DOM
-
2026-06-08days on market $125,000 Active 23 DOM
-
2026-06-07days on market $125,000 Active 22 DOM
-
2026-06-04days on market $125,000 Active 19 DOM
-
2026-06-03days on market $125,000 Active 18 DOM
-
2026-06-02days on market $125,000 Active 17 DOM
-
2026-06-01days on market $125,000 Active 16 DOM
-
2026-05-31days on market $125,000 Active 15 DOM
-
2026-05-16$125,000 Active
ⓘ Source: listings_history table (triggers on properties + properties_extension) + one-shot
backfill from property_details.listing_events for pre-trigger history.
Tax reassessment forecast NC · Resets to sale price
- Current annual tax
- $439 · $37/mo
- Projected year-2 tax
- $1,025 · $85/mo
- Expected delta
- +$586/yr (+$49/mo · 133.5%)
ⓘ Screening estimate from a state-policy table — verify with the county assessor before closing.
Climate risk First Street
- Flood 1/10 Low FEMA zone X (unshaded) · 0% chance over 30 yrs
- Wildfire 3/10 Moderate
- Heat 6/10 Major 7 d/yr ≥103°F today · 17 d/yr by 30 yrs out
- Wind 3/10 Moderate 5% chance of damaging wind over 30 yrs
- Air quality 3/10 Moderate 3 unhealthy d/yr today · 3 by 30 yrs out
Nearby sold comps map
Loading sold comps map…
Walkable amenities ~0.75 mi
Loading nearby amenities…
Taxation est. · year 1
- Rental income
- $15,800
- − Mortgage interest
- −$7,002
- − Property taxes
- −$439
- − Insurance
- −$625
- − Repairs & maintenance
- −$1,264
- − Management
- −$1,264
- − Depreciation
- −$3,636
- Taxable income
- $1,569
- Est. tax owed @ 24.0%
- −$377
- After-tax cash flow
- $3,175/yr
For passive investors: Depreciation is non-cash, so a rental often shows a tax loss while cash-flowing — sheltering income. Rental losses are passive: they offset passive income freely, and up to $25,000/yr can offset ordinary (W-2) income if you actively participate and your MAGI is under $100k (phasing out to $0 by $150k); unused losses carry forward. On sale, claimed depreciation is recaptured at up to 25%, and gains may owe capital-gains tax (a 1031 exchange can defer both). Figures are a year-1 estimate at your 24.0% rate — not tax advice; consult a CPA.
Schools (NCES district)
- District
- Gaston County Schools
- NCES district ID
- 3701620
- Math proficiency
- 44% ▲ 4.00%
- Reading proficiency
- 42% ▲ 1.00%
- Median HH income
- $43,644
- Composite
- 36.39/100
- National rank
- #4680
- State rank
- #93 of 178 in NC
Livability — Cherryville
- Score
- 74/100
- State rank
- #59
- US rank
- #4744
Category grades
Schools grade is shown separately in the Schools card above.
Census & demographics
- Census place
- Cherryville, NC
- Population (ZIP)
- 13,668
Population outlook (Gaston County) Hauer SSP2
- Today (2025)
- 230,027 people
- By 2030
- 237,300 · +3.2%
- By 2040
- 249,659 · +8.5%
- By 2050
- 257,806 · +12.1%
- By 2075
- 272,163 · +18.3%
- By 2100
- 268,652 · +16.8%
Race, ethnicity, and origin ACS 2023
- Neighborhood character
- Predominantly White (90%)
- Race & ethnicity
- White 90% Hispanic / Latino 4% Two or more races 4% Black 3%
- Common ancestry
- Serbian 3% Slovak 2% Lithuanian 2%
- Foreign-born
- 1% · Canada
- Languages at home
- 98% English-only · Spanish 2%
Political lean MEDSL · Gaston
- 2024 margin
- Strong R (+25.0) · D 37.0% · R 62.1%
- 2008→2024 swing
- 0.0pp no change · 2008: -25.0pp · 2024: -25.0pp
- All cycles
- 2024: R+25.0 2020: R+27.8 2016: R+32.1 2012: R+25.6 2008: R+25.0
Not yet ingested
- Civics
- —
Market trends
- HPI YoY
- ▼ -77.53%
- Current HPI
- 294.7695
- Rent YoY
- —
- Metro
- —
- State GDP YoY
- ▲ 3.28%
- F500 in state
- 26
Industry mix (Fortune 500 HQ in NC)
| Industry | F500 HQs | Revenue |
|---|---|---|
| Financial Services | 2 | $213B |
|
||
| Retail | 2 | $95B |
|
||
| Industrial Conglomerate | 1 | $38B |
|
||
| Metals / Steel | 1 | $35B |
|
||
| Utilities | 1 | $30B |
|
||
| Industrial Machinery | 1 | $19B |
|
||
Price history
1 event — show timeline
- 2026-05-16 Listed $125,000 CANOPYMLS as Distributed by MLS Grid
Property tax history
+9.5%/yrLatest (2025): $439 · +159.3% YoY. Source: county tax records.
Cash-flow waterfall
monthlySold comps — $/sqft
last 12 mo · ≤1 miLoading sold comps…