208 N 4th St · Montezuma, IA
Flood risk 1/10 · Minimal
- FEMA flood zone
- X (unshaded)
- Chance of flooding over 30 yrs
- 0.0%
- Est. flood insurance / yr
- $473 – $860
Fire risk 4/10 · Minor
- Est. fire insurance / yr
- $902 – $1,676
Heat risk 3/10 · Minor
- Hot days now (above 103°F)
- 7 days/yr
- Hot days in 30 yrs
- 15 days/yr
Wind risk 2/10 · Minimal
- Chance of severe wind over 30 yrs
- —
Air-quality risk 2/10 · Minimal
- Unhealthy air days now
- 1 days/yr
- Unhealthy air days in 30 yrs
- 1 days/yr
Risk factors via First Street. Map © Google.
Why this score? — see what drove the D+ grade
The composite is a weighted blend of 9 inputs, each scored 0–100. Each bar is that input's sub-score; the figure is the points it added to the 100-point composite (weight × sub-score).
- Appreciation +10.0/10.0
- Cash flow +9.4/30.0
- ARV discount +9.3/15.0
- Schools +6.5/10.0
- Livability +3.8/5.0
- DSCR +2.6/10.0
- Rent growth +2.5/5.0
- Condition / age +2.5/5.0
- 1% rule +1.9/10.0
$145,000
🖨 Deal sheet (PDF) 📄 Offer letter ✓ Due diligence
Listing remarks
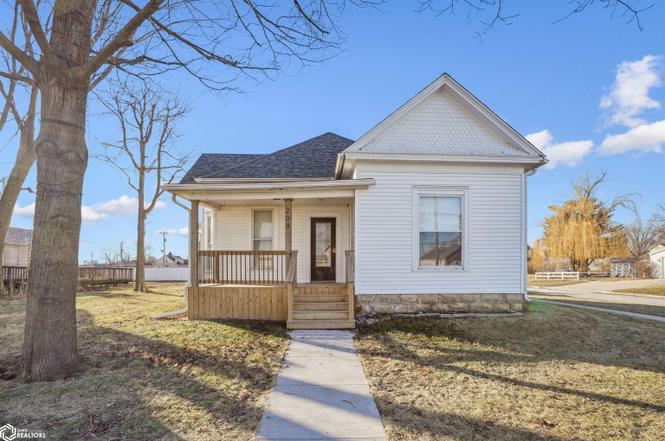
This beautiful home from the early 1990s is just two blocks from Montezuma square and a short walk to the school. It has retained much of its original character, including hardwood floors, impressive woodwork, colonnades dividing the living and dining rooms, large windows, a decorative front entry door with beveled glass, a covered porch, and a sunroom. Recent improvements include a new roof, siding, driveway, and sidewalks in 2024, as well as new carpet and freshly painted interior in 2025. The detached two-car garage provides protection for your vehicles and more. Call today to arrange a private tour.
Key facts
- Large windows
- Covered porch
- Woodwork
Tags
Neighborhood map
What this means for you Summary
Snapshot
- This is a 2-bed/1.5-bath single-family listed at $145k.
Deal economics
- At list price, monthly cash flow is $-103 ($-1k/yr) — negative.
- To cash-flow at today's rent, offer at most $127k (12.5% below list).
- To meet the 1% rule (rent ≥ 1% of price), the offer needs to be $101k (30.5% below list).
- Recommended offer: $101k (30.5% below list) — sets the bar for 1% rule.
- Cap rate 5.4% vs local median 1.5% in Montezuma — top-decile yield for the area; either an underpriced asset or a hidden risk that comps aren't pricing in. Stress-test before assuming the spread holds.
Location & tenants
- Location reads 75/100 on livability (#228 in IA, #4,319 nationally) — a middle-class / working-renter tenant base. Strengths: crime A+, cost of living A+, housing A+; Watch: amenities F, commute F, employment F.
- Montezuma Community School District (rural): math 73% / reading 79% proficiency, ranked #55 of 289 in IA (top 19%) — strong family-tenant draw, lease renewals of 3-5y typical.
- Zoned schools: Montezuma Elementary School (math 92% / reading 77%, grade A+, #31 of 616 statewide, top 6%, 229 students, 34% FRL); Montezuma Junior High School (math 62% / reading 72%, grade A-, #140 of 246 statewide, top 60%, 112 students, 39% FRL); Montezuma High School (math 67% / reading 87%, grade A-, #60 of 336 statewide, top 21%, 148 students, 28% FRL).
- Market conditions: 67 active listings in the ZIP; 27 units permitted in Poweshiek County in 2024 (0 in 5+ unit buildings).
Forward outlook
- In year one you build about $16k of equity ($1k loan paydown + $14k appreciation (10.0% local appreciation)).
- Poweshiek County population projected to shrink 3% by 2050 — rents likely to lag national; underwrite the cash flow, not the appreciation.
- By year 3, paydown + projected appreciation supports a ~$39k cash-out refi (75% LTV) — recoverable capital for the next deal without selling this one.
Negotiation context
- It's been on market 100 days — a 9% lower offer ($132k) is reasonable based on typical stale-listing flexibility.
- Current owner paid $53k; list at $145k implies a 174% gain — meaningful room to come down on a strong offer.
Risks & watch-outs
- Watch-outs: built in 1900 — expect roof / HVAC / electrical / plumbing capex.
Questions for the listing agent
- What do current leases actually rent for vs. the listed asking? Can we see a recent rent roll and the last 12 months of T-12 income?
- It's been on market 100 days. Have you received any prior offers? Is the seller open to a 31% concession, seller financing, or rate buy-down credit?
- Built in 1900 — when were the roof, HVAC, electrical panel, plumbing, and water heater last replaced?
- Why hasn't it sold? Are there any deal-killer items the seller is aware of (foundation, flood, title, zoning, code violations)?
- Is there a deadline driving the sale (1031 exchange, divorce, estate, relocation)? That informs how much negotiation room exists.
- Schools are A-rated — typically a magnet for longer-tenancy family renters. What's the average tenant stay here, and is there a school-zone premium baked into asking?
- The area grade is low — what's the realistic commute time and amenity access for the typical tenant pool here? Any planned neighborhood developments (good or bad) we should know about?
- What's the average days-on-market for RENTAL listings here right now (not sales)? A rising rental-DOM trend means longer vacancies and softer asking-rent achievability than the comps imply.
- What's the recent tenant-quality profile in this submarket — average credit score on applications, eviction rate, late-payment / NSF rate, and stable-employment percentage? A property-management company in the area should have these aggregated.
- How much new for-sale + rental construction is in the pipeline within 1–3 miles? Heavy new supply typically softens prices + rents 12–24 months out; constrained supply supports both.
Investment metrics
- 1% rule
- 0.69% ✗
- Cap rate
- 5.44%
- Cash-on-cash
- -3.04%
- DSCR
- 0.86
- GRM
- 12.0
CMA / ARV
- ARV (on-the-fly)
- $151,060
- Comps found
- 12
Show comp detail 12 sales within ~0.75 mi
| Address | Dist | Beds/Ba | Sqft | Sold | Price | $/sf | Match |
|---|---|---|---|---|---|---|---|
| 208 N 4th St | 0.00mi | 3/1.0 (+1) | 1,162 (0%) | 1mo | $142,000 | $122 | 92 |
| 506 E Dallas St | 0.30mi | 2/1.0 | 1,140 (-2%) | 13mo | $148,500 | $130 | 70 |
| 106 N 2nd St | 0.14mi | 3/1.0 (+1) | 1,286 (+11%) | 0mo | $144,000 | $112 | 69 |
| 406 N 4th St | 0.13mi | 2/1.0 | 1,248 (+7%) | 14mo | $85,000 | $68 | 68 |
| 403 S 3rd St | 0.35mi | 3/1.0 (+1) | 1,128 (-3%) | 6mo | $131,000 | $116 | 67 |
| 204 W Washington St | 0.29mi | 3/1.0 (+1) | 1,092 (-6%) | 4mo | $187,500 | $172 | 66 |
| 506 S 8th St | 0.52mi | 3/1.5 (+1) | 1,147 (-1%) | 5mo | $127,000 | $111 | 65 |
| 406 S 4th St | 0.37mi | 3/3.0 (+1) | 1,216 (+5%) | 1mo | $195,000 | $160 | 63 |
| 110 Sunnyside Dr | 0.49mi | 2/1.5 | 1,104 (-5%) | 12mo | $173,000 | $157 | 59 |
| 201 N 8th St | 0.28mi | 2/1.0 | 1,014 (-13%) | 10mo | $142,000 | $140 | 55 |
| 107 N 9th St | 0.37mi | 3/2.0 (+1) | 1,320 (+14%) | 5mo | $212,500 | $161 | 49 |
| 106 E Harrison St | 0.61mi | 3/1.0 (+1) | 1,056 (-9%) | 13mo | $96,000 | $91 | 39 |
Match score weights: distance 35% · size 25% · config 20% · recency 20%. Top-matched comps best support the ARV.
Projected returns pro-forma
10.0% appreciation · 3.0% rent growth · sell at horizon
- IRR
- 22.1%
- Equity multiple
- 2.78×
- Total profit
- $72,366
- Equity at exit
- $130,627
- IRR
- 19.8%
- Equity multiple
- 6.37×
- Total profit
- $218,166
- Equity at exit
- $281,703
Cash invested: $40,600 (down + closing). Projections, not guarantees.
Landlord ↔ Tenant lean methodology
- Overall (STATE)
- 83 Strongly Landlord-Friendly
- State Iowa
- 83 Strongly Landlord-Friendly · R+6
- County
- — inherits STATE
- City
- — inherits STATE
ZIP-level market 50171
- Home prices YoY
- 9.3%
- Active inventory
- 67
- Price-to-rent
- 12.0×
Monthly cashflow live
- Estimated rent
- $1,008 medium interval (Pro) →
- Mortgage (P&I)
- −$760
- Tax from tax record
- −$78 /mo · $938/yr
- Insurance
- −$60
- HOA
- −$0
- Vacancy / Maint / Mgmt
- −$212
- Net cashflow
- $-103
Break-even live
Sensitivity live
| Price | -10% $-21 | -5% $-62 | +0% $-103 | +5% $-144 | +10% $-185 |
|---|---|---|---|---|---|
| Rent | -10% $-183 | -5% $-143 | +0% $-103 | +5% $-63 | +10% $-23 |
| Rate | -1.0pp $-30 | -0.5pp $-66 | base $-103 | +0.5pp $-141 | +1.0pp $-179 |
UW: 25.0% down · 7.5% · 30yr · 1.5% tax · 5.0% vac · 8.0% maint · 8.0% mgmt
Financing live
Cash to close
- Down payment
- $36,250
- Closing costs
- $4,350
- Reserves months
- —
- Total cash needed
- —
Loan-product check · same deal, 3 products live
Conventional
25% down · 7.5% · 30yr
- Down + closing
- —
- Monthly P&I
- —
- Monthly cashflow
- —
- DSCR
- —
- Eligible?
- —
Personal DTI + credit; lowest rate.
DSCR
20% down · 8.5% · 30yr
- Down + closing
- —
- Monthly P&I
- —
- Monthly cashflow
- —
- DSCR
- —
- Eligible?
- —
No personal income docs; deal must DSCR.
Hard money
10% down · 12.0% · 12mo
- Down + closing
- —
- Monthly P&I
- —
- Monthly cashflow
- —
- DSCR
- —
- Eligible?
- —
Short-term bridge; refi at stabilization.
Listing history 3 events
-
2026-04-23status Pending
-
2026-01-13$145,000 Active
-
2005-12-13soldstatus $53,000
ⓘ Source: listings_history table (triggers on properties + properties_extension) + one-shot
backfill from property_details.listing_events for pre-trigger history.
Tax reassessment forecast IA · Partial reset (capped growth)
- Current annual tax
- $938 · $78/mo
- Projected year-2 tax
- $1,607 · $134/mo
- Expected delta
- +$669/yr (+$56/mo · 71.3%)
ⓘ Screening estimate from a state-policy table — verify with the county assessor before closing.
Climate risk First Street
- Flood 1/10 Low FEMA zone X (unshaded) · 0% chance over 30 yrs
- Wildfire 4/10 Moderate
- Heat 3/10 Moderate 7 d/yr ≥103°F today · 15 d/yr by 30 yrs out
- Wind 2/10 Low
- Air quality 2/10 Low 1 unhealthy d/yr today · 1 by 30 yrs out
Nearby sold comps map
Loading sold comps map…
Walkable amenities ~0.75 mi
Loading nearby amenities…
Taxation est. · year 1
- Rental income
- $12,092
- − Mortgage interest
- −$8,122
- − Property taxes
- −$938
- − Insurance
- −$725
- − Repairs & maintenance
- −$967
- − Management
- −$967
- − Depreciation
- −$4,218
- Taxable loss
- −$3,847
- Est. tax savings @ 24.0%
- +$923
- After-tax cash flow
- $-312/yr
For passive investors: Depreciation is non-cash, so a rental often shows a tax loss while cash-flowing — sheltering income. Rental losses are passive: they offset passive income freely, and up to $25,000/yr can offset ordinary (W-2) income if you actively participate and your MAGI is under $100k (phasing out to $0 by $150k); unused losses carry forward. On sale, claimed depreciation is recaptured at up to 25%, and gains may owe capital-gains tax (a 1031 exchange can defer both). Figures are a year-1 estimate at your 24.0% rate — not tax advice; consult a CPA.
Schools (NCES district)
- District
- Montezuma Community School District
- NCES district ID
- 1919590
- Math proficiency
- 73% ▼ -6.00%
- Reading proficiency
- 79% ▲ 3.00%
- Median HH income
- $57,449
- Composite
- 65.04/100
- National rank
- #503
- State rank
- #55 of 289 in IA
Livability — Montezuma
- Score
- 75/100
- State rank
- #228
- US rank
- #4319
Category grades
Schools grade is shown separately in the Schools card above.
Census & demographics
- Census place
- Montezuma, IA
- City population
- 2,445
- Population (ZIP)
- 2,445
Population outlook (Poweshiek County) Hauer SSP2
- Today (2025)
- 18,601 people
- By 2030
- 18,342 · -1.4%
- By 2040
- 17,944 · -3.5%
- By 2050
- 18,029 · -3.1%
- By 2075
- 19,945 · +7.2%
- By 2100
- 22,637 · +21.7%
Race, ethnicity, and origin ACS 2023
- Neighborhood character
- Predominantly White (93%)
- Race & ethnicity
- White 93% Two or more races 5% Hispanic / Latino 3%
- Common ancestry
- Iranian 5% Portuguese 5% Lithuanian 3%
- Foreign-born
- 1% · Canada, Jamaica
- Languages at home
- 98% English-only · Spanish 2%
Political lean MEDSL · Poweshiek
- 2024 margin
- R (+17.0) · D 40.8% · R 57.8% · Other 1.5%
- 2008→2024 swing
- -28.7pp toward R · 2008: 11.8pp · 2024: -17.0pp
- All cycles
- 2024: R+17.0 2020: R+13.3 2016: R+6.8 2012: D+9.1 2008: D+11.8
Not yet ingested
- Civics
- —
Market trends
- HPI YoY
- ▲ 30.91%
- Current HPI
- 364.6554
- Rent YoY
- —
- Metro
- —
- State GDP YoY
- ▲ 2.48%
- F500 in state
- 4
Industry mix (Fortune 500 HQ in IA)
| Industry | F500 HQs | Revenue |
|---|---|---|
| Financial Services | 1 | $16B |
|
||
| Retail / Convenience | 1 | $15B |
|
||
Price history
+173.6% since first listed3 events — show timeline
- 2026-04-23 Pending — IAR
- 2026-01-13 Listed $145,000 IAR
- 2005-12-13 Sold (Public Records) $53,000 Public Records
Property tax history
+2.2%/yrLatest (2025): $938 · +13.3% YoY. Source: county tax records.
Cash-flow waterfall
monthlySold comps — $/sqft
last 12 mo · ≤1 miLoading sold comps…