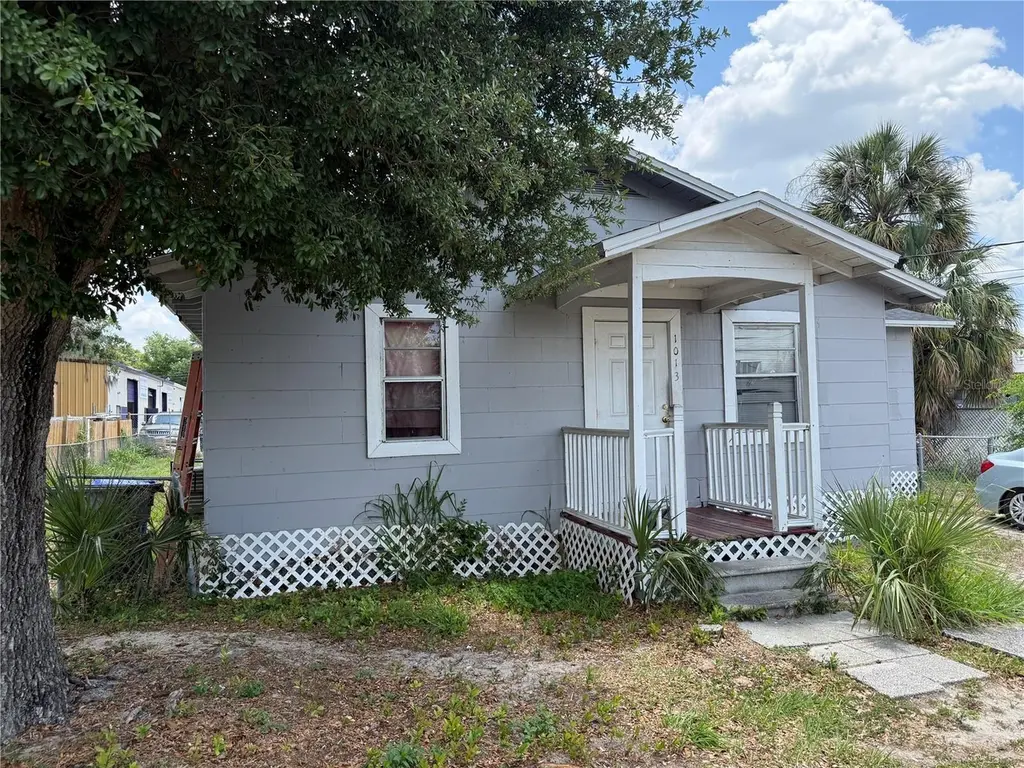
1013 N Ruth Ave · Lakeland, FL
Flood risk 1/10 · Minimal
- FEMA flood zone
- X (unshaded)
- Chance of flooding over 30 yrs
- 0.0%
- Est. flood insurance / yr
- $507 – $1,088
Fire risk 1/10 · Minimal
- Est. fire insurance / yr
- $947 – $1,759
Heat risk 9/10 · Severe
- Hot days now (above 108°F)
- 7 days/yr
- Hot days in 30 yrs
- 24 days/yr
Wind risk 9/10 · Severe
- Chance of severe wind over 30 yrs
- 99.0%
Air-quality risk 2/10 · Minimal
- Unhealthy air days now
- 1 days/yr
- Unhealthy air days in 30 yrs
- 1 days/yr
Risk factors via First Street. Map © Google.
Why this score? — see what drove the C+ grade
The composite is a weighted blend of 9 inputs, each scored 0–100. Each bar is that input's sub-score; the figure is the points it added to the 100-point composite (weight × sub-score).
- Cash flow +25.6/30.0
- DSCR +8.5/10.0
- ARV discount +7.5/15.0
- 1% rule +6.1/10.0
- Livability +3.9/5.0
- Schools +3.5/10.0
- Rent growth +2.7/5.0
- Condition / age +2.5/5.0
- Appreciation +0.0/10.0
$127,900
🖨 Deal sheet (PDF) 📄 Offer letter ✓ Due diligence
Listing remarks
Investor opportunity in Lakeland with tenant already in place and producing immediate cash flow. This 3-bedroom, 1-bath home features a spacious open floor plan, large fenced backyard, solid subfloors, and a strong foundation. Roof was replaced approximately 2 years ago, and the HVAC system is under 10 years old and operating properly. Property is currently tenant occupied with lease in place through October 2026 and tenant paying market rent — offering investors stable income from day one. Priced well below comparable renovated properties, this is a great opportunity for a buy-and-hold investor looking to add to their rental portfolio. Property is being sold as-is, with strong upside
Key facts
- Strong foundation
- Replaced roof
- Fenced backyard
Tags
Property features AI
Finance
- Other: Property zoning: RB-1
- Financial info: No lease restrictions reported; Homestead indicated
- HOA & community: No association indicated
Exterior
- Parking: Carport (1 space)
- Utilities: Public water; Public sewer; Cable connected; Electricity connected
- Home design: Single-family residence; One story; Faces east; Residential property
- Construction: Frame construction with wood siding; Shingle roof; Crawlspace foundation; Built area about 920 (public records)
- Exterior features: Asphalt road access; Lot approximately 0.18 acres
Interior
- Kitchen: Range; Refrigerator
- Bedrooms: 3 bedrooms
- Flooring: Carpet; Tile
- Bathrooms: 1 full bathroom
- Heating & cooling: Central heating (electric); Central air conditioning
- Interior features: Ceiling fans
- Laundry & utility: No laundry room features listed
Neighborhood map
What this means for you Summary
Snapshot
- This is a 3-bed/1.0-bath single-family listed at $128k.
Deal economics
- At list price, monthly cash flow is $301 ($4k/yr) — positive.
- The deal already cash-flows at list — no discount required.
- Meets the 1% rule at list price ($1k rent vs $128k).
- Recommended offer: $124k (3.0% below list) — sets the bar for market timing.
Location & tenants
- Location reads 77/100 on livability (#206 in FL, #3,179 nationally) — a middle-class / working-renter tenant base. Strengths: cost of living A+, housing A+, health & safety A+; Watch: employment D+, amenities F, commute F.
- Polk (suburban): math 39% / reading 43% proficiency, ranked #62 of 73 in FL (top 85%) — families likely to look elsewhere, expect single-tenant / working-renter base with shorter leases.
- Market conditions: Rents flat; 162 active listings in the ZIP; 33 comparable units currently listed for rent nearby; rentals at typical pace (median 25d on market — plan ~3-4 weeks tenant-placement turnaround); 10,384 units permitted in Polk County in 2024 (1,716 in 5+ unit buildings).
Forward outlook
- Local home prices are declining (-3.0%/yr); year-one equity from $884 of loan paydown is wiped out by about $4k of value loss. Plan a longer hold.
- Polk County population projected at +33% by 2050 — long-run rental-demand tailwind backs the buy-and-hold thesis.
Negotiation context
- It's been on market 33 days — a 3% lower offer ($124k) is reasonable based on typical stale-listing flexibility.
- 4 sale attempts since 22y ago; this cycle's ask has dropped $12k (9%) from the opening price — seller is motivated, your offer sets the floor, not the list.
- Current owner paid $28k; list at $128k implies a 357% gain — meaningful room to come down on a strong offer.
Risks & watch-outs
- Watch-outs: built in 1958 — expect roof / HVAC / electrical / plumbing capex.
- Climate carrying-cost: severe wind risk, 99% chance of damaging wind over 30y; extreme-heat days projected 7→24/yr by 2055 (HVAC capex compounding) — expect insurance premiums to compound above CPI over the hold.
Questions for the listing agent
- It's been on market 33 days. Have you received any prior offers? Is the seller open to a 3% concession, seller financing, or rate buy-down credit?
- Built in 1958 — when were the roof, HVAC, electrical panel, plumbing, and water heater last replaced?
- Is there a deadline driving the sale (1031 exchange, divorce, estate, relocation)? That informs how much negotiation room exists.
- What's the average days-on-market for RENTAL listings here right now (not sales)? A rising rental-DOM trend means longer vacancies and softer asking-rent achievability than the comps imply.
- What's the recent tenant-quality profile in this submarket — average credit score on applications, eviction rate, late-payment / NSF rate, and stable-employment percentage? A property-management company in the area should have these aggregated.
- How much new for-sale + rental construction is in the pipeline within 1–3 miles? Heavy new supply typically softens prices + rents 12–24 months out; constrained supply supports both.
Investment metrics
- 1% rule
- 1.11% ✓
- Cap rate
- 9.12%
- Cash-on-cash
- 10.08%
- DSCR
- 1.45
- GRM
- 7.5
CMA / ARV
No comps found within radius.
Projected returns pro-forma
-3.0% appreciation · 0.77% rent growth · sell at horizon
- IRR
- -3.6%
- Equity multiple
- 0.87×
- Total profit
- $-4,695
- Equity at exit
- $19,070
- IRR
- 3.5%
- Equity multiple
- 1.23×
- Total profit
- $8,297
- Equity at exit
- $11,058
Cash invested: $35,812 (down + closing). Projections, not guarantees.
Landlord ↔ Tenant lean methodology
- Overall (STATE)
- 87 Strongly Landlord-Friendly
- State Florida
- 87 Strongly Landlord-Friendly · R+3
- County
- — inherits STATE
- City
- — inherits STATE
ZIP-level market 33805
- Home prices YoY
- -29.8%
- Rents YoY
- 0.8%
- Active inventory
- 162
- Price-to-rent
- 7.5×
Monthly cashflow live
- Estimated rent
- $1,418 high interval (Pro) →
- Mortgage (P&I)
- −$671
- Tax from tax record
- −$96 /mo · $1,147/yr
- Insurance
- −$53
- HOA
- −$0
- Vacancy / Maint / Mgmt
- −$298
- Net cashflow
- $301
Break-even live
Sensitivity live
| Price | -10% $373 | -5% $337 | +0% $301 | +5% $265 | +10% $228 |
|---|---|---|---|---|---|
| Rent | -10% $189 | -5% $245 | +0% $301 | +5% $357 | +10% $413 |
| Rate | -1.0pp $365 | -0.5pp $333 | base $301 | +0.5pp $268 | +1.0pp $234 |
UW: 25.0% down · 7.5% · 30yr · 1.5% tax · 5.0% vac · 8.0% maint · 8.0% mgmt
Financing live
Cash to close
- Down payment
- $31,975
- Closing costs
- $3,837
- Reserves months
- —
- Total cash needed
- —
Loan-product check · same deal, 3 products live
Conventional
25% down · 7.5% · 30yr
- Down + closing
- —
- Monthly P&I
- —
- Monthly cashflow
- —
- DSCR
- —
- Eligible?
- —
Personal DTI + credit; lowest rate.
DSCR
20% down · 8.5% · 30yr
- Down + closing
- —
- Monthly P&I
- —
- Monthly cashflow
- —
- DSCR
- —
- Eligible?
- —
No personal income docs; deal must DSCR.
Hard money
10% down · 12.0% · 12mo
- Down + closing
- —
- Monthly P&I
- —
- Monthly cashflow
- —
- DSCR
- —
- Eligible?
- —
Short-term bridge; refi at stabilization.
Rent comps 33 comps
| Address | Beds | Baths | Sqft | Rent | $/sqft | DOM | Units | Dist |
|---|---|---|---|---|---|---|---|---|
| 1027 N Brunnell Pkwy Lakeland, FL | 2.0 | 1.0 | 826 | $1,050 | $1.27 | 3d | 1 | 0.06mi |
| 1035 N Davis Ave Lakeland, FL | 2.0 | 2.0 | 870 | $1,150 | $1.32 | 20d | 1 | 0.07mi |
| 1105 Jewel Ave Lakeland, FL | 2.0 | 1.0 | 987 | $1,200 | $1.22 | 24d | 1 | 0.14mi |
| 1137 Edith Ave Lakeland, FL | 3.0 | 1.0 | 1100 | $1,800 | $1.64 | 4d | 1 | 0.21mi |
| 1128 Roselle Ave Unit 1130 Lakeland, FL | 2.0 | 1.0 | 780 | $1,200 | $1.54 | 3d | 1 | 0.22mi |
| 1031 Neville Ave Lakeland, FL | 2.0 | 2.0 | 728 | $1,375 | $1.89 | 20d | 1 | 0.24mi |
| 815 N Davis Ave Lakeland, FL | 3.0 | 2.0 | 960 | $1,450 | $1.51 | 24d | 1 | 0.30mi |
| 806 N Swindell Ave Lakeland, FL | 3.0 | 2.0 | 995 | $1,450 | $1.46 | 24d | 1 | 0.37mi |
| 1480 Kathleen Rd Lakeland, FL | 2.0 | 1.0 | 868 | $1,345 | $1.55 | 4d | 1 | 0.61mi |
| 1211 Robert King High Dr Lakeland, FL | 3.0 | 1.5 | 1050 | $1,625 | $1.55 | 24d | 1 | 1.05mi |
| 820 W 13th St Lakeland, FL | 2.0 | 1.0 | 950 | $1,300 | $1.37 | 24d | 1 | 1.08mi |
| 2259 Chestnut Woods Dr Lakeland, FL | 2.0 | 1.0 | 1001 | $1,400 | $1.40 | 15d | 1 | 1.13mi |
| 2463 Chestnut Woods Dr Lakeland, FL | 2.0 | 1.0 | 910 | $1,500 | $1.65 | 24d | 1 | 1.18mi |
| 2735 W 10th St Unit 7 Lakeland, FL | 2.0 | 1.0 | 576 | $925 | $1.61 | 24d | 1 | 1.18mi |
| 1149 Sycamore St Unit 1149 Lakeland, FL | 2.0 | 2.0 | 970 | $1,700 | $1.75 | 24d | 1 | 1.18mi |
| 455 Arapahoe Ave Lakeland, FL | 2.0 | 1.0 | 750 | $1,199 | $1.60 | 20d | 1 | 1.21mi |
| 457 Arapahoe Ave Lakeland, FL | 2.0 | 1.0 | 750 | $1,095 | $1.46 | 3d | 1 | 1.22mi |
| 515 Oregon Ave Lakeland, FL | 3.0 | 2.0 | 1024 | $1,500 | $1.46 | 4d | 1 | 1.23mi |
| 1301 W Walnut St Lakeland, FL | 3.0 | 1.0 | 756 | $1,300 | $1.72 | 15d | 1 | 1.23mi |
| 1139 Olive St Lakeland, FL | 2.0 | 2.0 | 984 | $1,725 | $1.75 | 4d | 1 | 1.24mi |
| 524 Montana Ave Lakeland, FL | 2.0 | 1.0 | 817 | $1,300 | $1.59 | 24d | 1 | 1.26mi |
| 1031 N Florence Ave Unit NA Lakeland, FL | 3.0 | 2.0 | 1100 | $1,495 | $1.36 | 15d | 1 | 1.26mi |
| 2559 Chestnut Woods Dr Lakeland, FL | 2.0 | 1.0 | 1001 | $1,500 | $1.50 | 15d | 1 | 1.26mi |
| 607 Kansas Ave Lakeland, FL | 2.0 | 1.0 | 829 | $1,150 | $1.39 | 24d | 1 | 1.27mi |
| 510 Dade Ave Lakeland, FL | 2.0 | 1.0 | 936 | $1,149 | $1.23 | 15d | 1 | 1.27mi |
| 512 Dade Ave Lakeland, FL | 2.0 | 1.0 | 936 | $1,149 | $1.23 | 24d | 1 | 1.27mi |
| 711 N Virginia Ave Lakeland, FL | 2.0 | 1.0 | 780 | $1,100 | $1.41 | 24d | 1 | 1.27mi |
| 321 Emma St Lakeland, FL | 2.0 | 1.0 | 730 | $1,395 | $1.91 | 24d | 1 | 1.28mi |
| 518 Pinewood Ave Lakeland, FL | 2.0 | 1.0 | 891 | $1,175 | $1.32 | 24d | 1 | 1.30mi |
| 1618 Wayman St Lakeland, FL | 3.0 | 1.0 | 994 | $1,750 | $1.76 | 24d | 1 | 1.31mi |
| 131 Pear St Lakeland, FL | 2.0 | 1.0 | 741 | $950 | $1.28 | 24d | 1 | 1.41mi |
| 1704 Martin L King Jr Ave Lakeland, FL | 2.0 | 2.0 | 1050 | $5,000 | $4.76 | 24d | 1 | 1.44mi |
| 1040 Ruby St Lakeland, FL | 3.0 | 2.0 | 1110 | $1,595 | $1.44 | 11d | 1 | 1.50mi |
Listing history 24 events
-
2026-06-18days on market $127,900 Active 33 DOM
-
2026-06-17days on market $127,900 Active 32 DOM
-
2026-06-16days on market $127,900 Active 31 DOM
-
2026-06-15days on market $127,900 Active 30 DOM
-
2026-06-13days on market $127,900 Active 28 DOM
-
2026-06-10days on market $127,900 Active 25 DOM
-
2026-06-09days on market $127,900 Active 24 DOM
-
2026-06-08days on market $127,900 Active 23 DOM
-
2026-06-07pricedays on market $127,900 Active 22 DOM
-
2026-06-05days on market $132,900 Active 19 DOM
-
2026-06-03days on market $132,900 Active 18 DOM
-
2026-06-03days on market $132,900 Active 17 DOM
-
2026-06-01days on market $132,900 Active 16 DOM
-
2026-05-31days on market $132,900 Active 15 DOM
-
2026-05-21price $132,900
-
2026-05-16$139,900 Active
-
2007-08-27historical
-
2007-03-23$118,000
-
2007-03-21historical
-
2007-02-27$128,900
-
2005-02-17soldstatus $28,000
-
2004-08-26$32,000
-
1999-07-01soldstatus $30,600
-
1986-08-01soldstatus $30,600
ⓘ Source: listings_history table (triggers on properties + properties_extension) + one-shot
backfill from property_details.listing_events for pre-trigger history.
Tax reassessment forecast FL · Resets to sale price
- Current annual tax
- $1,147 · $96/mo
- Projected year-2 tax
- $1,147 · $96/mo
- Expected delta
- $0/yr ($0/mo · 0.0%)
ⓘ Screening estimate from a state-policy table — verify with the county assessor before closing.
Climate risk First Street
- Flood 1/10 Low FEMA zone X (unshaded) · 0% chance over 30 yrs
- Wildfire 1/10 Low
- Heat 9/10 Extreme 7 d/yr ≥108°F today · 24 d/yr by 30 yrs out
- Wind 9/10 Extreme 99% chance of damaging wind over 30 yrs
- Air quality 2/10 Low 1 unhealthy d/yr today · 1 by 30 yrs out
Nearby sold comps map
Loading sold comps map…
Walkable amenities ~0.75 mi
Loading nearby amenities…
Taxation est. · year 1
- Rental income
- $17,020
- − Mortgage interest
- −$7,164
- − Property taxes
- −$1,147
- − Insurance
- −$640
- − Repairs & maintenance
- −$1,362
- − Management
- −$1,362
- − Depreciation
- −$3,721
- Taxable income
- $1,625
- Est. tax owed @ 24.0%
- −$390
- After-tax cash flow
- $3,220/yr
For passive investors: Depreciation is non-cash, so a rental often shows a tax loss while cash-flowing — sheltering income. Rental losses are passive: they offset passive income freely, and up to $25,000/yr can offset ordinary (W-2) income if you actively participate and your MAGI is under $100k (phasing out to $0 by $150k); unused losses carry forward. On sale, claimed depreciation is recaptured at up to 25%, and gains may owe capital-gains tax (a 1031 exchange can defer both). Figures are a year-1 estimate at your 24.0% rate — not tax advice; consult a CPA.
Schools (NCES district)
- District
- Polk
- NCES district ID
- 1201590
- Math proficiency
- 39% ▼ -11.00%
- Reading proficiency
- 43% ▼ -4.00%
- Median HH income
- $43,979
- Composite
- 34.74/100
- National rank
- #5132
- State rank
- #62 of 73 in FL
Livability — Lakeland
- Score
- 77/100
- State rank
- #206
- US rank
- #3179
Category grades
Schools grade is shown separately in the Schools card above.
Census & demographics
- Census place
- Lakeland, FL
- County
- Polk County · 740,051 people
- City population
- 277,690
- Metro
- Lakeland-Winter Haven, FL
- Population (ZIP)
- 28,751
- Household income
- $62,661
- Rent vs Own
- Severe rent burden
- 1179.0
Population outlook (Polk County) Hauer SSP2
- Today (2025)
- 752,975 people
- By 2030
- 804,621 · +6.9%
- By 2040
- 906,117 · +20.3%
- By 2050
- 1,000,476 · +32.9%
- By 2075
- 1,197,520 · +59.0%
- By 2100
- 1,271,518 · +68.9%
Race, ethnicity, and origin ACS 2023
- Neighborhood character
- Diverse neighborhood (Simpson 0.68)
- Race & ethnicity
- White 38% Black 37% Hispanic / Latino 20% Two or more races 8% Asian 1%
- Hispanic origin (detail)
- Mexican 5% Puerto Rican 9% Cuban 2%
- Common ancestry
- Hispanic 2% Lithuanian 1% Romanian 1%
- Foreign-born
- 12% · Canada, Jamaica
- Languages at home
- 79% English-only · Spanish 16% French/Haitian/Cajun 2% Other Asian/Pacific 1%
Political lean MEDSL · Polk
- 2024 margin
- Strong R (+20.7) · D 39.2% · R 59.9%
- 2008→2024 swing
- -14.6pp toward R · 2008: -6.1pp · 2024: -20.7pp
- All cycles
- 2024: R+20.7 2020: R+14.4 2016: R+14.1 2012: R+6.8 2008: R+6.1
Not yet ingested
- Civics
- —
Market trends
- HPI YoY
- ▼ -158.44%
- Current HPI
- 372.7317
- Rent YoY
- ▲ 0.77%
- Metro
- Lakeland-Winter Haven, FL
- State GDP YoY
- ▲ 3.28%
- F500 in state
- 36
Industry mix (Fortune 500 HQ in FL)
| Industry | F500 HQs | Revenue |
|---|---|---|
| Industrial Technology | 2 | $29B |
|
||
| Insurance | 2 | $17B |
|
||
| Retail | 1 | $60B |
|
||
| Technology Distribution | 1 | $58B |
|
||
| Homebuilding | 1 | $35B |
|
||
| Technology Manufacturing | 1 | $35B |
|
||
Price history
+334.3% since first listed10 events — show timeline
- 2026-05-21 Price Changed $132,900 Stellar MLS as Distributed by MLS Grid
- 2026-05-16 Listed $139,900 Stellar MLS as Distributed by MLS Grid
- 2007-08-27 Listing Removed — Stellar MLS as Distributed by MLS Grid
- 2007-03-23 Listed $118,000 Stellar MLS as Distributed by MLS Grid
- 2007-03-21 Listing Removed — Stellar MLS as Distributed by MLS Grid
- 2007-02-27 Listed $128,900 Stellar MLS as Distributed by MLS Grid
- 2005-02-17 Sold (MLS) $28,000 Stellar MLS as Distributed by MLS Grid
- 2004-08-26 Listed $32,000 Stellar MLS as Distributed by MLS Grid
- 1999-07-01 Sold (Public Records) $30,600 Public Records
- 1986-08-01 Sold (Public Records) $30,600 Public Records
Property tax history
+4.8%/yrLatest (2025): $1,147 · +7.6% YoY. Source: county tax records.
Cash-flow waterfall
monthlySold comps — $/sqft
last 12 mo · ≤1 miLoading sold comps…