 Duplex
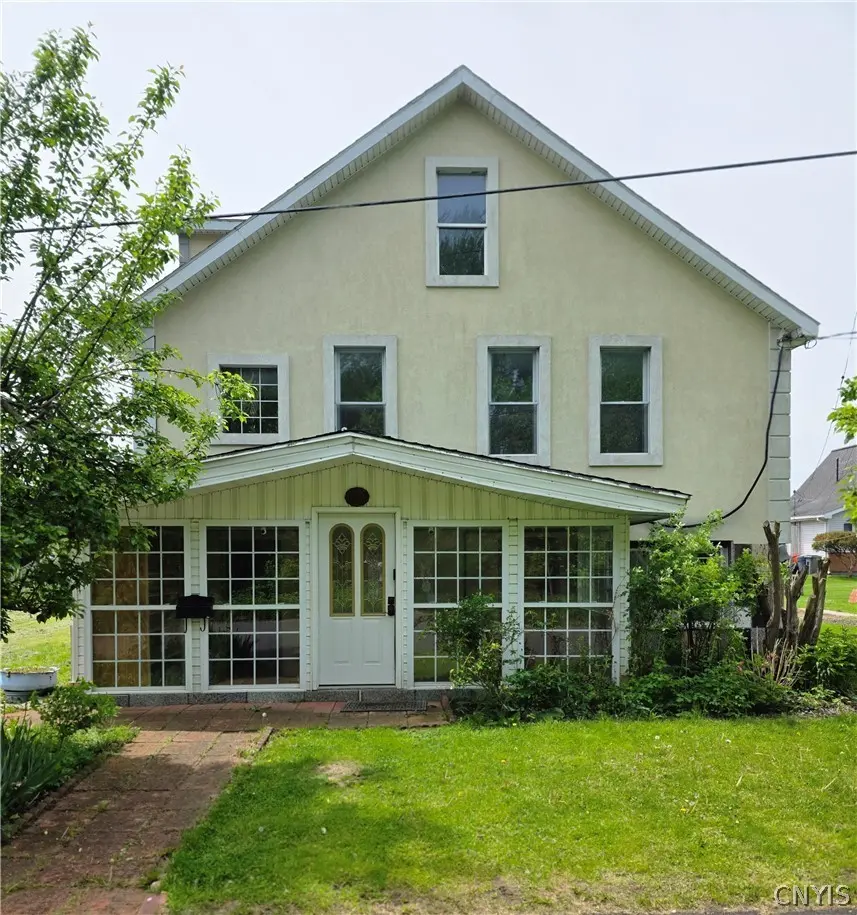
1812 Culver Ct · Utica, NY
Flood risk 1/10 · Minimal
- FEMA flood zone
- X (unshaded)
- Chance of flooding over 30 yrs
- 0.0%
- Est. flood insurance / yr
- $507 – $1,088
Fire risk 2/10 · Minimal
- Est. fire insurance / yr
- $691 – $1,283
Heat risk 3/10 · Minor
- Hot days now (above 95°F)
- 7 days/yr
- Hot days in 30 yrs
- 17 days/yr
Wind risk 2/10 · Minimal
- Chance of severe wind over 30 yrs
- 1.0%
Air-quality risk 2/10 · Minimal
- Unhealthy air days now
- 0 days/yr
- Unhealthy air days in 30 yrs
- 1 days/yr
Risk factors via First Street. Map © Google.
Why this score? — see what drove the B grade
The composite is a weighted blend of 9 inputs, each scored 0–100. Each bar is that input's sub-score; the figure is the points it added to the 100-point composite (weight × sub-score).
- Cash flow +27.3/30.0
- Appreciation +10.0/10.0
- DSCR +9.5/10.0
- ARV discount +7.5/15.0
- 1% rule +6.3/10.0
- Livability +4.0/5.0
- Schools +2.9/10.0
- Rent growth +2.5/5.0
- Condition / age +2.5/5.0
$299,900
🖨 Deal sheet 📄 Offer letter ✓ Due diligence
Multi-family units
County records classify this as Multi-Family (2-4 Unit). Listing-text estimate: 2 units. confirmed
Listing remarks
Nice, well-maintained East Utica 2-family home located on a quiet dead-end street directly across from Proctor Park. This property features a 2-bedroom apartment on the first floor and a spacious 3-bedroom apartment on the second floor. Many updates have been completed, including renovated kitchens with newer appliances, updated bathrooms, newer flooring, some new sheetrock walls, doors, windows, and updated stucco facades. An added bonus: the sale includes an extra vacant lot measuring 40x122, offering additional space and future potential. Great opportunity for investors or owner-occupants looking to live in one unit and rent the other.
Key facts
- Renovated kitchens
- Newer flooring
- Newer appliances
Tags
Property features AI
Finance
- Other: Multi-unit property with 2 total units; Single gas meter for property; Single electric meter for property
- Financial info: Operating expense details: see remarks; Owner pays: see remarks
Exterior
- Parking: Paved driveway with two or more spaces
- Utilities: Cable available; Electricity available and connected (circuit breakers); Public water available and connected; Sewer available and connected
- Home design: 2-story property; Resale condition
- Construction: Stucco exterior; Asphalt roof; Poured foundation; Copper and PEX plumbing; Built (existing structure)
- Exterior features: Covered porch; Located on a cul-de-sac; Flag lot
Interior
- Flooring: Ceramic tile; Laminate; Varied flooring
- Bathrooms: 2 full bathrooms
- Heating & cooling: Gas heating; Hot water heating
- Interior features: Attic; Partial basement
- Laundry & utility: Gas water heater
Neighborhood map
What this means for you Summary
Snapshot
- This is a 1×2bd/1.0ba + 1×3bd/1.0ba units multifamily listed at $300k.
Deal economics
- At list price, monthly cash flow is $870 ($10k/yr) — positive. Per door: $435/mo.
- The deal already cash-flows at list — no discount required.
- Meets the 1% rule at list price ($3k rent vs $300k).
- Recommended offer: $295k (1.5% below list) — sets the bar for market timing.
- Cap rate 9.8% vs local median 7.7% in Utica — meaningfully above typical; check what's discounted (condition, days-on-market, listing class) to confirm the premium yield is real.
Location & tenants
- Location reads 80/100 on livability (#104 in NY, #1,589 nationally) — a professional / high-income tenant draw. Strengths: commute A+, cost of living A+, housing A+; Watch: employment D, schools D-, crime F.
- Utica City School District (urban): math 33% / reading 38% proficiency, ranked #562 of 590 in NY (top 95%) — families likely to look elsewhere, expect single-tenant / working-renter base with shorter leases; 71% free/reduced lunch — lower-income household profile, screen leases tightly.
- Market conditions: 143 active listings in the ZIP; 204 units permitted in Oneida County in 2024 (68 in 5+ unit buildings).
- At $3,395/mo this rent would consume 78% of the median local household income ($53k/yr) (locally 2251% of renters already pay >50% of income on rent) — very limited rent-growth headroom before tenants either downsize or default.
Forward outlook
- In year one you build about $32k of equity ($2k loan paydown + $30k appreciation (10.0% local appreciation)).
- Oneida County population projected at -12% by 2050 — secular population decline; favor cash flow + early exit over multi-decade hold.
- At projected returns (10.0% appreciation + 3.0% rent growth), your $84k cash investment doubles in ~2 years — after that, you're playing with house money.
- By year 2, paydown + projected appreciation supports a ~$52k cash-out refi (75% LTV) — recoverable capital for the next deal without selling this one.
Negotiation context
- It's been on market 24 days — a 2% lower offer ($295k) is reasonable based on typical stale-listing flexibility.
- Current owner paid $69k; list at $300k implies a 335% gain — meaningful room to come down on a strong offer.
Risks & watch-outs
- Watch-outs: built in 1940 — expect roof / HVAC / electrical / plumbing capex.
Questions for the listing agent
- Can we see the unit-by-unit rent roll, current vacancy, and any below-market leases? What's the average tenancy length?
- What capital expenditures (roof, boiler, parking lot, exteriors) have been made in the last 5 years, and what's planned in the next 2?
- Built in 1940 — when were the roof, HVAC, electrical panel, plumbing, and water heater last replaced?
- Is there a deadline driving the sale (1031 exchange, divorce, estate, relocation)? That informs how much negotiation room exists.
- Schools are D-rated, which usually means shorter tenancies and higher turnover. Who's the typical renter profile here, and what's been the actual vacancy rate?
- Crime grade is F in this area — have there been break-ins, vandalism, or insurance claims at this property in the last 3 years? What carrier currently insures it and at what premium?
- What's the average days-on-market for RENTAL listings here right now (not sales)? A rising rental-DOM trend means longer vacancies and softer asking-rent achievability than the comps imply.
- What's the recent tenant-quality profile in this submarket — average credit score on applications, eviction rate, late-payment / NSF rate, and stable-employment percentage? A property-management company in the area should have these aggregated.
- How much new apartment / multifamily construction is in the pipeline within 1–3 miles? Heavy new supply (>2% of stock underway) typically softens rents 12–24 months out; light construction supports rent growth.
Investment metrics
- 1% rule
- 1.13% ✓
- Cap rate
- 9.78%
- Cash-on-cash
- 12.44%
- DSCR
- 1.55
- GRM
- 7.4
CMA / ARV
- ARV (on-the-fly)
- $178,066
- Comps found
- 9
Show comp detail 9 sales within ~0.75 mi
| Address | Dist | Beds/Ba | Sqft | Sold | Price | $/sf | Match |
|---|---|---|---|---|---|---|---|
| 517 Jefferson Ave | 0.47mi | 5/2.5 | 2,192 (-3%) | 4mo | $150,000 | $68 | 68 |
| 1222 Mummery St | 0.54mi | 5/2.0 | 2,401 (+6%) | 6mo | $195,000 | $81 | 58 |
| 1020 Tilden Ave | 0.33mi | 6/2.0 (+1) | 2,508 (+11%) | 5mo | $230,000 | $92 | 57 |
| 1709 Catherine St | 0.30mi | 6/2.0 (+1) | 1,998 (-11%) | 11mo | $169,900 | $85 | 53 |
| 413 Tilden Ave | 0.27mi | 5/2.0 | 2,560 (+14%) | 15mo | $180,000 | $70 | 53 |
| 518 Wetmore St | 0.31mi | 6/2.0 (+1) | 2,530 (+12%) | 12mo | $201,000 | $79 | 50 |
| 935 Jay St | 0.62mi | 6/2.0 (+1) | 2,474 (+10%) | 0mo | $102,500 | $41 | 50 |
| 915 Blandina St | 0.67mi | 6/2.0 (+1) | 2,068 (-8%) | 15mo | $135,000 | $65 | 38 |
| 1136 Hilton Ave | 0.74mi | 4/2.0 (-1) | 2,064 (-8%) | 17mo | $226,000 | $109 | 32 |
Match score weights: distance 35% · size 25% · config 20% · recency 20%. Top-matched comps best support the ARV.
Projected returns pro-forma
10.0% appreciation · 3.0% rent growth · sell at horizon
- IRR
- 33.4%
- Equity multiple
- 3.60×
- Total profit
- $218,662
- Equity at exit
- $270,174
- IRR
- 28.8%
- Equity multiple
- 8.15×
- Total profit
- $600,111
- Equity at exit
- $582,640
Cash invested: $83,972 (down + closing). Projections, not guarantees.
Landlord ↔ Tenant lean methodology
- Overall (STATE)
- 15 Strongly Tenant-Friendly
- State New York
- 15 Strongly Tenant-Friendly · D+10
- County
- — inherits STATE
- City
- — inherits STATE
ZIP-level market 13501
- Home prices YoY
- 5.6%
- Active inventory
- 143
- Price-to-rent
- 15.6×
Monthly cashflow live
- Estimated rent
- $3,395 medium interval (Pro) →
- Mortgage (P&I)
- −$1,573
- Tax from tax record
- −$114 /mo · $1,367/yr
- Insurance
- −$125
- HOA
- −$0
- Vacancy / Maint / Mgmt
- −$713
- Net cashflow
- $870
Break-even live
2-unit breakdown (identical units grouped — click to expand)
| Units | Beds | Baths | Est. rent |
|---|---|---|---|
| 1× unit | 2 | 1 | $1,606 |
| 1× unit | 3 | 1 | $1,788 |
| Total (2 units) | $3,395 | ||
UW: 25.0% down · 7.5% · 30yr · 1.5% tax · 5.0% vac · 8.0% maint · 8.0% mgmt
Financing live
Cash to close
- Down payment
- $74,975
- Closing costs
- $8,997
- Reserves months
- —
- Total cash needed
- —
Loan-product check · same deal, 3 products live
Conventional
25% down · 7.5% · 30yr
- Down + closing
- —
- Monthly P&I
- —
- Monthly cashflow
- —
- DSCR
- —
- Eligible?
- —
Personal DTI + credit; lowest rate.
DSCR
20% down · 8.5% · 30yr
- Down + closing
- —
- Monthly P&I
- —
- Monthly cashflow
- —
- DSCR
- —
- Eligible?
- —
No personal income docs; deal must DSCR.
Hard money
10% down · 12.0% · 12mo
- Down + closing
- —
- Monthly P&I
- —
- Monthly cashflow
- —
- DSCR
- —
- Eligible?
- —
Short-term bridge; refi at stabilization.
Listing history 16 events
-
2026-06-17status $299,900 Pending 24 DOM
-
2026-06-16days on market $299,900 Active Under Contract 24 DOM
-
2026-06-15days on market $299,900 Active Under Contract 23 DOM
-
2026-06-14days on market $299,900 Active Under Contract 21 DOM
-
2026-06-13days on market $299,900 Active Under Contract 20 DOM
-
2026-06-10days on market $299,900 Active Under Contract 18 DOM
-
2026-06-09days on market $299,900 Active Under Contract 17 DOM
-
2026-06-08days on market $299,900 Active Under Contract 16 DOM
-
2026-06-07statusdays on market $299,900 Active Under Contract 15 DOM
-
2026-06-03days on market $299,900 Active 11 DOM
-
2026-06-02days on market $299,900 Active 10 DOM
-
2026-06-01days on market $299,900 Active 9 DOM
-
2026-05-31days on market $299,900 Active 8 DOM
-
2026-05-30days on market $299,900 Active 7 DOM
-
2026-05-23$299,900 Active
-
2005-12-15soldstatus $68,900
ⓘ Source: listings_history table (triggers on properties + properties_extension) + one-shot
backfill from property_details.listing_events for pre-trigger history.
Tax reassessment forecast NY · Partial reset (capped growth)
- Current annual tax
- $1,367 · $114/mo
- Projected year-2 tax
- $3,218 · $268/mo
- Expected delta
- +$1,850/yr (+$154/mo · 135.3%)
ⓘ Screening estimate from a state-policy table — verify with the county assessor before closing.
Climate risk First Street
- Flood 1/10 Low FEMA zone X (unshaded) · 0% chance over 30 yrs
- Wildfire 2/10 Low
- Heat 3/10 Moderate 7 d/yr ≥95°F today · 17 d/yr by 30 yrs out
- Wind 2/10 Low 100% chance of damaging wind over 30 yrs
- Air quality 2/10 Low 0 unhealthy d/yr today · 1 by 30 yrs out
Nearby sold comps map
Loading sold comps map…
Walkable amenities ~0.75 mi
Loading nearby amenities…
Taxation est. · year 1
- Rental income
- $40,740
- − Mortgage interest
- −$16,799
- − Property taxes
- −$1,367
- − Insurance
- −$1,500
- − Repairs & maintenance
- −$3,259
- − Management
- −$3,259
- − Depreciation
- −$8,724
- Taxable income
- $5,831
- Est. tax owed @ 24.0%
- −$1,399
- After-tax cash flow
- $9,046/yr
For passive investors: Depreciation is non-cash, so a rental often shows a tax loss while cash-flowing — sheltering income. Rental losses are passive: they offset passive income freely, and up to $25,000/yr can offset ordinary (W-2) income if you actively participate and your MAGI is under $100k (phasing out to $0 by $150k); unused losses carry forward. On sale, claimed depreciation is recaptured at up to 25%, and gains may owe capital-gains tax (a 1031 exchange can defer both). Figures are a year-1 estimate at your 24.0% rate — not tax advice; consult a CPA.
Schools (NCES district)
- District
- Utica City School District
- NCES district ID
- 3629370
- Math proficiency
- 33% ▼ -7.00%
- Reading proficiency
- 38% ▲ 2.00%
- Median HH income
- $31,834
- Composite
- 29.01/100
- National rank
- #6613
- State rank
- #562 of 590 in NY
Livability — Utica
- Score
- 80/100
- State rank
- #104
- US rank
- #1589
Category grades
Schools grade is shown separately in the Schools card above.
Census & demographics
- Census place
- Utica, NY
- County
- Oneida County · 89,710 people
- City population
- 72,968
- Metro
- Utica-Rome, NY
- Population (ZIP)
- 38,931
- Household income
- $52,548
- Rent vs Own
- Severe rent burden
- 2251.0
Population outlook (Oneida County) Hauer SSP2
- Today (2025)
- 225,223 people
- By 2030
- 220,384 · -2.1%
- By 2040
- 209,071 · -7.2%
- By 2050
- 197,920 · -12.1%
- By 2075
- 175,541 · -22.1%
- By 2100
- 148,491 · -34.1%
Race, ethnicity, and origin ACS 2023
- Neighborhood character
- Highly diverse neighborhood (Simpson 0.70)
- Race & ethnicity
- White 49% Two or more races 15% Hispanic / Latino 14% Black 14% Asian 14%
- Hispanic origin (detail)
- Puerto Rican 8% Dominican 4%
- Common ancestry
- American 8% Romanian 3% Lithuanian 1%
- Foreign-born
- 25% · Canada, Philippines, Vietnam
- Languages at home
- 62% English-only · Other Asian/Pacific 11% Russian/Polish/Slavic 10% Spanish 9%
Political lean MEDSL · Oneida
- 2024 margin
- Strong R (+21.3) · D 39.4% · R 60.6%
- 2008→2024 swing
- -15.2pp toward R · 2008: -6.1pp · 2024: -21.3pp
- All cycles
- 2024: R+21.3 2020: R+15.5 2016: R+21.1 2012: R+5.3 2008: R+6.1
Not yet ingested
- Civics
- —
Market trends
- HPI YoY
- ▲ 20.28%
- Current HPI
- 382.3726
- Rent YoY
- —
- Metro
- Utica-Rome, NY
- State GDP YoY
- ▲ 2.60%
- F500 in state
- 92
Industry mix (Fortune 500 HQ in NY)
| Industry | F500 HQs | Revenue |
|---|---|---|
| Financial Services | 10 | $950B |
|
||
| Consumer Goods | 9 | $162B |
|
||
| Insurance | 4 | $225B |
|
||
| Telecommunications | 2 | $144B |
|
||
| Pharmaceuticals | 2 | $112B |
|
||
| Media / Entertainment | 2 | $69B |
|
||
Price history
+335.3% since first listed2 events — show timeline
- 2026-05-23 Listed $299,900 CNYIS
- 2005-12-15 Sold (Public Records) $68,900 Public Records
Property tax history
+2.7%/yrLatest (2025): $1,367 · +10.8% YoY. Source: county tax records.
Cash-flow waterfall
monthlySold comps — $/sqft
last 12 mo · ≤1 miLoading sold comps…