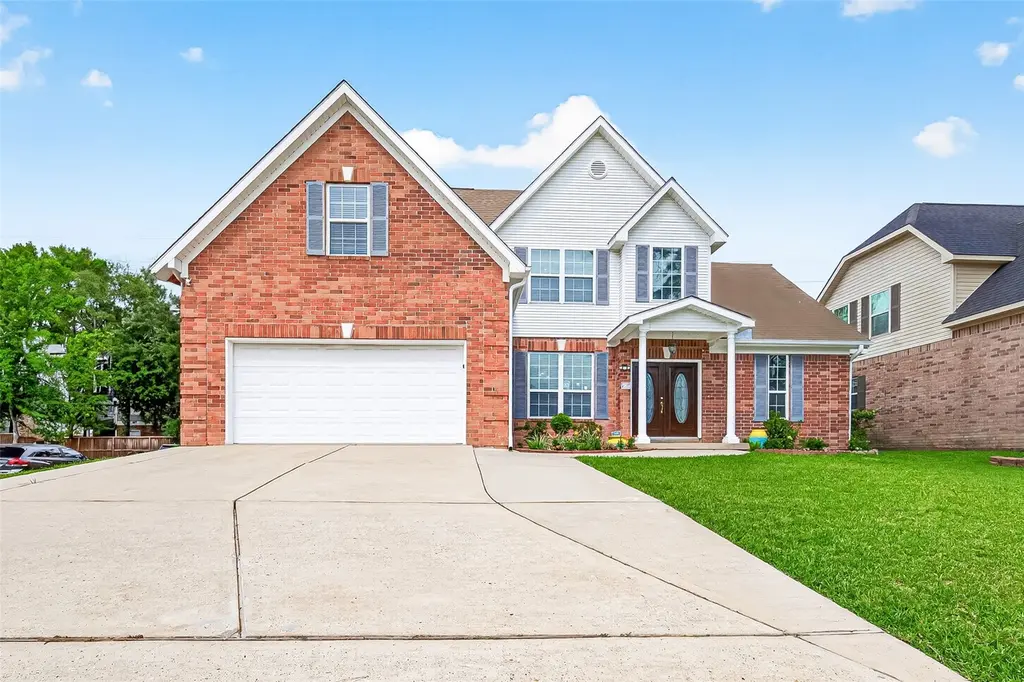
16118 Craigshire Ct · Houston, TX
Flood risk 5/10 · Moderate
- FEMA flood zone
- AE
- Chance of flooding over 30 yrs
- 0.24%
- Est. flood insurance / yr
- $1,737 – $8,500
Fire risk 1/10 · Minimal
- Est. fire insurance / yr
- $1,222 – $2,270
Heat risk 9/10 · Severe
- Hot days now (above 111°F)
- 7 days/yr
- Hot days in 30 yrs
- 24 days/yr
Wind risk 8/10 · Major
- Chance of severe wind over 30 yrs
- 99.0%
Air-quality risk 3/10 · Minor
- Unhealthy air days now
- 3 days/yr
- Unhealthy air days in 30 yrs
- 3 days/yr
Risk factors via First Street. Map © Google.
Why this score? — see what drove the B grade
The composite is a weighted blend of 9 inputs, each scored 0–100. Each bar is that input's sub-score; the figure is the points it added to the 100-point composite (weight × sub-score).
- Cash flow +30.0/30.0
- ARV discount +12.4/15.0
- DSCR +10.0/10.0
- 1% rule +9.1/10.0
- Schools +4.1/10.0
- Livability +3.7/5.0
- Condition / age +2.5/5.0
- Rent growth +2.0/5.0
- Appreciation +0.0/10.0
$379,000
🖨 Deal sheet 📄 Offer letter ✓ Due diligence
Listing remarks
1. A HUGE BACKYARD COVERED PATIO ADDED, 2. EXTENDED DRIVEWAY WITH MORE PARKING SPACE, 3. POTENTIAL OF 5TH ROOM ON THE UPSTAIR, 4. UPGRADED WOOD FLOORING THROUGHOUT, 5. A NEWLY EPOXY-COATED GARAGE FLOOR, 6. TOP-RATED SCHOOL DISTRICT, 7. UPGRADED KITCHEN WITH APPLIANCES INCLUDED, 8. WALKING DISTANCE TO THE KROGER SHOPPING PLAZA. Welcome to this beautifully maintained 2-story home featuring 4 bedrooms, 2 full baths, and 2 half baths, ideally situated with no left-side neighbor for added privacy. A perfect blend of comfort, functionality, and location — this home is a must-see!
Key facts
- 8,250 sq ft lot
- 2 garage spots
- Built 2005
Tags
Property features AI
Finance
- HOA & community: Association: PMG HOUSTON; Annual association fee of $300
Exterior
- Parking: Attached 2-car garage
- Utilities: Public water; Public sewer
- Home design: Residential property; Built in 2005; Slab foundation
- Construction: Brick construction; Composition roof
- Exterior features: Located on a cul-de-sac
Interior
- Kitchen: Kitchen (10 x 10); Breakfast room/nook (12 x 10); Separate dining room (12 x 11)
- Bedrooms: Primary bedroom on the first floor (15 x 13); Bedroom on the second floor (13 x 11); Bedroom on the third floor (12 x 11); Bedroom on the fourth floor (12 x 11)
- Bathrooms: 2 full bathrooms; 2 half bathrooms
- Heating & cooling: Central heating (electric and gas); Central air conditioning (electric)
- Interior features: One fireplace; Total of 8 rooms
Neighborhood map
What this means for you Summary
Snapshot
- This is a 4-bed/2.5-bath single-family listed at $379k.
Deal economics
- At list price, monthly cash flow is $1k ($12k/yr) — positive.
- The deal already cash-flows at list — no discount required.
- Meets the 1% rule at list price ($5k rent vs $379k).
- Recommended offer: $368k (3.0% below list) — sets the bar for market timing.
- Cap rate 10.8% vs local median 3.2% in Houston — top-decile yield for the area; either an underpriced asset or a hidden risk that comps aren't pricing in. Stress-test before assuming the spread holds.
Location & tenants
- Location reads 74/100 on livability (#184 in TX, #4,771 nationally) — a middle-class / working-renter tenant base. Strengths: amenities A+, cost of living A+, housing A+; Watch: crime F.
- Klein ISD (suburban): math 41% / reading 48% proficiency, ranked #213 of 826 in TX (top 26%) — families likely to look elsewhere, expect single-tenant / working-renter base with shorter leases.
- Zoned schools: Klein H S (math 58% / reading 67%, grade B-, #234 of 1,632 statewide, top 14%, 3,352 students, 45% FRL).
- Zoned-school proficiency averages 62% at this address vs 44% district-wide (+18 pts) — the actual schools serving this property are materially stronger than the Klein ISD average implies; a family-tenant draw the district grade alone would hide.
- Market conditions: Rents soft (-1.9%/yr); 622 active listings in the ZIP; 3 comparable units currently listed for rent nearby; rentals lingering (median 44d on market — plan ~5-8 weeks vacancy on turnover, expect pricing pressure); 67% of comp listings sitting > 30 days — soft ceiling on asking rent; solid renter incomes; 29,883 units permitted in Harris County in 2024 (8,621 in 5+ unit buildings).
- At $5,339/mo this rent would consume 60% of the median local household income ($107k/yr) (locally 2220% of renters already pay >50% of income on rent) — very limited rent-growth headroom before tenants either downsize or default.
Forward outlook
- Local home prices are declining (-3.0%/yr); year-one equity from $3k of loan paydown is wiped out by about $11k of value loss. Plan a longer hold.
- Harris County population projected at +47% by 2050 — long-run rental-demand tailwind backs the buy-and-hold thesis.
Negotiation context
- It's been on market 40 days — a 3% lower offer ($368k) is reasonable based on typical stale-listing flexibility.
Risks & watch-outs
- Watch-outs: flood insurance adds $427/mo.
- Climate carrying-cost: in FEMA flood zone AE (mandatory federal flood insurance); severe wind risk, 99% chance of damaging wind over 30y; extreme-heat days projected 7→24/yr by 2055 (HVAC capex compounding) — expect insurance premiums to compound above CPI over the hold.
Questions for the listing agent
- It's been on market 40 days. Have you received any prior offers? Is the seller open to a 3% concession, seller financing, or rate buy-down credit?
- What's the actual annual flood-insurance premium (NFIP or private), and is the property in a SFHA with mandatory coverage?
- What does the HOA fee cover, when was the last increase, and are there any pending special assessments or reserve-fund shortfalls?
- Is there a deadline driving the sale (1031 exchange, divorce, estate, relocation)? That informs how much negotiation room exists.
- Schools are D-rated, which usually means shorter tenancies and higher turnover. Who's the typical renter profile here, and what's been the actual vacancy rate?
- Crime grade is F in this area — have there been break-ins, vandalism, or insurance claims at this property in the last 3 years? What carrier currently insures it and at what premium?
- What's the average days-on-market for RENTAL listings here right now (not sales)? A rising rental-DOM trend means longer vacancies and softer asking-rent achievability than the comps imply.
- What's the recent tenant-quality profile in this submarket — average credit score on applications, eviction rate, late-payment / NSF rate, and stable-employment percentage? A property-management company in the area should have these aggregated.
- How much new for-sale + rental construction is in the pipeline within 1–3 miles? Heavy new supply typically softens prices + rents 12–24 months out; constrained supply supports both.
Investment metrics
- 1% rule
- 1.41% ✓
- Cap rate
- 10.81%
- Cash-on-cash
- 16.15%
- DSCR
- 1.72
- GRM
- 5.9
CMA / ARV
- ARV (median comp)
- $425,011
- List price
- $379,000
- Delta
- -10.83%
- Verdict
- UNDERPRICED
- Comps
- 20 within 1.0 mi
Show comp detail 12 sales within ~0.75 mi
| Address | Dist | Beds/Ba | Sqft | Sold | Price | $/sf | Match |
|---|---|---|---|---|---|---|---|
| 13 Stonegate Park Ct | 0.34mi | 3/2.5 (-1) | 3,068 (-2%) | 2mo | $430,000 | $140 | 74 |
| 16406 Farnell Ct | 0.32mi | 4/3.5 | 3,259 (+4%) | 3mo | $510,000 | $156 | 72 |
| 8215 Turnmill Ct | 0.27mi | 4/3.5 | 2,986 (-5%) | 4mo | $400,000 | $134 | 72 |
| 16115 Abberton Hill Dr | 0.43mi | 4/2.5 | 2,931 (-6%) | 2mo | $419,878 | $143 | 67 |
| 24 Villa Bend Dr | 0.64mi | 3/3.5 (-1) | 3,210 (+2%) | 2mo | $525,000 | $164 | 56 |
| 8007 Sunset Falls Ct | 0.50mi | 3/2.5 (-1) | 3,496 (+12%) | 1mo | $675,000 | $193 | 51 |
| 5306 Norborne Ln | 0.54mi | 4/3.0 | 3,498 (+12%) | 2mo | $472,000 | $135 | 51 |
| 16119 Maplehurst Dr | 0.71mi | 5/3.5 (+1) | 3,320 (+6%) | 1mo | $479,000 | $144 | 47 |
| 16022 Winchmore Hill Dr | 0.43mi | 4/4.0 | 3,576 (+14%) | 4mo | $475,000 | $133 | 47 |
| 8719 Chelmsford Ln | 0.55mi | 4/3.5 | 3,579 (+14%) | 4mo | $600,000 | $168 | 43 |
| 7 Champion Villa Dr | 0.75mi | 3/3.0 (-1) | 2,818 (-10%) | 3mo | $439,900 | $156 | 38 |
| 16230 Heden Rd | 0.64mi | 5/3.5 (+1) | 3,541 (+13%) | 3mo | $549,000 | $155 | 38 |
Match score weights: distance 35% · size 25% · config 20% · recency 20%. Top-matched comps best support the ARV.
Projected returns pro-forma
-3.0% appreciation · 0.0% rent growth · sell at horizon
- IRR
- -3.3%
- Equity multiple
- 0.88×
- Total profit
- $-12,837
- Equity at exit
- $56,510
- IRR
- 1.9%
- Equity multiple
- 1.12×
- Total profit
- $12,294
- Equity at exit
- $32,769
Cash invested: $106,120 (down + closing). Projections, not guarantees.
Landlord ↔ Tenant lean methodology
- Overall (STATE)
- 87 Strongly Landlord-Friendly
- State Texas
- 87 Strongly Landlord-Friendly · R+5
- County
- — inherits STATE
- City
- — inherits STATE
ZIP-level market 77379
- Home prices YoY
- -34.7%
- Rents YoY
- -1.9%
- Active inventory
- 622
- Price-to-rent
- 5.9×
Monthly cashflow live
- Estimated rent
- $5,339 medium interval (Pro) →
- Mortgage (P&I)
- −$1,988
- Tax from tax record
- −$620 /mo · $7,436/yr
- Insurance
- −$158
- Flood insurance flood zone
- −$427 /mo · $5,118/yr
- HOA
- −$25
- Vacancy / Maint / Mgmt
- −$1,121
- Net cashflow
- $1,001
Break-even live
UW: 25.0% down · 7.5% · 30yr · 1.5% tax · 5.0% vac · 8.0% maint · 8.0% mgmt
Financing live
Cash to close
- Down payment
- $94,750
- Closing costs
- $11,370
- Reserves months
- —
- Total cash needed
- —
Loan-product check · same deal, 3 products live
Conventional
25% down · 7.5% · 30yr
- Down + closing
- —
- Monthly P&I
- —
- Monthly cashflow
- —
- DSCR
- —
- Eligible?
- —
Personal DTI + credit; lowest rate.
DSCR
20% down · 8.5% · 30yr
- Down + closing
- —
- Monthly P&I
- —
- Monthly cashflow
- —
- DSCR
- —
- Eligible?
- —
No personal income docs; deal must DSCR.
Hard money
10% down · 12.0% · 12mo
- Down + closing
- —
- Monthly P&I
- —
- Monthly cashflow
- —
- DSCR
- —
- Eligible?
- —
Short-term bridge; refi at stabilization.
Rent comps 3 comps
| Address | Beds | Baths | Sqft | Rent | $/sqft | DOM | Units | Dist |
|---|---|---|---|---|---|---|---|---|
| 16623 Manningtree Ln Spring, TX | 3.0 | 3.0 | 2572 | $2,800 | $1.09 | 43d | 1 | 0.47mi |
| 5135 Westerham Pl Unit 1262307P Houston, TX | 5.0 | 3.5 | 3358 | $17,582 | $5.24 | 22d | 1 | 1.04mi |
| 4807 Wellington Way Houston, TX | 3.0 | 2.5 | 2876 | $2,500 | $0.87 | 43d | 1 | 1.27mi |
HOA detail
- Monthly dues
- $25 · $300/yr
Listing history 16 events
-
2026-06-18days on market $379,000 Active 40 DOM
-
2026-06-17days on market $379,000 Active 39 DOM
-
2026-06-16days on market $379,000 Active 38 DOM
-
2026-06-15days on market $379,000 Active 37 DOM
-
2026-06-13days on market $379,000 Active 35 DOM
-
2026-06-09days on market $379,000 Active 31 DOM
-
2026-06-08days on market $379,000 Active 30 DOM
-
2026-06-07days on market $379,000 Active 29 DOM
-
2026-06-04days on market $379,000 Active 26 DOM
-
2026-06-03days on market $379,000 Active 25 DOM
-
2026-06-02days on market $379,000 Active 24 DOM
-
2026-06-01days on market $379,000 Active 23 DOM
-
2026-05-31days on market $379,000 Active 22 DOM
-
2026-05-09$388,000 Active 587-char remark
-
2007-03-06soldstatus
-
1994-03-24soldstatus
ⓘ Source: listings_history table (triggers on properties + properties_extension) + one-shot
backfill from property_details.listing_events for pre-trigger history.
Tax reassessment forecast TX · Resets to sale price
- Current annual tax
- $7,436 · $620/mo
- Projected year-2 tax
- $7,436 · $620/mo
- Expected delta
- $0/yr ($0/mo · 0.0%)
ⓘ Screening estimate from a state-policy table — verify with the county assessor before closing.
Climate risk First Street
- Flood 5/10 Major FEMA zone AE · 24% chance over 30 yrs
- Wildfire 1/10 Low
- Heat 9/10 Extreme 7 d/yr ≥111°F today · 24 d/yr by 30 yrs out
- Wind 8/10 Severe 99% chance of damaging wind over 30 yrs
- Air quality 3/10 Moderate 3 unhealthy d/yr today · 3 by 30 yrs out
Nearby sold comps map
Loading sold comps map…
Walkable amenities ~0.75 mi
Loading nearby amenities…
Taxation est. · year 1
- Rental income
- $64,071
- − Mortgage interest
- −$21,230
- − Property taxes
- −$7,436
- − Insurance
- −$7,014
- − Repairs & maintenance
- −$5,126
- − Management
- −$5,126
- − HOA
- −$300
- − Depreciation
- −$11,025
- Taxable income
- $6,815
- Est. tax owed @ 24.0%
- −$1,636
- After-tax cash flow
- $10,381/yr
For passive investors: Depreciation is non-cash, so a rental often shows a tax loss while cash-flowing — sheltering income. Rental losses are passive: they offset passive income freely, and up to $25,000/yr can offset ordinary (W-2) income if you actively participate and your MAGI is under $100k (phasing out to $0 by $150k); unused losses carry forward. On sale, claimed depreciation is recaptured at up to 25%, and gains may owe capital-gains tax (a 1031 exchange can defer both). Figures are a year-1 estimate at your 24.0% rate — not tax advice; consult a CPA.
Schools (NCES district)
- District
- Klein ISD
- NCES district ID
- 4825740
- Math proficiency
- 41% ▼ -12.00%
- Reading proficiency
- 48% ▼ -3.00%
- Median HH income
- $78,288
- Composite
- 40.91/100
- National rank
- #3615
- State rank
- #213 of 826 in TX
Livability — Houston
- Score
- 74/100
- State rank
- #184
- US rank
- #4771
Category grades
Schools grade is shown separately in the Schools card above.
Census & demographics
- County
- Harris County · 4,702,590 people
- City population
- 3,226,434
- Metro
- Houston-The Woodlands-Sugar Land, TX
- Population (ZIP)
- 85,190
- Household income
- $107,486
- Rent vs Own
- Severe rent burden
- 2220.0
Population outlook (Harris County) Hauer SSP2
- Today (2025)
- 5,571,493 people
- By 2030
- 6,089,821 · +9.3%
- By 2040
- 7,142,806 · +28.2%
- By 2050
- 8,185,864 · +46.9%
- By 2075
- 10,574,329 · +89.8%
- By 2100
- 12,109,958 · +117.4%
Race, ethnicity, and origin ACS 2023
- Neighborhood character
- Diverse neighborhood (Simpson 0.68)
- Race & ethnicity
- White 49% Hispanic / Latino 24% Two or more races 15% Black 11% Asian 11%
- Hispanic origin (detail)
- Mexican 13% Puerto Rican 1% Cuban 1%
- Common ancestry
- Italian 2% Lithuanian 2% Slovak 2%
- Foreign-born
- 19% · Canada, Vietnam, China
- Languages at home
- 71% English-only · Spanish 16% Other Indo-European 5% Other Asian/Pacific 1%
Political lean MEDSL · Harris
- 2024 margin
- Lean D (+5.5) · D 52.0% · R 46.4% · Other 1.6%
- 2008→2024 swing
- +3.9pp toward D · 2008: 1.6pp · 2024: 5.5pp
- All cycles
- 2024: D+5.5 2020: D+13.3 2016: D+12.4 2012: D+0.1 2008: D+1.6
Not yet ingested
- Civics
- —
Market trends
- HPI YoY
- ▼ -116.58%
- Current HPI
- 218.9608
- Rent YoY
- ▼ -1.95%
- Metro
- Houston-The Woodlands-Sugar Land, TX
- State GDP YoY
- ▲ 3.95%
- F500 in state
- 110
Industry mix (Fortune 500 HQ in TX)
| Industry | F500 HQs | Revenue |
|---|---|---|
| Energy | 16 | $1,198B |
|
||
| Technology | 5 | $198B |
|
||
| Engineering / Construction | 4 | $72B |
|
||
| Energy Services | 3 | $60B |
|
||
| Utilities | 3 | $41B |
|
||
| Healthcare | 2 | $330B |
|
||
Price history
-2.3% since first listed4 events — show timeline
- 2026-05-23 Price Changed $379,000 HARMLS
- 2026-05-09 Listed $388,000 HARMLS
- 2007-03-06 Sold (Public Records) — Public Records
- 1994-03-24 Sold (Public Records) — Public Records
Property tax history
+2.9%/yrLatest (2025): $7,436 · +10.9% YoY. Source: county tax records.
Cash-flow waterfall
monthlySold comps — $/sqft
last 12 mo · ≤1 miLoading sold comps…