901 Village Dr · Newport, AR
Flood risk 4/10 · Minor
- FEMA flood zone
- AE
- Chance of flooding over 30 yrs
- 0.22%
- Est. flood insurance / yr
- $1,737 – $8,500
Fire risk 1/10 · Minimal
- Est. fire insurance / yr
- $1,499 – $2,785
Heat risk 6/10 · Moderate
- Hot days now (above 109°F)
- 7 days/yr
- Hot days in 30 yrs
- 20 days/yr
Wind risk 3/10 · Minor
- Chance of severe wind over 30 yrs
- 7.0%
Air-quality risk 1/10 · Minimal
- Unhealthy air days now
- 0 days/yr
- Unhealthy air days in 30 yrs
- 0 days/yr
Risk factors via First Street. Map © Google.
Why this score? — see what drove the B+ grade
The composite is a weighted blend of 9 inputs, each scored 0–100. Each bar is that input's sub-score; the figure is the points it added to the 100-point composite (weight × sub-score).
- Cash flow +30.0/30.0
- 1% rule +10.0/10.0
- DSCR +10.0/10.0
- Appreciation +10.0/10.0
- ARV discount +7.5/15.0
- Livability +3.2/5.0
- Rent growth +2.5/5.0
- Condition / age +2.5/5.0
- Schools +2.0/10.0
$22,000
🖨 Deal sheet 📄 Offer letter ✓ Due diligence
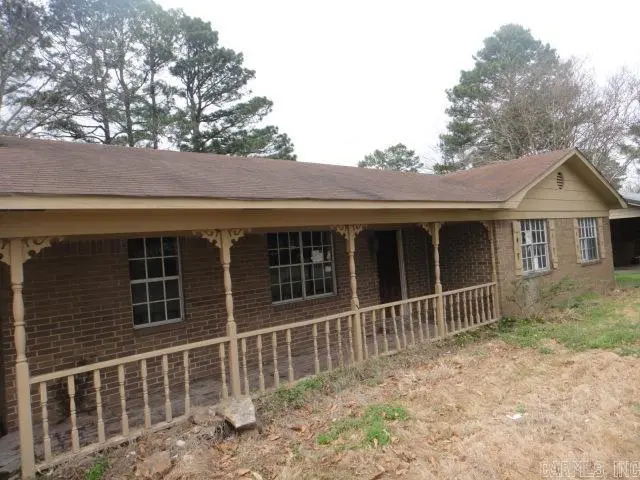
Listing remarks
This home has lots of space, large Living Rm with FP. Storage building. Seller does not pay customary closing costs: including title policy, escrow fees, survey or transfer fees. Proof of funds required on cash transactions Lender Pre-Approval letter for financed offers dated within last 30 days). Seller is Secretary of Veterans Affairs. This property may qualify for Seller Financing (Vendee). Property sold As Is. See Agent Remarks for submitting an offer. "Due to condition, the property may have health/safety risk(s). Prior to entry / access, all parties must sign a Hold Harmless Agreement and the property may only be shown by appointment"
Key facts
- Large living rm
- Storage building
- Detached
Tags
Neighborhood map
What this means for you Summary
Snapshot
- This is a 3-bed/1.5-bath single-family listed at $22k.
Deal economics
- At list price, monthly cash flow is $93 ($1k/yr) — positive.
- The deal already cash-flows at list — no discount required.
- Meets the 1% rule at list price ($850 rent vs $22k).
- Cap rate 34.6% vs local median 5.0% in Newport — top-decile yield for the area; either an underpriced asset or a hidden risk that comps aren't pricing in. Stress-test before assuming the spread holds.
Location & tenants
- Location reads 64/100 on livability (#167 in AR) — a middle-class / working-renter tenant base. Strengths: cost of living A+, housing A, health & safety A; Watch: crime D, schools F, amenities F.
- Newport School District (town): math 23% / reading 26% proficiency, ranked #194 of 238 in AR (top 82%) — low school quality limits family demand, transient renter base, plan for 1-2y turnover; 68% free/reduced lunch — lower-income household profile, screen leases tightly.
- Market conditions: 39 active listings in the ZIP; 1 comparable units currently listed for rent nearby; 13 units permitted in Jackson County in 2024 (10 in 5+ unit buildings).
Forward outlook
- In year one you build about $2k of equity ($152 loan paydown + $2k appreciation (10.0% local appreciation)).
- Jackson County population projected at -12% by 2050 — secular population decline; favor cash flow + early exit over multi-decade hold.
- At projected returns (10.0% appreciation + 3.0% rent growth), your $6k cash investment doubles in ~2 years — after that, you're playing with house money.
Negotiation context
- Only 11 days on market — expect competitive offers; lowballing is unlikely to land.
Risks & watch-outs
- Watch-outs: flood insurance adds $427/mo.
- Climate carrying-cost: in FEMA flood zone AE (mandatory federal flood insurance); extreme-heat days projected 7→20/yr by 2055 (HVAC capex compounding) — expect insurance premiums to compound above CPI over the hold.
Questions for the listing agent
- Built in 1976 — when were the roof, HVAC, electrical panel, plumbing, and water heater last replaced?
- What's the actual annual flood-insurance premium (NFIP or private), and is the property in a SFHA with mandatory coverage?
- Is there a deadline driving the sale (1031 exchange, divorce, estate, relocation)? That informs how much negotiation room exists.
- Schools are F-rated, which usually means shorter tenancies and higher turnover. Who's the typical renter profile here, and what's been the actual vacancy rate?
- Crime grade is D in this area — have there been break-ins, vandalism, or insurance claims at this property in the last 3 years? What carrier currently insures it and at what premium?
- What's the average days-on-market for RENTAL listings here right now (not sales)? A rising rental-DOM trend means longer vacancies and softer asking-rent achievability than the comps imply.
- What's the recent tenant-quality profile in this submarket — average credit score on applications, eviction rate, late-payment / NSF rate, and stable-employment percentage? A property-management company in the area should have these aggregated.
- How much new for-sale + rental construction is in the pipeline within 1–3 miles? Heavy new supply typically softens prices + rents 12–24 months out; constrained supply supports both.
Investment metrics
- 1% rule
- 3.86% ✓
- Cap rate
- 34.63%
- Cash-on-cash
- 101.19%
- DSCR
- 5.50
- GRM
- 2.2
CMA / ARV
- ARV (on-the-fly)
- $86,640
- Comps found
- 5
Show comp detail 5 sales within ~0.75 mi
| Address | Dist | Beds/Ba | Sqft | Sold | Price | $/sf | Match |
|---|---|---|---|---|---|---|---|
| 805 Cherokee Dr | 0.37mi | 3/1.5 | 1,610 (+12%) | 10mo | $121,000 | $75 | 56 |
| 1011 Highland Dr | 0.30mi | 3/2.0 | 1,630 (+13%) | 14mo | $110,000 | $67 | 51 |
| 1408 Holden Ave | 0.66mi | 3/1.0 | 1,306 (-10%) | 13mo | $72,500 | $56 | 40 |
| 1109 Josephine St | 0.71mi | 3/2.0 | 1,560 (+8%) | 15mo | $93,000 | $60 | 39 |
| 417 James St | 0.55mi | 3/1.0 | 1,259 (-13%) | 24mo | $17,500 | $14 | 31 |
Match score weights: distance 35% · size 25% · config 20% · recency 20%. Top-matched comps best support the ARV.
Projected returns pro-forma
10.0% appreciation · 3.0% rent growth · sell at horizon
- IRR
- 38.2%
- Equity multiple
- 3.95×
- Total profit
- $18,175
- Equity at exit
- $19,819
- IRR
- 33.2%
- Equity multiple
- 9.02×
- Total profit
- $49,415
- Equity at exit
- $42,741
Cash invested: $6,160 (down + closing). Projections, not guarantees.
Landlord ↔ Tenant lean methodology
- Overall (STATE)
- 92 Strongly Landlord-Friendly
- State Arkansas
- 92 Strongly Landlord-Friendly · R+14
- County
- — inherits STATE
- City
- — inherits STATE
ZIP-level market 72112
- Home prices YoY
- 15.6%
- Active inventory
- 39
- Price-to-rent
- 2.2×
Monthly cashflow live
- Estimated rent
- $850 medium interval (Pro) →
- Mortgage (P&I)
- −$115
- Tax est. 1.5%
- −$28 /mo · $330/yr
- Insurance
- −$9
- Flood insurance flood zone
- −$427 /mo · $5,118/yr
- HOA
- −$0
- Vacancy / Maint / Mgmt
- −$178
- Net cashflow
- $93
Break-even live
UW: 25.0% down · 7.5% · 30yr · 1.5% tax · 5.0% vac · 8.0% maint · 8.0% mgmt
Financing live
Cash to close
- Down payment
- $5,500
- Closing costs
- $660
- Reserves months
- —
- Total cash needed
- —
Loan-product check · same deal, 3 products live
Conventional
25% down · 7.5% · 30yr
- Down + closing
- —
- Monthly P&I
- —
- Monthly cashflow
- —
- DSCR
- —
- Eligible?
- —
Personal DTI + credit; lowest rate.
DSCR
20% down · 8.5% · 30yr
- Down + closing
- —
- Monthly P&I
- —
- Monthly cashflow
- —
- DSCR
- —
- Eligible?
- —
No personal income docs; deal must DSCR.
Hard money
10% down · 12.0% · 12mo
- Down + closing
- —
- Monthly P&I
- —
- Monthly cashflow
- —
- DSCR
- —
- Eligible?
- —
Short-term bridge; refi at stabilization.
Rent comps 1 comps
| Address | Beds | Baths | Sqft | Rent | $/sqft | DOM | Units | Dist |
|---|---|---|---|---|---|---|---|---|
| 701 McLain St Apt B Newport, AR | 2.0 | 1.0 | 1000 | $850 | $0.85 | 43d | 1 | 1.04mi |
Listing history 3 events
-
2026-04-25status Under Contract
-
2026-04-11$22,000 New Listing
-
1988-06-01soldstatus $53,000
ⓘ Source: listings_history table (triggers on properties + properties_extension) + one-shot
backfill from property_details.listing_events for pre-trigger history.
Climate risk First Street
- Flood 4/10 Moderate FEMA zone AE · 22% chance over 30 yrs
- Wildfire 1/10 Low
- Heat 6/10 Major 7 d/yr ≥109°F today · 20 d/yr by 30 yrs out
- Wind 3/10 Moderate 7% chance of damaging wind over 30 yrs
- Air quality 1/10 Low 0 unhealthy d/yr today · 0 by 30 yrs out
Nearby sold comps map
Loading sold comps map…
Walkable amenities ~0.75 mi
Loading nearby amenities…
Taxation est. · year 1
- Rental income
- $10,200
- − Mortgage interest
- −$1,232
- − Property taxes
- −$330
- − Insurance
- −$5,228
- − Repairs & maintenance
- −$816
- − Management
- −$816
- − Depreciation
- −$640
- Taxable income
- $1,137
- Est. tax owed @ 24.0%
- −$273
- After-tax cash flow
- $842/yr
For passive investors: Depreciation is non-cash, so a rental often shows a tax loss while cash-flowing — sheltering income. Rental losses are passive: they offset passive income freely, and up to $25,000/yr can offset ordinary (W-2) income if you actively participate and your MAGI is under $100k (phasing out to $0 by $150k); unused losses carry forward. On sale, claimed depreciation is recaptured at up to 25%, and gains may owe capital-gains tax (a 1031 exchange can defer both). Figures are a year-1 estimate at your 24.0% rate — not tax advice; consult a CPA.
Schools (NCES district)
- District
- Newport School District
- NCES district ID
- 0500023
- Math proficiency
- 23% ▼ -11.00%
- Reading proficiency
- 26% ▼ -8.00%
- Median HH income
- $29,425
- Composite
- 19.67/100
- National rank
- #8734
- State rank
- #194 of 238 in AR
Livability — Newport
- Score
- 64/100
- State rank
- #167
- US rank
- #14064
Category grades
Schools grade is shown separately in the Schools card above.
Census & demographics
- Census place
- Newport, AR
- Population (ZIP)
- 11,092
Population outlook (Jackson County) Hauer SSP2
- Today (2025)
- 16,368 people
- By 2030
- 15,875 · -3.0%
- By 2040
- 14,998 · -8.4%
- By 2050
- 14,363 · -12.2%
- By 2075
- 13,207 · -19.3%
- By 2100
- 11,276 · -31.1%
Race, ethnicity, and origin ACS 2023
- Neighborhood character
- Predominantly White (66%)
- Race & ethnicity
- White 66% Black 22% Two or more races 9% Hispanic / Latino 4%
- Common ancestry
- Slovak 1% Lithuanian 1% Iranian 1%
- Foreign-born
- 1% · Canada
- Languages at home
- 98% English-only · Other Indo-European 1% Spanish 1%
Political lean MEDSL · Jackson
- 2024 margin
- Solid R (+48.7) · D 24.8% · R 73.5% · Other 1.7%
- 2008→2024 swing
- -32.4pp toward R · 2008: -16.3pp · 2024: -48.7pp
- All cycles
- 2024: R+48.7 2020: R+43.8 2016: R+33.0 2012: R+18.2 2008: R+16.3
Not yet ingested
- Civics
- —
Market trends
- HPI YoY
- ▲ 27.46%
- Current HPI
- 203.03
- Rent YoY
- —
- Metro
- —
- State GDP YoY
- ▲ 3.80%
- F500 in state
- 10
Industry mix (Fortune 500 HQ in AR)
| Industry | F500 HQs | Revenue |
|---|---|---|
| Retail | 1 | $681B |
|
||
| Food / Agriculture | 1 | $53B |
|
||
| Retail / Energy | 1 | $22B |
|
||
| Transportation / Logistics | 1 | $12B |
|
||
| Energy | 1 | $4B |
|
||
Price history
-58.5% since first listed3 events — show timeline
- 2026-04-25 Pending — CARMLS
- 2026-04-11 Listed $22,000 CARMLS
- 1988-06-01 Sold (Public Records) $53,000 Public Records
Property tax history
-19.0%/yrLatest (2025): $24 · +0.0% YoY. Source: county tax records.
Cash-flow waterfall
monthlySold comps — $/sqft
last 12 mo · ≤1 miLoading sold comps…