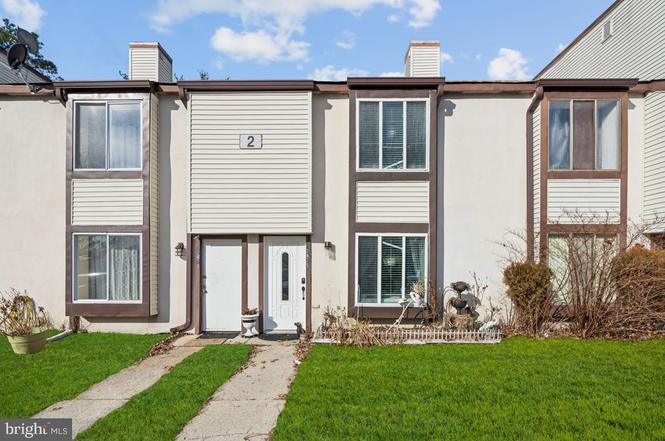
2425 Arbor Ct · McKee City, NJ
Flood risk 1/10 · Minimal
- FEMA flood zone
- X (unshaded)
- Chance of flooding over 30 yrs
- 0.0%
- Est. flood insurance / yr
- $507 – $1,088
Fire risk 4/10 · Minor
- Est. fire insurance / yr
- $526 – $976
Heat risk 7/10 · Major
- Hot days now (above 101°F)
- 7 days/yr
- Hot days in 30 yrs
- 15 days/yr
Wind risk 8/10 · Major
- Chance of severe wind over 30 yrs
- 80.0%
Air-quality risk 3/10 · Minor
- Unhealthy air days now
- 1 days/yr
- Unhealthy air days in 30 yrs
- 4 days/yr
Risk factors via First Street. Map © Google.
Why this score? — see what drove the D+ grade
The composite is a weighted blend of 9 inputs, each scored 0–100. Each bar is that input's sub-score; the figure is the points it added to the 100-point composite (weight × sub-score).
- Cash flow +17.6/30.0
- Appreciation +10.0/10.0
- 1% rule +6.2/10.0
- DSCR +5.5/10.0
- Rent growth +2.5/5.0
- Livability +2.5/5.0
- Condition / age +2.5/5.0
- Schools +2.1/10.0
- ARV discount +1.1/15.0
$200,000
🖨 Deal sheet 📄 Offer letter ✓ Due diligence
Listing remarks
Welcome to this move-in ready 2-bedroom, 1.5-bath townhome located in the desirable Woodlands community. Thoughtfully updated, this home offers a kitchen redone 2 years ago with updated appliances, newer windows, an updated water heater, and a convenient in-unit washer and dryer. The main level features a dedicated dining area with sliding glass doors that open to a private patio—perfect for relaxing or entertaining. Just off the kitchen, you’ll find a powder room, laundry area, and utility space for added convenience. Upstairs are two comfortable bedrooms, including one with a spacious double closet, along with a full hall bathroom. Residents enjoy access to the community&rsquo
Key facts
- Updated appliances
- Newer windows
- Updated water heater
Tags
Neighborhood map
What this means for you Summary
Snapshot
- This is a 2-bed/1.5-bath townhouse listed at $200k.
Deal economics
- At list price, monthly cash flow is $157 ($2k/yr) — positive.
- The deal already cash-flows at list — no discount required.
- Meets the 1% rule at list price ($2k rent vs $200k).
- Recommended offer: $182k (9.0% below list) — sets the bar for market timing.
- Cap rate 7.2% vs local median 5.0% in McKee City — top-decile yield for the area; either an underpriced asset or a hidden risk that comps aren't pricing in. Stress-test before assuming the spread holds.
Location & tenants
- Location reads: area grade D — affects rentability + tenant quality, not the cash-flow math above.
- Hamilton Township School District (suburban): math 9% / reading 37% proficiency, ranked #401 of 472 in NJ (top 85%) — low school quality limits family demand, transient renter base, plan for 1-2y turnover.
- Market conditions: 240 active listings in the ZIP; 8 comparable units currently listed for rent nearby; rentals leasing fast (median 13d on market — plan ~1-2 weeks tenant-placement turnaround); solid renter incomes; 672 units permitted in Atlantic County in 2024 (258 in 5+ unit buildings).
- This rent runs 35% of the median local income ($77k/yr) — at the standard rent-burdened threshold; future hikes will face affordability resistance.
Forward outlook
- In year one you build about $21k of equity ($1k loan paydown + $20k appreciation (10.0% local appreciation)).
- Atlantic County population projected at -12% by 2050 — secular population decline; favor cash flow + early exit over multi-decade hold.
- At projected returns (10.0% appreciation + 3.0% rent growth), your $56k cash investment doubles in ~3 years — after that, you're playing with house money.
- By year 2, paydown + projected appreciation supports a ~$34k cash-out refi (75% LTV) — recoverable capital for the next deal without selling this one.
Negotiation context
- It's been on market 91 days — a 9% lower offer ($182k) is reasonable based on typical stale-listing flexibility.
- 2 sale attempts; this cycle's ask has dropped $15k (7%) from the opening price — seller is motivated, your offer sets the floor, not the list.
Risks & watch-outs
- Climate carrying-cost: severe wind risk, 80% chance of damaging wind over 30y; extreme-heat days projected 7→15/yr by 2055 (HVAC capex compounding) — expect insurance premiums to compound above CPI over the hold.
Questions for the listing agent
- It's been on market 91 days. Have you received any prior offers? Is the seller open to a 9% concession, seller financing, or rate buy-down credit?
- What does the HOA fee cover, when was the last increase, and are there any pending special assessments or reserve-fund shortfalls?
- Why hasn't it sold? Are there any deal-killer items the seller is aware of (foundation, flood, title, zoning, code violations)?
- Is there a deadline driving the sale (1031 exchange, divorce, estate, relocation)? That informs how much negotiation room exists.
- The area grade is low — what's the realistic commute time and amenity access for the typical tenant pool here? Any planned neighborhood developments (good or bad) we should know about?
- What's the average days-on-market for RENTAL listings here right now (not sales)? A rising rental-DOM trend means longer vacancies and softer asking-rent achievability than the comps imply.
- What's the recent tenant-quality profile in this submarket — average credit score on applications, eviction rate, late-payment / NSF rate, and stable-employment percentage? A property-management company in the area should have these aggregated.
- How much new for-sale + rental construction is in the pipeline within 1–3 miles? Heavy new supply typically softens prices + rents 12–24 months out; constrained supply supports both.
Investment metrics
- 1% rule
- 1.12% ✓
- Cap rate
- 7.23%
- Cash-on-cash
- 3.36%
- DSCR
- 1.15
- GRM
- 7.4
CMA / ARV
- ARV (on-the-fly)
- $175,000
- Comps found
- 12
Show comp detail 12 sales within ~0.75 mi
| Address | Dist | Beds/Ba | Sqft | Sold | Price | $/sf | Match |
|---|---|---|---|---|---|---|---|
| 2614 Dogwood Ct #2614 | 0.09mi | 2/1.0 | 956 (-4%) | 2mo | $142,000 | $149 | 85 |
| 3137 Woodlands Dr Dr #3137 | 0.54mi | 2/1.0 | 996 (-0%) | 5mo | $167,500 | $168 | 68 |
| 2409 Arbor Ct #2409 | 0.03mi | 2/1.5 | 1,148 (+15%) | 7mo | $190,000 | $166 | 68 |
| 4416 Yorktown Pl #4416 | 0.49mi | 2/1.0 | 1,010 (+1%) | 9mo | $177,000 | $175 | 66 |
| 3230 Juniper Ct | 0.46mi | 2/1.0 | 996 (-0%) | 12mo | $167,500 | $168 | 66 |
| 3107 Woodlands Ave #5 | 0.42mi | 2/1.0 | 996 (-0%) | 14mo | $162,750 | $163 | 66 |
| 3404 Juniper Ct Ct #3404 | 0.50mi | 2/1.0 | 996 (-0%) | 14mo | $175,900 | $177 | 63 |
| 2851 Forsythia Ct #66 | 0.21mi | 2/1.0 | 896 (-10%) | 13mo | $165,000 | $184 | 60 |
| 4556 Concord Pl #4556 | 0.63mi | 2/1.0 | 1,010 (+1%) | 9mo | $184,000 | $182 | 59 |
| 2707 Mimosa Ct #2707 | 0.21mi | 2/1.0 | 892 (-11%) | 13mo | $130,000 | $146 | 59 |
| 3108 Woodlands Dr #3108 | 0.43mi | 2/1.0 | 908 (-9%) | 8mo | $180,000 | $198 | 56 |
| 3425 Juniper Ct #42 | 0.52mi | 2/2.0 | 929 (-7%) | 13mo | $175,000 | $188 | 51 |
Match score weights: distance 35% · size 25% · config 20% · recency 20%. Top-matched comps best support the ARV.
Projected returns pro-forma
10.0% appreciation · 3.0% rent growth · sell at horizon
- IRR
- 26.7%
- Equity multiple
- 3.13×
- Total profit
- $119,080
- Equity at exit
- $180,176
- IRR
- 23.4%
- Equity multiple
- 7.13×
- Total profit
- $343,174
- Equity at exit
- $388,556
Cash invested: $56,000 (down + closing). Projections, not guarantees.
Landlord ↔ Tenant lean methodology
- Overall (STATE)
- 21 Tenant-Leaning
- State New Jersey
- 21 Tenant-Leaning · D+6
- County
- — inherits STATE
- City
- — inherits STATE
ZIP-level market 08330
- Home prices YoY
- 3.9%
- Active inventory
- 240
- Price-to-rent
- 7.4×
Monthly cashflow live
- Estimated rent
- $2,242 high interval (Pro) →
- Mortgage (P&I)
- −$1,049
- Tax est. 1.5%
- −$250 /mo · $3,000/yr
- Insurance
- −$83
- HOA
- −$232
- Vacancy / Maint / Mgmt
- −$471
- Net cashflow
- $157
Break-even live
UW: 25.0% down · 7.5% · 30yr · 1.5% tax · 5.0% vac · 8.0% maint · 8.0% mgmt
Financing live
Cash to close
- Down payment
- $50,000
- Closing costs
- $6,000
- Reserves months
- —
- Total cash needed
- —
Loan-product check · same deal, 3 products live
Conventional
25% down · 7.5% · 30yr
- Down + closing
- —
- Monthly P&I
- —
- Monthly cashflow
- —
- DSCR
- —
- Eligible?
- —
Personal DTI + credit; lowest rate.
DSCR
20% down · 8.5% · 30yr
- Down + closing
- —
- Monthly P&I
- —
- Monthly cashflow
- —
- DSCR
- —
- Eligible?
- —
No personal income docs; deal must DSCR.
Hard money
10% down · 12.0% · 12mo
- Down + closing
- —
- Monthly P&I
- —
- Monthly cashflow
- —
- DSCR
- —
- Eligible?
- —
Short-term bridge; refi at stabilization.
Rent comps 8 comps
| Address | Beds | Baths | Sqft | Rent | $/sqft | DOM | Units | Dist |
|---|---|---|---|---|---|---|---|---|
| 2529 Cottonwood Ct Mays Landing, NJ | 2.0 | 1.5 | 1376 | $2,200 | $1.60 | 43d | 1 | 0.09mi |
| 2529 Cottonwood Ct Mays Landing, NJ | 2.0 | 1.5 | 1376 | $2,200 | $1.60 | 13d | 1 | 0.09mi |
| 2703 Mimosa Ct Mays Landing, NJ | 2.0 | 1.5 | 1268 | $2,200 | $1.74 | 13d | 1 | 0.17mi |
| 2807 Hawthorn Ct Mays Landing, NJ | 1.0 | 1.0 | 929 | $1,800 | $1.94 | 13d | 1 | 0.23mi |
| 3401 Montgomery Dr Mays Landing, NJ | 1.0–2.0 | 1.0–2.0 | 1192 | $2,810 | $2.36 | 13d | 18 | 0.28mi |
| 1932 Cologne Ave Mays Landing, NJ | 1.0–2.0 | 1.0–2.0 | 775 | $1,825 | $2.35 | 13d | 1 | 0.66mi |
| 2605 Flagstaff Ct #2605 Mays Landing, NJ | 2.0 | 2.0 | 1250 | $2,500 | $2.00 | 20d | 1 | 0.95mi |
| 2000 Timber Glen Dr Mays Landing, NJ | 2.0–3.0 | 2.5 | 1577 | $2,441 | $1.55 | 13d | 2 | 1.03mi |
HOA detail
- Monthly dues
- $232 · $2,784/yr
- Likely covers
- water
Listing history 8 events
-
2026-04-21status Pending
-
2026-04-16historical Active Under Contract
-
2026-04-13price $200,000
-
2026-03-09price $210,000
-
2026-01-15$215,000 Active
-
2025-09-12historical
-
2025-08-29price $210,000
-
2025-08-10$215,000 Active
ⓘ Source: listings_history table (triggers on properties + properties_extension) + one-shot
backfill from property_details.listing_events for pre-trigger history.
Climate risk First Street
- Flood 1/10 Low FEMA zone X (unshaded) · 0% chance over 30 yrs
- Wildfire 4/10 Moderate
- Heat 7/10 Severe 7 d/yr ≥101°F today · 15 d/yr by 30 yrs out
- Wind 8/10 Severe 80% chance of damaging wind over 30 yrs
- Air quality 3/10 Moderate 1 unhealthy d/yr today · 4 by 30 yrs out
Nearby sold comps map
Loading sold comps map…
Walkable amenities ~0.75 mi
Loading nearby amenities…
Taxation est. · year 1
- Rental income
- $26,898
- − Mortgage interest
- −$11,203
- − Property taxes
- −$3,000
- − Insurance
- −$1,000
- − Repairs & maintenance
- −$2,152
- − Management
- −$2,152
- − HOA
- −$2,784
- − Depreciation
- −$5,818
- Taxable loss
- −$1,211
- Est. tax savings @ 24.0%
- +$291
- After-tax cash flow
- $2,170/yr
For passive investors: Depreciation is non-cash, so a rental often shows a tax loss while cash-flowing — sheltering income. Rental losses are passive: they offset passive income freely, and up to $25,000/yr can offset ordinary (W-2) income if you actively participate and your MAGI is under $100k (phasing out to $0 by $150k); unused losses carry forward. On sale, claimed depreciation is recaptured at up to 25%, and gains may owe capital-gains tax (a 1031 exchange can defer both). Figures are a year-1 estimate at your 24.0% rate — not tax advice; consult a CPA.
Schools (NCES district)
- District
- Hamilton Township School District
- NCES district ID
- 3406510
- Math proficiency
- 9% ▼ -20.00%
- Reading proficiency
- 37% ▼ -9.00%
- Median HH income
- $60,997
- Composite
- 21.34/100
- National rank
- #8372
- State rank
- #401 of 472 in NJ
Livability — McKee City
No livability data for this city. (Only ~50 U.S. cities are tracked.)
Census & demographics
- Census place
- McKee City, NJ
- County
- Atlantic County · 143,611 people
- Metro
- Atlantic City-Hammonton, NJ
- Population (ZIP)
- 29,972
- Household income
- $77,167
- Rent vs Own
- Severe rent burden
- 1003.0
Population outlook (Atlantic County) Hauer SSP2
- Today (2025)
- 268,948 people
- By 2030
- 264,497 · -1.7%
- By 2040
- 252,261 · -6.2%
- By 2050
- 237,846 · -11.6%
- By 2075
- 210,650 · -21.7%
- By 2100
- 180,234 · -33.0%
Race, ethnicity, and origin ACS 2023
- Neighborhood character
- Diverse neighborhood (Simpson 0.62)
- Race & ethnicity
- White 58% Hispanic / Latino 16% Black 14% Two or more races 13% Asian 4%
- Hispanic origin (detail)
- Puerto Rican 7% Dominican 4%
- Common ancestry
- Romanian 3% Italian 2% Lithuanian 1%
- Foreign-born
- 9% · Canada, Vietnam, Guatemala
- Languages at home
- 84% English-only · Spanish 10% Tagalog/Filipino 1% Other Indo-European 1%
Political lean MEDSL · Atlantic
- 2024 margin
- Toss-up / Even · D 47.7% · R 50.7% · Other 1.6%
- 2008→2024 swing
- -18.1pp toward R · 2008: 15.1pp · 2024: -3.0pp
- All cycles
- 2024: R+3.0 2020: D+6.7 2016: D+6.2 2012: D+17.2 2008: D+15.1
Not yet ingested
- Civics
- —
Market trends
- HPI YoY
- ▲ 11.58%
- Current HPI
- 308.5148
- Rent YoY
- —
- Metro
- Atlantic City-Hammonton, NJ
- State GDP YoY
- ▲ 2.05%
- F500 in state
- 34
Industry mix (Fortune 500 HQ in NJ)
| Industry | F500 HQs | Revenue |
|---|---|---|
| Consumer Goods | 3 | $31B |
|
||
| Pharmaceuticals | 2 | $153B |
|
||
| Technology | 2 | $21B |
|
||
| Insurance | 2 | $20B |
|
||
| Healthcare | 2 | $19B |
|
||
| Financial Services | 1 | $70B |
|
||
Price history
-7.0% since first listed8 events — show timeline
- 2026-04-21 Pending — BRIGHT MLS
- 2026-04-16 Contingent — BRIGHT MLS
- 2026-04-13 Price Changed $200,000 BRIGHT MLS
- 2026-03-09 Price Changed $210,000 BRIGHT MLS
- 2026-01-15 Listed $215,000 BRIGHT MLS
- 2025-09-12 Listing Removed — BRIGHT MLS
- 2025-08-29 Price Changed $210,000 BRIGHT MLS
- 2025-08-10 Listed $215,000 BRIGHT MLS
Cash-flow waterfall
monthlySold comps — $/sqft
last 12 mo · ≤1 miLoading sold comps…