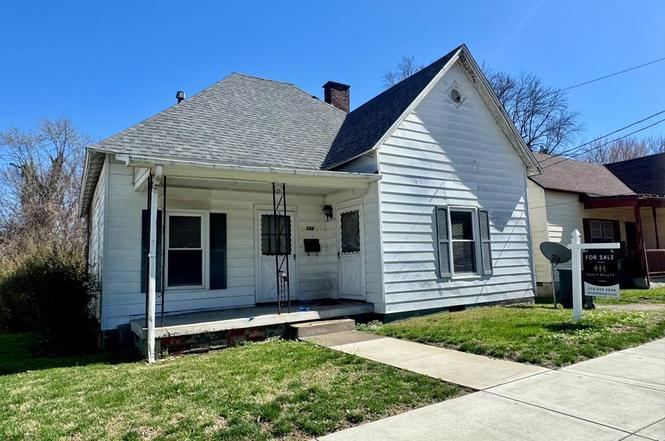
234 Lawrence St · Madisonville, KY
Flood risk 1/10 · Minimal
- FEMA flood zone
- X (unshaded)
- Chance of flooding over 30 yrs
- 0.0%
- Est. flood insurance / yr
- $507 – $1,088
Fire risk 3/10 · Minor
- Est. fire insurance / yr
- $839 – $1,559
Heat risk 5/10 · Moderate
- Hot days now (above 108°F)
- 7 days/yr
- Hot days in 30 yrs
- 20 days/yr
Wind risk 3/10 · Minor
- Chance of severe wind over 30 yrs
- 5.0%
Air-quality risk 2/10 · Minimal
- Unhealthy air days now
- 1 days/yr
- Unhealthy air days in 30 yrs
- 1 days/yr
Risk factors via First Street. Map © Google.
Why this score? — see what drove the B- grade
The composite is a weighted blend of 9 inputs, each scored 0–100. Each bar is that input's sub-score; the figure is the points it added to the 100-point composite (weight × sub-score).
- Cash flow +30.0/30.0
- DSCR +10.0/10.0
- 1% rule +9.7/10.0
- ARV discount +7.5/15.0
- Livability +3.6/5.0
- Schools +3.0/10.0
- Rent growth +2.5/5.0
- Condition / age +2.5/5.0
- Appreciation +0.0/10.0
$54,000
🖨 Deal sheet 📄 Offer letter ✓ Due diligence
Listing remarks
Full of history and opportunity, this 2 bedroom, 1 bathroom home offers a unique chance to restore and reimagine a property with character. Originally built in 1900 and rebuilt approximately 45 years ago following a fire, the home blends early charm with a more modern footprint. Recent updates include a new roof in 2024 and a new sump pump in the cellar, providing peace of mind on two major items. The family room features a gas log fireplace, adding warmth and character to the living space. The gas furnace is functional, while the central AC is not operational; however, two window units provide cooling during the summer months. This property is ideal for buyers or investors ready to bring t
Key facts
- New sump pump
- Gas log fireplace
- New roof
Tags
Property features AI
Exterior
- Security: Smoke detectors
- Home design: Single-family residence; Residential property
- Construction: Aluminum siding; Composition roof
- Exterior features: Covered patio
Interior
- Kitchen: Range; Electric range
- Bedrooms: 2 main-level bedrooms
- Flooring: Laminate flooring
- Bathrooms: 1 full bathroom (main level)
- Heating & cooling: Forced air heating (natural gas); Window air conditioning
- Interior features: Fireplace (1); Unfinished basement
- Laundry & utility: Laundry on the main level; Gas water heater
Neighborhood map
What this means for you Summary
Snapshot
- This is a 2-bed/1.0-bath single-family listed at $54k.
Deal economics
- At list price, monthly cash flow is $255 ($3k/yr) — positive.
- The deal already cash-flows at list — no discount required.
- Meets the 1% rule at list price ($795 rent vs $54k).
- Recommended offer: $48k (12.0% below list) — sets the bar for market timing.
- Cap rate 12.0% vs local median 4.0% in Madisonville — top-decile yield for the area; either an underpriced asset or a hidden risk that comps aren't pricing in. Stress-test before assuming the spread holds.
Location & tenants
- Location reads 72/100 on livability (#132 in KY) — a middle-class / working-renter tenant base. Strengths: crime A+, cost of living A+, housing A+; Watch: amenities F, commute F, employment F.
- Hopkins County (town): math 27% / reading 43% proficiency, ranked #65 of 165 in KY (top 39%) — families likely to look elsewhere, expect single-tenant / working-renter base with shorter leases.
- Market conditions: 192 active listings in the ZIP; 1 comparable units currently listed for rent nearby; 122 units permitted in Hopkins County in 2024 (0 in 5+ unit buildings).
Forward outlook
- Local home prices are declining (-3.0%/yr); year-one equity from $373 of loan paydown is wiped out by about $2k of value loss. Plan a longer hold.
- Hopkins County population projected at -13% by 2050 — secular population decline; favor cash flow + early exit over multi-decade hold.
- At projected returns (-3.0% appreciation + 3.0% rent growth), your $15k cash investment doubles in ~6 years — after that, you're playing with house money.
Negotiation context
- It's been on market 170 days — a 12% lower offer ($48k) is reasonable based on typical stale-listing flexibility.
- 2 sale attempts; this cycle's ask has dropped $11k (17%) from the opening price — seller is motivated, your offer sets the floor, not the list.
Risks & watch-outs
- Watch-outs: built in 1900 — expect roof / HVAC / electrical / plumbing capex.
- Climate carrying-cost: extreme-heat days projected 7→20/yr by 2055 (HVAC capex compounding) — expect insurance premiums to compound above CPI over the hold.
Questions for the listing agent
- It's been on market 170 days. Have you received any prior offers? Is the seller open to a 12% concession, seller financing, or rate buy-down credit?
- Built in 1900 — when were the roof, HVAC, electrical panel, plumbing, and water heater last replaced?
- Why hasn't it sold? Are there any deal-killer items the seller is aware of (foundation, flood, title, zoning, code violations)?
- Is there a deadline driving the sale (1031 exchange, divorce, estate, relocation)? That informs how much negotiation room exists.
- What's the average days-on-market for RENTAL listings here right now (not sales)? A rising rental-DOM trend means longer vacancies and softer asking-rent achievability than the comps imply.
- What's the recent tenant-quality profile in this submarket — average credit score on applications, eviction rate, late-payment / NSF rate, and stable-employment percentage? A property-management company in the area should have these aggregated.
- How much new for-sale + rental construction is in the pipeline within 1–3 miles? Heavy new supply typically softens prices + rents 12–24 months out; constrained supply supports both.
Investment metrics
- 1% rule
- 1.47% ✓
- Cap rate
- 11.96%
- Cash-on-cash
- 20.23%
- DSCR
- 1.90
- GRM
- 5.7
CMA / ARV
- ARV (on-the-fly)
- $112,716
- Comps found
- 12
Show comp detail 12 sales within ~0.75 mi
| Address | Dist | Beds/Ba | Sqft | Sold | Price | $/sf | Match |
|---|---|---|---|---|---|---|---|
| 21 West Lake St | 0.33mi | 2/2.0 | 1,120 (+0%) | 1mo | $145,000 | $129 | 80 |
| 512 W Center St | 0.27mi | 2/1.0 | 1,080 (-3%) | 12mo | $15,000 | $14 | 72 |
| 233 Hopewell St | 0.53mi | 2/1.0 | 1,109 (-1%) | 5mo | $90,000 | $81 | 70 |
| 616 Victoria St | 0.41mi | 3/1.0 (+1) | 1,158 (+4%) | 2mo | $15,000 | $13 | 68 |
| 626 Dozier Ave | 0.47mi | 2/1.0 | 1,132 (+1%) | 11mo | $129,000 | $114 | 66 |
| 771 Sugg St | 0.58mi | 2/1.0 | 1,082 (-3%) | 10mo | $121,500 | $112 | 60 |
| 170 Murray St | 0.51mi | 2/1.0 | 1,036 (-7%) | 6mo | $41,000 | $40 | 59 |
| 325 Pride Ave | 0.63mi | 2/1.0 | 1,199 (+7%) | 5mo | $45,000 | $38 | 54 |
| 413 W Arch St | 0.37mi | 2/1.0 | 964 (-14%) | 8mo | $96,910 | $101 | 53 |
| 333 Woodson Ave | 0.69mi | 1/1.0 (-1) | 1,236 (+11%) | 1mo | $120,000 | $97 | 44 |
| 605 Virginia Ave | 0.74mi | 3/1.0 (+1) | 1,014 (-9%) | 6mo | $120,000 | $118 | 40 |
| 612 Cherokee St | 0.73mi | 3/2.0 (+1) | 1,238 (+11%) | 2mo | $185,000 | $149 | 37 |
Match score weights: distance 35% · size 25% · config 20% · recency 20%. Top-matched comps best support the ARV.
Projected returns pro-forma
-3.0% appreciation · 3.0% rent growth · sell at horizon
- IRR
- 12.5%
- Equity multiple
- 1.50×
- Total profit
- $7,494
- Equity at exit
- $8,052
- IRR
- 21.4%
- Equity multiple
- 2.82×
- Total profit
- $27,477
- Equity at exit
- $4,669
Cash invested: $15,120 (down + closing). Projections, not guarantees.
Landlord ↔ Tenant lean methodology
- Overall (STATE)
- 83 Strongly Landlord-Friendly
- State Kentucky
- 83 Strongly Landlord-Friendly · R+16
- County
- — inherits STATE
- City
- — inherits STATE
ZIP-level market 42431
- Home prices YoY
- -15.2%
- Active inventory
- 192
- Price-to-rent
- 5.7×
Monthly cashflow live
- Estimated rent
- $795 medium interval (Pro) →
- Mortgage (P&I)
- −$283
- Tax est. 1.5%
- −$68 /mo · $810/yr
- Insurance
- −$22
- HOA
- −$0
- Vacancy / Maint / Mgmt
- −$167
- Net cashflow
- $255
Break-even live
UW: 25.0% down · 7.5% · 30yr · 1.5% tax · 5.0% vac · 8.0% maint · 8.0% mgmt
Financing live
Cash to close
- Down payment
- $13,500
- Closing costs
- $1,620
- Reserves months
- —
- Total cash needed
- —
Loan-product check · same deal, 3 products live
Conventional
25% down · 7.5% · 30yr
- Down + closing
- —
- Monthly P&I
- —
- Monthly cashflow
- —
- DSCR
- —
- Eligible?
- —
Personal DTI + credit; lowest rate.
DSCR
20% down · 8.5% · 30yr
- Down + closing
- —
- Monthly P&I
- —
- Monthly cashflow
- —
- DSCR
- —
- Eligible?
- —
No personal income docs; deal must DSCR.
Hard money
10% down · 12.0% · 12mo
- Down + closing
- —
- Monthly P&I
- —
- Monthly cashflow
- —
- DSCR
- —
- Eligible?
- —
Short-term bridge; refi at stabilization.
Rent comps 1 comps
| Address | Beds | Baths | Sqft | Rent | $/sqft | DOM | Units | Dist |
|---|---|---|---|---|---|---|---|---|
| 901 Princeton Rd Unit 504 Madisonville, KY | 2.0 | 1.0 | 864 | $795 | $0.92 | 13d | 1 | 0.98mi |
Listing history 21 events
-
2026-06-18days on market $54,000 Active 170 DOM
-
2026-06-17days on market $54,000 Active 169 DOM
-
2026-06-16days on market $54,000 Active 168 DOM
-
2026-06-15days on market $54,000 Active 167 DOM
-
2026-06-13days on market $54,000 Active 165 DOM
-
2026-06-12days on market $54,000 Active 164 DOM
-
2026-06-09days on market $54,000 Active 161 DOM
-
2026-06-08days on market $54,000 Active 160 DOM
-
2026-06-07days on market $54,000 Active 159 DOM
-
2026-06-07days on market $54,000 Active 158 DOM
-
2026-06-04days on market $54,000 Active 155 DOM
-
2026-06-02days on market $54,000 Active 154 DOM
-
2026-06-01days on market $54,000 Active 153 DOM
-
2026-05-31days on market $54,000 Active 152 DOM
-
2026-05-31days on market $54,000 Active 151 DOM
-
2026-05-06price $54,000
-
2026-04-30status Active
-
2026-04-22status Pending
-
2026-03-19price $58,000
-
2026-02-05price $62,000
-
2025-12-22$65,000 Active
ⓘ Source: listings_history table (triggers on properties + properties_extension) + one-shot
backfill from property_details.listing_events for pre-trigger history.
Climate risk First Street
- Flood 1/10 Low FEMA zone X (unshaded) · 0% chance over 30 yrs
- Wildfire 3/10 Moderate
- Heat 5/10 Major 7 d/yr ≥108°F today · 20 d/yr by 30 yrs out
- Wind 3/10 Moderate 5% chance of damaging wind over 30 yrs
- Air quality 2/10 Low 1 unhealthy d/yr today · 1 by 30 yrs out
Nearby sold comps map
Loading sold comps map…
Walkable amenities ~0.75 mi
Loading nearby amenities…
Taxation est. · year 1
- Rental income
- $9,540
- − Mortgage interest
- −$3,025
- − Property taxes
- −$810
- − Insurance
- −$270
- − Repairs & maintenance
- −$763
- − Management
- −$763
- − Depreciation
- −$1,571
- Taxable income
- $2,338
- Est. tax owed @ 24.0%
- −$561
- After-tax cash flow
- $2,497/yr
For passive investors: Depreciation is non-cash, so a rental often shows a tax loss while cash-flowing — sheltering income. Rental losses are passive: they offset passive income freely, and up to $25,000/yr can offset ordinary (W-2) income if you actively participate and your MAGI is under $100k (phasing out to $0 by $150k); unused losses carry forward. On sale, claimed depreciation is recaptured at up to 25%, and gains may owe capital-gains tax (a 1031 exchange can defer both). Figures are a year-1 estimate at your 24.0% rate — not tax advice; consult a CPA.
Schools (NCES district)
- District
- Hopkins County
- NCES district ID
- 2102860
- Math proficiency
- 27% ▼ -23.00%
- Reading proficiency
- 43% ▼ -17.00%
- Median HH income
- $42,436
- Composite
- 29.56/100
- National rank
- #6488
- State rank
- #65 of 165 in KY
Livability — Madisonville
- Score
- 72/100
- State rank
- #132
- US rank
- #6200
Category grades
Schools grade is shown separately in the Schools card above.
Census & demographics
- Census place
- Madisonville, KY
- City population
- 27,095
- Population (ZIP)
- 27,095
Population outlook (Hopkins County) Hauer SSP2
- Today (2025)
- 45,164 people
- By 2030
- 44,083 · -2.4%
- By 2040
- 41,650 · -7.8%
- By 2050
- 39,303 · -13.0%
- By 2075
- 34,567 · -23.5%
- By 2100
- 29,476 · -34.7%
Race, ethnicity, and origin ACS 2023
- Neighborhood character
- Predominantly White (83%)
- Race & ethnicity
- White 83% Black 8% Two or more races 6% Hispanic / Latino 3% Native American 1%
- Common ancestry
- Lithuanian 2% Slovak 1% Serbian 1%
- Foreign-born
- 2% · Canada, China
- Languages at home
- 97% English-only · Spanish 2%
Political lean MEDSL · Hopkins
- 2024 margin
- Solid R (+50.9) · D 23.9% · R 74.8% · Other 1.2%
- 2008→2024 swing
- -26.0pp toward R · 2008: -24.9pp · 2024: -50.9pp
- All cycles
- 2024: R+50.9 2020: R+48.0 2016: R+54.0 2012: R+39.9 2008: R+24.9
Not yet ingested
- Civics
- —
Market trends
- HPI YoY
- ▼ -39.52%
- Current HPI
- 220.2269
- Rent YoY
- —
- Metro
- —
- State GDP YoY
- ▲ 1.81%
- F500 in state
- 4
Industry mix (Fortune 500 HQ in KY)
| Industry | F500 HQs | Revenue |
|---|---|---|
| Healthcare | 1 | $118B |
|
||
| Food / Beverage | 1 | $7B |
|
||
Price history
-16.9% since first listed6 events — show timeline
- 2026-05-06 Price Changed $54,000 MHCBOR
- 2026-04-30 Relisted — MHCBOR
- 2026-04-22 Pending — MHCBOR
- 2026-03-19 Price Changed $58,000 MHCBOR
- 2026-02-05 Price Changed $62,000 MHCBOR
- 2025-12-22 Listed $65,000 MHCBOR
Cash-flow waterfall
monthlySold comps — $/sqft
last 12 mo · ≤1 miLoading sold comps…