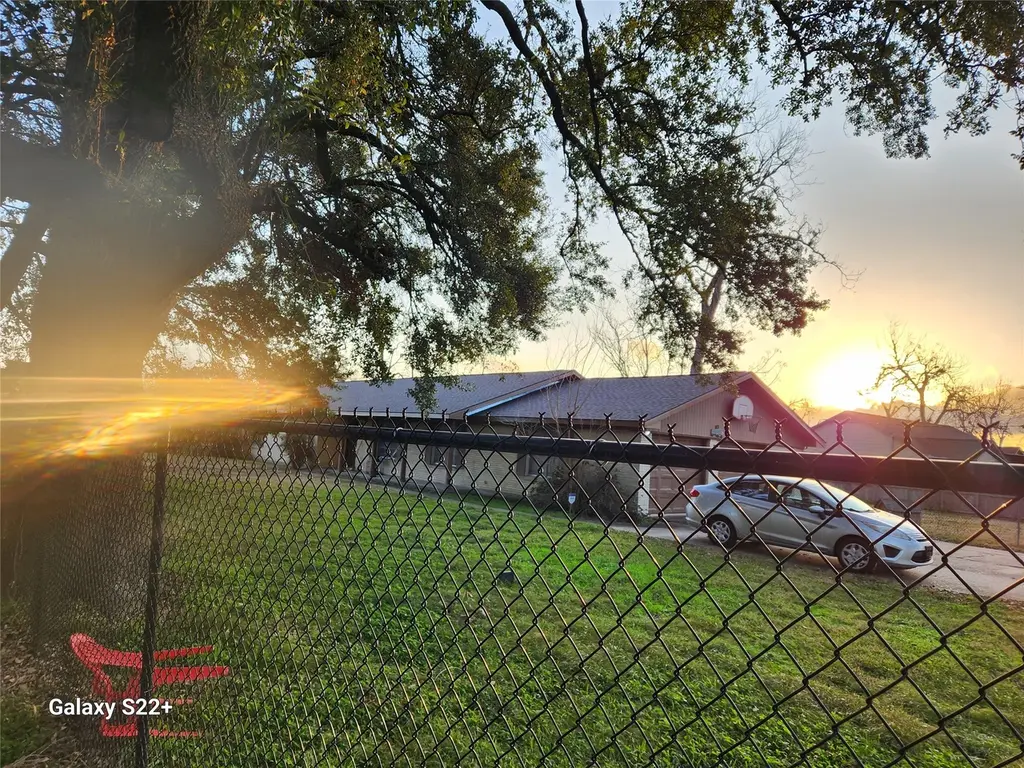
9411 Lomax St · Houston, TX
Flood risk 6/10 · Moderate
- FEMA flood zone
- X (unshaded)
- Chance of flooding over 30 yrs
- 0.7%
- Est. flood insurance / yr
- $507 – $1,088
Fire risk 1/10 · Minimal
- Est. fire insurance / yr
- $1,222 – $2,270
Heat risk 9/10 · Severe
- Hot days now (above 109°F)
- 7 days/yr
- Hot days in 30 yrs
- 24 days/yr
Wind risk 9/10 · Severe
- Chance of severe wind over 30 yrs
- 99.0%
Air-quality risk 3/10 · Minor
- Unhealthy air days now
- 2 days/yr
- Unhealthy air days in 30 yrs
- 3 days/yr
Risk factors via First Street. Map © Google.
Why this score? — see what drove the B- grade
The composite is a weighted blend of 9 inputs, each scored 0–100. Each bar is that input's sub-score; the figure is the points it added to the 100-point composite (weight × sub-score).
- Cash flow +27.9/30.0
- DSCR +9.9/10.0
- ARV discount +8.4/15.0
- 1% rule +8.3/10.0
- Rent growth +3.8/5.0
- Livability +3.7/5.0
- Schools +2.7/10.0
- Condition / age +2.5/5.0
- Appreciation +0.0/10.0
$200,000
🖨 Deal sheet 📄 Offer letter ✓ Due diligence
Key facts
- 0.37 acre lot
- 2 garage spots
- Built 1965
Property features AI
Exterior
- Parking: Attached 2-car garage
- Utilities: Public water; Public sewer
- Home design: Residential property; Single-story entry with additional levels (multi-level interior)
- Construction: Brick construction; Built in 1965; Composition roof; Slab foundation
- Exterior features: Corner lot
Interior
- Kitchen: Kitchen integrated with family room
- Bedrooms: Primary bedroom on the first floor (approx. 14 x 16); Bedroom on the second floor (approx. 12 x 14); Bedroom on the third floor (approx. 12 x 14)
- Bathrooms: 2 full bathrooms
- Heating & cooling: Central heating (electric and gas); Central air conditioning (gas)
- Interior features: Kitchen and family room are combined
Neighborhood map
What this means for you Summary
Snapshot
- This is a 3-bed/1.5-bath single-family listed at $200k.
Deal economics
- At list price, monthly cash flow is $619 ($7k/yr) — positive.
- The deal already cash-flows at list — no discount required.
- Meets the 1% rule at list price ($3k rent vs $200k).
- Recommended offer: $188k (6.0% below list) — sets the bar for market timing.
- Cap rate 10.0% vs local median 3.2% in Houston — top-decile yield for the area; either an underpriced asset or a hidden risk that comps aren't pricing in. Stress-test before assuming the spread holds.
Location & tenants
- Location reads 74/100 on livability (#184 in TX, #4,771 nationally) — a middle-class / working-renter tenant base. Strengths: amenities A+, cost of living A+, housing A+; Watch: crime F.
- Houston ISD (urban): math 27% / reading 35% proficiency, ranked #593 of 826 in TX (top 72%) — families likely to look elsewhere, expect single-tenant / working-renter base with shorter leases; 71% free/reduced lunch — lower-income household profile, screen leases tightly.
- Zoned schools: Henry Middle (math 8% / reading 12%, grade F, #1,641 of 1,662 statewide, top 99%, 690 students, 98% FRL); Houston Math Science And Technology Center (math 9% / reading 21%, grade F, #1,507 of 1,632 statewide, top 93%, 2,779 students, 95% FRL) — zoned schools average 97% FRL vs 71% district-wide (25 pts higher); higher-poverty schools than district average — tighter screening recommended.
- Zoned-school proficiency averages 12% at this address vs 31% district-wide (-18 pts) — the specific schools serving this property underperform the Houston ISD average; the district grade overstates school quality for this exact location.
- Market conditions: Rents rising fast (+5.3%/yr); 148 active listings in the ZIP; 7 comparable units currently listed for rent nearby; rentals at typical pace (median 22d on market — plan ~3-4 weeks tenant-placement turnaround); 29,883 units permitted in Harris County in 2024 (8,621 in 5+ unit buildings).
- At $2,667/mo this rent would consume 68% of the median local household income ($47k/yr) (locally 1815% of renters already pay >50% of income on rent) — very limited rent-growth headroom before tenants either downsize or default.
Forward outlook
- Local home prices are declining (-3.0%/yr); year-one equity from $1k of loan paydown is wiped out by about $6k of value loss. Plan a longer hold.
- Harris County population projected at +47% by 2050 — long-run rental-demand tailwind backs the buy-and-hold thesis.
- At projected returns (-3.0% appreciation + 5.3% rent growth), your $56k cash investment doubles in ~8 years — after that, you're playing with house money.
Negotiation context
- It's been on market 67 days — a 6% lower offer ($188k) is reasonable based on typical stale-listing flexibility.
- 3 sale attempts with the ask held roughly flat each time — persistent listings suggest the price (not the market) is what's stuck; bring a comps-based counter.
Risks & watch-outs
- Climate carrying-cost: major flood risk; severe wind risk, 99% chance of damaging wind over 30y; extreme-heat days projected 7→24/yr by 2055 (HVAC capex compounding) — expect insurance premiums to compound above CPI over the hold.
Questions for the listing agent
- It's been on market 67 days. Have you received any prior offers? Is the seller open to a 6% concession, seller financing, or rate buy-down credit?
- Built in 1965 — when were the roof, HVAC, electrical panel, plumbing, and water heater last replaced?
- Why hasn't it sold? Are there any deal-killer items the seller is aware of (foundation, flood, title, zoning, code violations)?
- Is there a deadline driving the sale (1031 exchange, divorce, estate, relocation)? That informs how much negotiation room exists.
- Schools are D-rated, which usually means shorter tenancies and higher turnover. Who's the typical renter profile here, and what's been the actual vacancy rate?
- Crime grade is F in this area — have there been break-ins, vandalism, or insurance claims at this property in the last 3 years? What carrier currently insures it and at what premium?
- What's the average days-on-market for RENTAL listings here right now (not sales)? A rising rental-DOM trend means longer vacancies and softer asking-rent achievability than the comps imply.
- What's the recent tenant-quality profile in this submarket — average credit score on applications, eviction rate, late-payment / NSF rate, and stable-employment percentage? A property-management company in the area should have these aggregated.
- How much new for-sale + rental construction is in the pipeline within 1–3 miles? Heavy new supply typically softens prices + rents 12–24 months out; constrained supply supports both.
Investment metrics
- 1% rule
- 1.33% ✓
- Cap rate
- 10.01%
- Cash-on-cash
- 13.27%
- DSCR
- 1.59
- GRM
- 6.3
CMA / ARV
- ARV (on-the-fly)
- $204,306
- Comps found
- 5
Show comp detail 5 sales within ~0.75 mi
| Address | Dist | Beds/Ba | Sqft | Sold | Price | $/sf | Match |
|---|---|---|---|---|---|---|---|
| 8917 Etta St Unit A | 0.67mi | 4/2.5 (+1) | 1,855 (-7%) | 7mo | $277,250 | $149 | 42 |
| 1725 Tidwell Ln | 0.51mi | 3/2.0 | 1,813 (-10%) | 22mo | $184,990 | $102 | 40 |
| 2922 Hohl St | 0.52mi | 3/2.5 | 1,720 (-14%) | 14mo | $230,000 | $134 | 36 |
| 2003 Turner Dr | 0.46mi | 4/2.0 (+1) | 2,300 (+15%) | 18mo | $185,000 | $80 | 32 |
| 2630 Kenco St | 0.52mi | 4/2.0 (+1) | 1,721 (-14%) | 18mo | $130,000 | $76 | 30 |
Match score weights: distance 35% · size 25% · config 20% · recency 20%. Top-matched comps best support the ARV.
Projected returns pro-forma
-3.0% appreciation · 5.31% rent growth · sell at horizon
- IRR
- 6.0%
- Equity multiple
- 1.24×
- Total profit
- $13,464
- Equity at exit
- $29,821
- IRR
- 17.5%
- Equity multiple
- 2.61×
- Total profit
- $90,199
- Equity at exit
- $17,292
Cash invested: $56,000 (down + closing). Projections, not guarantees.
Landlord ↔ Tenant lean methodology
- Overall (STATE)
- 87 Strongly Landlord-Friendly
- State Texas
- 87 Strongly Landlord-Friendly · R+5
- County
- — inherits STATE
- City
- — inherits STATE
ZIP-level market 77093
- Home prices YoY
- -9.9%
- Rents YoY
- 5.3%
- Active inventory
- 148
- Price-to-rent
- 6.3×
Monthly cashflow live
- Estimated rent
- $2,667 high interval (Pro) →
- Mortgage (P&I)
- −$1,049
- Tax from tax record
- −$355 /mo · $4,265/yr
- Insurance
- −$83
- HOA
- −$0
- Vacancy / Maint / Mgmt
- −$560
- Net cashflow
- $619
Break-even live
UW: 25.0% down · 7.5% · 30yr · 1.5% tax · 5.0% vac · 8.0% maint · 8.0% mgmt
Financing live
Cash to close
- Down payment
- $50,000
- Closing costs
- $6,000
- Reserves months
- —
- Total cash needed
- —
Loan-product check · same deal, 3 products live
Conventional
25% down · 7.5% · 30yr
- Down + closing
- —
- Monthly P&I
- —
- Monthly cashflow
- —
- DSCR
- —
- Eligible?
- —
Personal DTI + credit; lowest rate.
DSCR
20% down · 8.5% · 30yr
- Down + closing
- —
- Monthly P&I
- —
- Monthly cashflow
- —
- DSCR
- —
- Eligible?
- —
No personal income docs; deal must DSCR.
Hard money
10% down · 12.0% · 12mo
- Down + closing
- —
- Monthly P&I
- —
- Monthly cashflow
- —
- DSCR
- —
- Eligible?
- —
Short-term bridge; refi at stabilization.
Rent comps 7 comps
| Address | Beds | Baths | Sqft | Rent | $/sqft | DOM | Units | Dist |
|---|---|---|---|---|---|---|---|---|
| 3208 Bostic St Unit 1254540P Houston, TX | 3.0 | 2.0 | 1603 | $3,691 | $2.30 | 2d | 1 | 0.99mi |
| 8326 Curry Rd Unit 1228882P Houston, TX | 3.0 | 2.0 | 1614 | $2,878 | $1.78 | 7d | 1 | 1.00mi |
| 8322 Curry Rd Houston, TX | 3.0 | 2.5 | 1599 | $2,500 | $1.56 | 43d | 1 | 1.01mi |
| 8320 Curry Rd Unit 1391267P Houston, TX | 3.0 | 2.5 | 1550 | $5,134 | $3.31 | 1d | 1 | 1.01mi |
| 8320 Curry Rd Houston, TX | 3.0 | 2.5 | 1558 | $8,950 | $5.74 | 22d | 1 | 1.01mi |
| 8318 Curry Rd Houston, TX | 3.0 | 2.0 | 1558 | $2,299 | $1.48 | 43d | 1 | 1.02mi |
| 2623 Huntington Creek Ln Houston, TX | 3.0 | 2.5 | 1553 | $2,299 | $1.48 | 24d | 1 | 1.02mi |
Listing history 13 events
-
2026-06-04status $200,000 Pending 67 DOM
-
2026-06-01days on market $200,000 Active Under Contract 67 DOM
-
2026-05-31days on market $200,000 Active Under Contract 66 DOM
-
2026-04-09historical Active Under Contract
-
2026-03-25$200,000 Active
-
2025-10-08historical
-
2025-10-08status Active
-
2025-07-10status Pending
-
2025-06-24historical Active Under Contract
-
2025-06-04status Pending, Continue to Show
-
2025-05-19$215,000 Active
-
2025-05-09historical
-
1991-05-15soldstatus
ⓘ Source: listings_history table (triggers on properties + properties_extension) + one-shot
backfill from property_details.listing_events for pre-trigger history.
Tax reassessment forecast TX · Resets to sale price
- Current annual tax
- $4,265 · $355/mo
- Projected year-2 tax
- $4,265 · $355/mo
- Expected delta
- $0/yr ($0/mo · 0.0%)
ⓘ Screening estimate from a state-policy table — verify with the county assessor before closing.
Climate risk First Street
- Flood 6/10 Major FEMA zone X (unshaded) · 70% chance over 30 yrs
- Wildfire 1/10 Low
- Heat 9/10 Extreme 7 d/yr ≥109°F today · 24 d/yr by 30 yrs out
- Wind 9/10 Extreme 99% chance of damaging wind over 30 yrs
- Air quality 3/10 Moderate 2 unhealthy d/yr today · 3 by 30 yrs out
Nearby sold comps map
Loading sold comps map…
Walkable amenities ~0.75 mi
Loading nearby amenities…
Taxation est. · year 1
- Rental income
- $31,999
- − Mortgage interest
- −$11,203
- − Property taxes
- −$4,265
- − Insurance
- −$1,000
- − Repairs & maintenance
- −$2,560
- − Management
- −$2,560
- − Depreciation
- −$5,818
- Taxable income
- $4,593
- Est. tax owed @ 24.0%
- −$1,102
- After-tax cash flow
- $6,326/yr
For passive investors: Depreciation is non-cash, so a rental often shows a tax loss while cash-flowing — sheltering income. Rental losses are passive: they offset passive income freely, and up to $25,000/yr can offset ordinary (W-2) income if you actively participate and your MAGI is under $100k (phasing out to $0 by $150k); unused losses carry forward. On sale, claimed depreciation is recaptured at up to 25%, and gains may owe capital-gains tax (a 1031 exchange can defer both). Figures are a year-1 estimate at your 24.0% rate — not tax advice; consult a CPA.
Schools (NCES district)
- District
- Houston ISD
- NCES district ID
- 4823640
- Math proficiency
- 27% ▼ -18.00%
- Reading proficiency
- 35% ▼ -6.00%
- Median HH income
- $46,054
- Composite
- 26.63/100
- National rank
- #7173
- State rank
- #593 of 826 in TX
Livability — Houston
- Score
- 74/100
- State rank
- #184
- US rank
- #4771
Category grades
Schools grade is shown separately in the Schools card above.
Census & demographics
- Census place
- Houston, TX
- County
- Harris County · 4,702,590 people
- City population
- 3,226,434
- Metro
- Houston-The Woodlands-Sugar Land, TX
- Population (ZIP)
- 46,407
- Household income
- $46,766
- Rent vs Own
- Severe rent burden
- 1815.0
Population outlook (Harris County) Hauer SSP2
- Today (2025)
- 5,571,493 people
- By 2030
- 6,089,821 · +9.3%
- By 2040
- 7,142,806 · +28.2%
- By 2050
- 8,185,864 · +46.9%
- By 2075
- 10,574,329 · +89.8%
- By 2100
- 12,109,958 · +117.4%
Race, ethnicity, and origin ACS 2023
- Neighborhood character
- Predominantly Hispanic (82%)
- Race & ethnicity
- Hispanic / Latino 82% Two or more races 24% Black 11% White 6% Native American 1%
- Hispanic origin (detail)
- Mexican 70%
- Foreign-born
- 34% · Canada
- Languages at home
- 30% English-only · Spanish 70%
Political lean MEDSL · Harris
- 2024 margin
- Lean D (+5.5) · D 52.0% · R 46.4% · Other 1.6%
- 2008→2024 swing
- +3.9pp toward D · 2008: 1.6pp · 2024: 5.5pp
- All cycles
- 2024: D+5.5 2020: D+13.3 2016: D+12.4 2012: D+0.1 2008: D+1.6
Not yet ingested
- Civics
- —
Market trends
- HPI YoY
- ▼ -30.53%
- Current HPI
- 277.4914
- Rent YoY
- ▲ 5.31%
- Metro
- Houston-The Woodlands-Sugar Land, TX
- State GDP YoY
- ▲ 3.95%
- F500 in state
- 110
Industry mix (Fortune 500 HQ in TX)
| Industry | F500 HQs | Revenue |
|---|---|---|
| Energy | 16 | $1,198B |
|
||
| Technology | 5 | $198B |
|
||
| Engineering / Construction | 4 | $72B |
|
||
| Energy Services | 3 | $60B |
|
||
| Utilities | 3 | $41B |
|
||
| Healthcare | 2 | $330B |
|
||
Price history
-7.0% since first listed10 events — show timeline
- 2026-04-09 Contingent — HARMLS
- 2026-03-25 Listed $200,000 HARMLS
- 2025-10-08 Listing Removed — HARMLS
- 2025-10-08 Relisted — HARMLS
- 2025-07-10 Pending — HARMLS
- 2025-06-24 Contingent — HARMLS
- 2025-06-04 Pending — HARMLS
- 2025-05-19 Listed $215,000 HARMLS
- 2025-05-09 Coming Soon — HARMLS
- 1991-05-15 Sold (Public Records) — Public Records
Property tax history
+0.1%/yrLatest (2025): $4,265 · +11.7% YoY. Source: county tax records.
Cash-flow waterfall
monthlySold comps — $/sqft
last 12 mo · ≤1 miLoading sold comps…