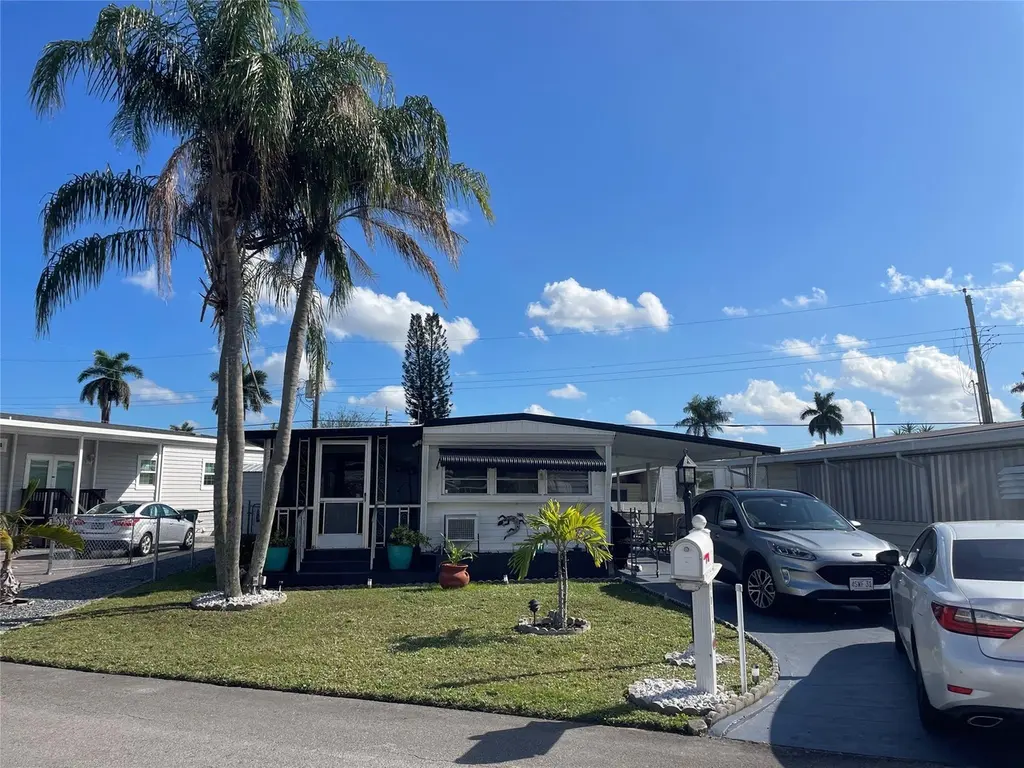
8610 SW 18th Ct · Davie, FL
Flood risk 1/10 · Minimal
- FEMA flood zone
- X (shaded)
- Chance of flooding over 30 yrs
- 0.0%
- Est. flood insurance / yr
- $507 – $1,088
Fire risk 1/10 · Minimal
- Est. fire insurance / yr
- $947 – $1,759
Heat risk 10/10 · Severe
- Hot days now (above 105°F)
- 7 days/yr
- Hot days in 30 yrs
- 27 days/yr
Wind risk 10/10 · Severe
- Chance of severe wind over 30 yrs
- 99.0%
Air-quality risk 3/10 · Minor
- Unhealthy air days now
- 2 days/yr
- Unhealthy air days in 30 yrs
- 3 days/yr
Risk factors via First Street. Map © Google.
Why this score? — see what drove the C+ grade
The composite is a weighted blend of 9 inputs, each scored 0–100. Each bar is that input's sub-score; the figure is the points it added to the 100-point composite (weight × sub-score).
- Cash flow +25.5/30.0
- DSCR +8.4/10.0
- 1% rule +8.2/10.0
- ARV discount +7.5/15.0
- Schools +4.1/10.0
- Livability +4.1/5.0
- Rent growth +2.8/5.0
- Condition / age +2.5/5.0
- Appreciation +0.0/10.0
$149,900
🖨 Deal sheet 📄 Offer letter ✓ Due diligence
Listing remarks
Absolutely gorgeous 2/1 Dollhouse that's cute as a button with pushout/Fl. room - -carport - shed - -screened in patio - -beautiful laminate and tile floors through out - -assoc. states it is HOPA verified - priced right for quick sale - -truly a must see. .. .. .. .. .
Key facts
- Shed
- Carport
- Screened in patio
Tags
Property features AI
Finance
- HOA & community: Community with association; Monthly association fee of $129; Community amenities include clubhouse, pool, shuffleboard court; Senior community; Pets allowed with possible breed restrictions
Exterior
- Parking: Attached carport; 2 covered/carport spaces; Driveway
- Utilities: Public water; Public sewer; Cable available
- Home design: Mobile home; One story; Faces west; Resale condition
- Construction: Skirt: Other
- Exterior features: Screened porch; Porch; Not waterfront
Interior
- Kitchen: Electric range; Refrigerator
- Bedrooms: 2 bedrooms on the main level
- Flooring: Laminate flooring; Tile flooring
- Bathrooms: 1 full bathroom (main level)
- Heating & cooling: Window/wall heating; Wall/window cooling units
- Interior features: Entrance foyer; Bedroom layout with stacked bedrooms
- Laundry & utility: Electric water heater
Neighborhood map
What this means for you Summary
Snapshot
- This is a 2-bed/1.0-bath manufactured listed at $150k.
Deal economics
- At list price, monthly cash flow is $348 ($4k/yr) — positive.
- The deal already cash-flows at list — no discount required.
- Meets the 1% rule at list price ($2k rent vs $150k).
- Recommended offer: $145k (3.0% below list) — sets the bar for market timing.
- Cap rate 9.1% vs local median 3.4% in Davie — top-decile yield for the area; either an underpriced asset or a hidden risk that comps aren't pricing in. Stress-test before assuming the spread holds.
Location & tenants
- Location reads 82/100 on livability (#68 in FL, #1,159 nationally) — a professional / high-income tenant draw. Strengths: schools A+, crime A+, housing A+; Watch: cost of living D, amenities D-.
- Broward (suburban): math 42% / reading 53% proficiency, ranked #46 of 73 in FL (top 63%) — families likely to look elsewhere, expect single-tenant / working-renter base with shorter leases.
- Market conditions: Rents rising (+1.2%/yr); 398 active listings in the ZIP; 24 comparable units currently listed for rent nearby; rentals leasing fast (median 8d on market — plan ~1-2 weeks tenant-placement turnaround); solid renter incomes; 2,111 units permitted in Broward County in 2024 (1,265 in 5+ unit buildings).
Forward outlook
- Local home prices are declining (-3.0%/yr); year-one equity from $1k of loan paydown is wiped out by about $4k of value loss. Plan a longer hold.
- Broward County population projected at +34% by 2050 — long-run rental-demand tailwind backs the buy-and-hold thesis.
Negotiation context
- It's been on market 56 days — a 3% lower offer ($145k) is reasonable based on typical stale-listing flexibility.
- Current owner paid $42k; list at $150k implies a 257% gain — meaningful room to come down on a strong offer.
Risks & watch-outs
- Climate carrying-cost: severe wind risk, 99% chance of damaging wind over 30y; extreme-heat days projected 7→27/yr by 2055 (HVAC capex compounding) — expect insurance premiums to compound above CPI over the hold.
Questions for the listing agent
- It's been on market 56 days. Have you received any prior offers? Is the seller open to a 3% concession, seller financing, or rate buy-down credit?
- Built in 1964 — when were the roof, HVAC, electrical panel, plumbing, and water heater last replaced?
- What does the HOA fee cover, when was the last increase, and are there any pending special assessments or reserve-fund shortfalls?
- Is there a deadline driving the sale (1031 exchange, divorce, estate, relocation)? That informs how much negotiation room exists.
- Schools are A-rated — typically a magnet for longer-tenancy family renters. What's the average tenant stay here, and is there a school-zone premium baked into asking?
- What's the average days-on-market for RENTAL listings here right now (not sales)? A rising rental-DOM trend means longer vacancies and softer asking-rent achievability than the comps imply.
- What's the recent tenant-quality profile in this submarket — average credit score on applications, eviction rate, late-payment / NSF rate, and stable-employment percentage? A property-management company in the area should have these aggregated.
- How much new for-sale + rental construction is in the pipeline within 1–3 miles? Heavy new supply typically softens prices + rents 12–24 months out; constrained supply supports both.
Investment metrics
- 1% rule
- 1.32% ✓
- Cap rate
- 9.08%
- Cash-on-cash
- 9.94%
- DSCR
- 1.44
- GRM
- 6.3
CMA / ARV
- ARV (on-the-fly)
- $89,010
- Comps found
- 2
Show comp detail 2 sales within ~0.75 mi
| Address | Dist | Beds/Ba | Sqft | Sold | Price | $/sf | Match |
|---|---|---|---|---|---|---|---|
| 1860 SW 83rd Ter | 0.22mi | 2/1.0 | 698 (+1%) | 2mo | $90,000 | $129 | 86 |
| 8641 SW 15th Ct | 0.24mi | 2/1.5 | 664 (-4%) | 12mo | $82,000 | $123 | 70 |
Match score weights: distance 35% · size 25% · config 20% · recency 20%. Top-matched comps best support the ARV.
Projected returns pro-forma
-3.0% appreciation · 1.23% rent growth · sell at horizon
- IRR
- -3.5%
- Equity multiple
- 0.87×
- Total profit
- $-5,469
- Equity at exit
- $22,351
- IRR
- 3.8%
- Equity multiple
- 1.25×
- Total profit
- $10,591
- Equity at exit
- $12,961
Cash invested: $41,972 (down + closing). Projections, not guarantees.
Landlord ↔ Tenant lean methodology
- Overall (STATE)
- 87 Strongly Landlord-Friendly
- State Florida
- 87 Strongly Landlord-Friendly · R+3
- County
- — inherits STATE
- City
- — inherits STATE
ZIP-level market 33324
- Home prices YoY
- -33.5%
- Rents YoY
- 1.2%
- Active inventory
- 398
- Price-to-rent
- 6.3×
Monthly cashflow live
- Estimated rent
- $1,984 high interval (Pro) →
- Mortgage (P&I)
- −$786
- Tax from tax record
- −$242 /mo · $2,902/yr
- Insurance
- −$62
- HOA
- −$129
- Vacancy / Maint / Mgmt
- −$417
- Net cashflow
- $348
Break-even live
UW: 25.0% down · 7.5% · 30yr · 1.5% tax · 5.0% vac · 8.0% maint · 8.0% mgmt
Financing live
Cash to close
- Down payment
- $37,475
- Closing costs
- $4,497
- Reserves months
- —
- Total cash needed
- —
Loan-product check · same deal, 3 products live
Conventional
25% down · 7.5% · 30yr
- Down + closing
- —
- Monthly P&I
- —
- Monthly cashflow
- —
- DSCR
- —
- Eligible?
- —
Personal DTI + credit; lowest rate.
DSCR
20% down · 8.5% · 30yr
- Down + closing
- —
- Monthly P&I
- —
- Monthly cashflow
- —
- DSCR
- —
- Eligible?
- —
No personal income docs; deal must DSCR.
Hard money
10% down · 12.0% · 12mo
- Down + closing
- —
- Monthly P&I
- —
- Monthly cashflow
- —
- DSCR
- —
- Eligible?
- —
Short-term bridge; refi at stabilization.
Rent comps 24 comps
| Address | Beds | Baths | Sqft | Rent | $/sqft | DOM | Units | Dist |
|---|---|---|---|---|---|---|---|---|
| 8508 SW 16th Ct Davie, FL | 3.0 | 2.0 | 613 | $1,700 | $2.77 | 13d | 1 | 0.22mi |
| 8717 SW 16th Pl Davie, FL | 1.0 | 1.0 | 600 | $1,300 | $2.17 | 3d | 1 | 0.24mi |
| 8717 SW 16th Pl Davie, FL | 1.0 | 1.0 | 600 | $1,500 | $2.50 | 22d | 1 | 0.24mi |
| 1244 S Pine Island Rd Plantation, FL | 1.0–3.0 | 1.0–2.0 | 1057 | $2,606 | $2.47 | 2d | 36 | 0.55mi |
| 9460 Tangerine Pl Davie, FL | 1.0–3.0 | 1.0–2.0 | 865 | $2,400 | $2.77 | 2d | 3 | 0.59mi |
| 8101 SW 24th Ct Davie, FL | 1.0–2.0 | 1.5–2.0 | 881 | $2,300 | $2.61 | 15d | 4 | 0.68mi |
| 2430 SW 81st Ave #305 Davie, FL | 1.0 | 1.5 | 741 | $1,700 | $2.29 | 24d | 1 | 0.73mi |
| 2495 SW 82nd Ave #304 Davie, FL | 1.0 | 1.5 | 727 | $1,600 | $2.20 | 7d | 1 | 0.74mi |
| 1650 SW 78th Ave Plantation, FL | 1.0–3.0 | 1.0–2.0 | 1040 | $2,664 | $2.56 | 2d | 33 | 0.79mi |
| 9441 Live Oak Pl #307 Davie, FL | 1.0 | 1.0 | 654 | $1,700 | $2.60 | 24d | 1 | 0.83mi |
| 9441 Evergreen Pl #206 Davie, FL | 1.0 | 1.0 | 700 | $1,900 | $2.71 | 2d | 1 | 0.86mi |
| 2571 SW 79th Ave Davie, FL | 1.0 | 1.0 | 609 | $1,771 | $2.91 | 1d | 4 | 0.87mi |
| 8021 Peters Rd Plantation, FL | 1.0–3.0 | 1.0–2.0 | 1040 | $3,241 | $3.11 | 1d | 27 | 0.89mi |
| 9461 Evergreen Pl #306 Davie, FL | 1.0 | 1.0 | 690 | $1,650 | $2.39 | 24d | 1 | 0.90mi |
| 9050 Jacaranda Ln #8 Plantation, FL | 1.0 | 1.0 | 721 | $1,725 | $2.39 | 7d | 1 | 1.03mi |
| 9050 Jacaranda Ln #8 Plantation, FL | 1.0 | 1.0 | 721 | $1,725 | $2.39 | 24d | 1 | 1.03mi |
| 730 SW 78th Ave Plantation, FL | 1.0–2.0 | 1.0–2.0 | 1073 | $3,369 | $3.14 | 1d | 11 | 1.13mi |
| 700 SW 78th Ave Plantation, FL | 2.0 | 1.0–2.0 | 962 | $3,160 | $3.28 | 1d | 19 | 1.17mi |
| 2900 S University Dr Davie, FL | 1.0 | 1.0 | 607 | $1,900 | $3.13 | 24d | 2 | 1.20mi |
| 2900 S University Dr Davie, FL | 1.0 | 1.0 | 607 | $1,900 | $3.13 | 22d | 2 | 1.20mi |
| 2926 S University Dr #6205 Davie, FL | 1.0 | 1.0 | 565 | $1,800 | $3.19 | 3d | 1 | 1.24mi |
| 405 S Pine Island Rd Unit 308D Plantation, FL | 1.0 | 1.0 | 656 | $1,750 | $2.67 | 20d | 1 | 1.28mi |
| 405 S Pine Island Rd Unit 406D Plantation, FL | 1.0 | 1.0 | 656 | $1,800 | $2.74 | 7d | 1 | 1.28mi |
| 405 S Pine Island Rd Unit 308D Plantation, FL | 1.0 | 1.0 | 656 | $1,650 | $2.52 | 2d | 1 | 1.28mi |
HOA detail
- Monthly dues
- $129 · $1,548/yr
Listing history 16 events
-
2026-06-18days on market $149,900 Active 56 DOM
-
2026-06-17days on market $149,900 Active 55 DOM
-
2026-06-16days on market $149,900 Active 54 DOM
-
2026-06-15days on market $149,900 Active 53 DOM
-
2026-06-13days on market $149,900 Active 51 DOM
-
2026-06-09days on market $149,900 Active 47 DOM
-
2026-06-08days on market $149,900 Active 46 DOM
-
2026-06-07days on market $149,900 Active 45 DOM
-
2026-06-04days on market $149,900 Active 42 DOM
-
2026-06-03days on market $149,900 Active 41 DOM
-
2026-06-02days on market $149,900 Active 40 DOM
-
2026-06-01days on market $149,900 Active 39 DOM
-
2026-05-31days on market $149,900 Active 38 DOM
-
2025-02-10$149,900 Active
-
1991-11-05soldstatus $42,000
-
1984-06-01soldstatus $33,388
ⓘ Source: listings_history table (triggers on properties + properties_extension) + one-shot
backfill from property_details.listing_events for pre-trigger history.
Tax reassessment forecast FL · Resets to sale price
- Current annual tax
- $2,902 · $242/mo
- Projected year-2 tax
- $2,902 · $242/mo
- Expected delta
- $0/yr ($0/mo · -0.0%)
ⓘ Screening estimate from a state-policy table — verify with the county assessor before closing.
Climate risk First Street
- Flood 1/10 Low FEMA zone X (shaded) · 0% chance over 30 yrs
- Wildfire 1/10 Low
- Heat 10/10 Extreme 7 d/yr ≥105°F today · 27 d/yr by 30 yrs out
- Wind 10/10 Extreme 99% chance of damaging wind over 30 yrs
- Air quality 3/10 Moderate 2 unhealthy d/yr today · 3 by 30 yrs out
Nearby sold comps map
Loading sold comps map…
Walkable amenities ~0.75 mi
Loading nearby amenities…
Taxation est. · year 1
- Rental income
- $23,805
- − Mortgage interest
- −$8,397
- − Property taxes
- −$2,902
- − Insurance
- −$750
- − Repairs & maintenance
- −$1,904
- − Management
- −$1,904
- − HOA
- −$1,548
- − Depreciation
- −$4,361
- Taxable income
- $2,039
- Est. tax owed @ 24.0%
- −$489
- After-tax cash flow
- $3,684/yr
For passive investors: Depreciation is non-cash, so a rental often shows a tax loss while cash-flowing — sheltering income. Rental losses are passive: they offset passive income freely, and up to $25,000/yr can offset ordinary (W-2) income if you actively participate and your MAGI is under $100k (phasing out to $0 by $150k); unused losses carry forward. On sale, claimed depreciation is recaptured at up to 25%, and gains may owe capital-gains tax (a 1031 exchange can defer both). Figures are a year-1 estimate at your 24.0% rate — not tax advice; consult a CPA.
Schools (NCES district)
- District
- Broward
- NCES district ID
- 1200180
- Math proficiency
- 42% ▼ -18.00%
- Reading proficiency
- 53% ▼ -5.00%
- Median HH income
- $52,139
- Composite
- 40.88/100
- National rank
- #3621
- State rank
- #46 of 73 in FL
Livability — Davie
- Score
- 82/100
- State rank
- #68
- US rank
- #1159
Category grades
Schools grade is shown separately in the Schools card above.
Census & demographics
- Census place
- Davie, FL
- County
- Broward County · 1,963,430 people
- City population
- 111,690
- Metro
- Miami-Fort Lauderdale-Pompano Beach, FL
- Population (ZIP)
- 50,151
- Household income
- $85,000
- Rent vs Own
- Severe rent burden
- 2923.0
Population outlook (Broward County) Hauer SSP2
- Today (2025)
- 2,207,033 people
- By 2030
- 2,360,704 · +7.0%
- By 2040
- 2,661,208 · +20.6%
- By 2050
- 2,946,698 · +33.5%
- By 2075
- 3,602,273 · +63.2%
- By 2100
- 3,970,984 · +79.9%
Race, ethnicity, and origin ACS 2023
- Neighborhood character
- Diverse neighborhood (Simpson 0.69)
- Race & ethnicity
- White 42% Hispanic / Latino 31% Two or more races 20% Black 16% Asian 6%
- Hispanic origin (detail)
- Mexican 2% Puerto Rican 5% Cuban 4% Dominican 2%
- Common ancestry
- Romanian 3% Italian 3% Hispanic 3%
- Foreign-born
- 31% · Canada, Jamaica, China
- Languages at home
- 60% English-only · Spanish 26% Other Indo-European 4% French/Haitian/Cajun 3%
Political lean MEDSL · Broward
- 2024 margin
- D (+17.0) · D 58.0% · R 41.0%
- 2008→2024 swing
- -17.8pp toward R · 2008: 34.7pp · 2024: 17.0pp
- All cycles
- 2024: D+17.0 2020: D+29.8 2016: D+35.0 2012: D+34.9 2008: D+34.7
Not yet ingested
- Civics
- —
Market trends
- HPI YoY
- ▼ -160.16%
- Current HPI
- 317.8685
- Rent YoY
- ▲ 1.23%
- Metro
- Miami-Fort Lauderdale-Pompano Beach, FL
- State GDP YoY
- ▲ 3.28%
- F500 in state
- 36
Industry mix (Fortune 500 HQ in FL)
| Industry | F500 HQs | Revenue |
|---|---|---|
| Industrial Technology | 2 | $29B |
|
||
| Insurance | 2 | $17B |
|
||
| Retail | 1 | $60B |
|
||
| Technology Distribution | 1 | $58B |
|
||
| Homebuilding | 1 | $35B |
|
||
| Technology Manufacturing | 1 | $35B |
|
||
Price history
+349.0% since first listed3 events — show timeline
- 2025-02-10 Listed $149,900 Beaches MLS
- 1991-11-05 Sold (Public Records) $42,000 Public Records
- 1984-06-01 Sold (Public Records) $33,388 Public Records
Property tax history
+23.3%/yrLatest (2025): $2,902 · +276.9% YoY. Source: county tax records.
Cash-flow waterfall
monthlySold comps — $/sqft
last 12 mo · ≤1 miLoading sold comps…