 Multi-family
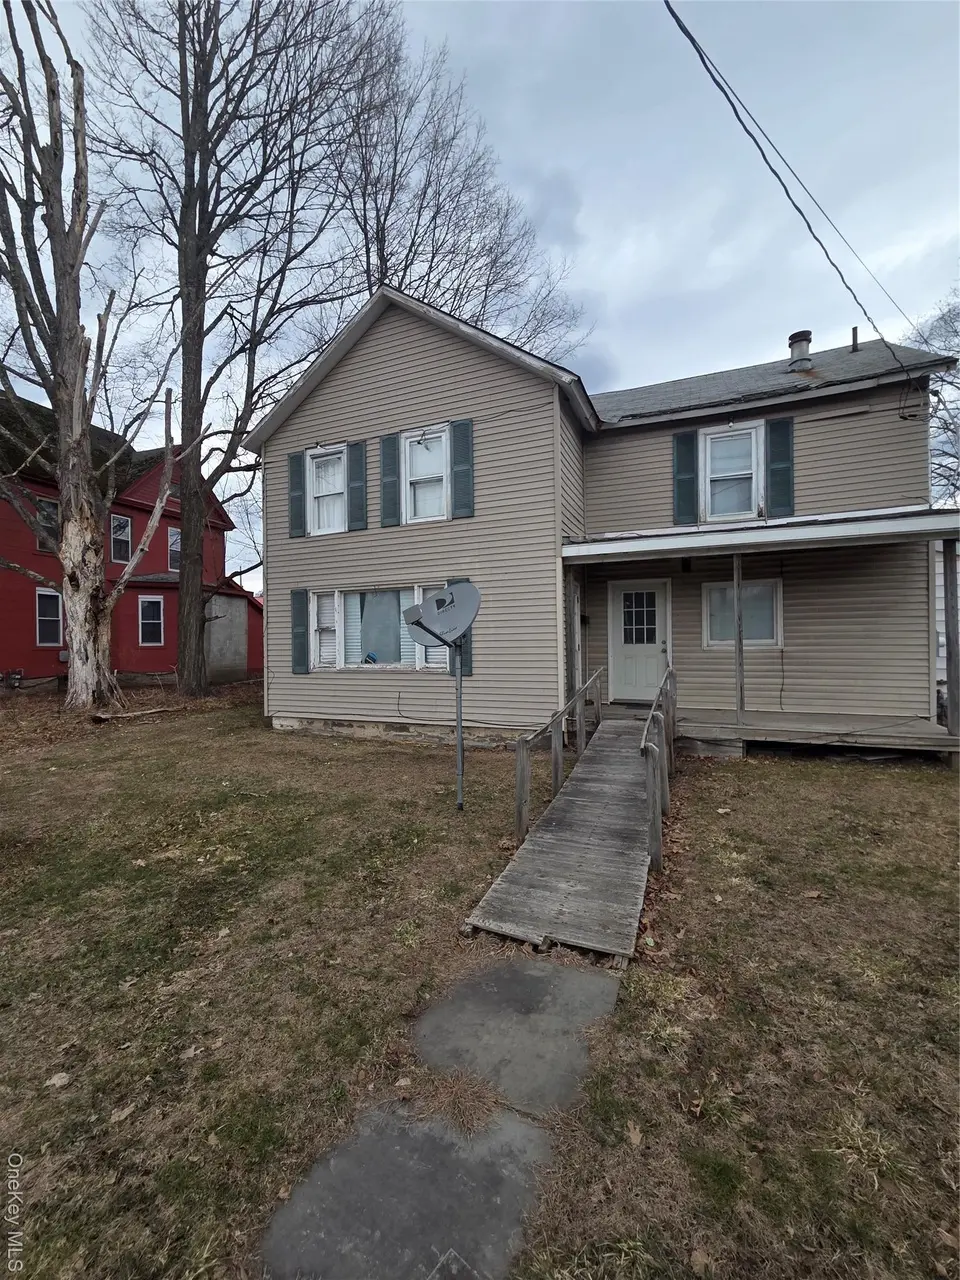
640 W Main St · Hancock, NY
Flood risk 9/10 · Severe
- FEMA flood zone
- X (shaded)
- Chance of flooding over 30 yrs
- 0.99%
- Est. flood insurance / yr
- $473 – $860
Fire risk 2/10 · Minimal
- Est. fire insurance / yr
- $691 – $1,283
Heat risk 3/10 · Minor
- Hot days now (above 92°F)
- 8 days/yr
- Hot days in 30 yrs
- 19 days/yr
Wind risk 2/10 · Minimal
- Chance of severe wind over 30 yrs
- 1.0%
Air-quality risk 2/10 · Minimal
- Unhealthy air days now
- 0 days/yr
- Unhealthy air days in 30 yrs
- 1 days/yr
Risk factors via First Street. Map © Google.
Why this score? — see what drove the A grade
The composite is a weighted blend of 9 inputs, each scored 0–100. Each bar is that input's sub-score; the figure is the points it added to the 100-point composite (weight × sub-score).
- Cash flow +30.0/30.0
- ARV discount +15.0/15.0
- 1% rule +10.0/10.0
- DSCR +10.0/10.0
- Appreciation +10.0/10.0
- Schools +3.6/10.0
- Livability +3.5/5.0
- Rent growth +2.5/5.0
- Condition / age +2.5/5.0
$125,000
🖨 Deal sheet 📄 Offer letter ✓ Due diligence
Multi-family units
County records classify this as Multi-Family (2-4 Unit). Listing-text estimate: 1 unit. estimate disagrees with records
Listing remarks MLS
Spring is ready to bloom and so is this property. Located in the Village of Hancock, this Main Street property is situated in a small historic community famous for fishing, kayaking and hiking. Right off Route 17. The town as well as the property has a vintage look and feel. Some updates made, just need a bit of elbow grease to give it that finished antique shine. The best part of all, you get two for the price of one! Two separate floors and entrances. Live in one floor and rent out the other or occupy the entire home. Perfect primary, vacation or investment property ready for the taking!
Key facts
- 0.5 acre lot
- Built 1930
- Listed 63 days
Neighborhood map
What this means for you Summary
Snapshot
- This is a 4-bed/2.0-bath multifamily listed at $125k.
Deal economics
- At list price, monthly cash flow is $2k ($18k/yr) — positive.
- The deal already cash-flows at list — no discount required.
- Meets the 1% rule at list price ($3k rent vs $125k).
- Recommended offer: $118k (6.0% below list) — sets the bar for market timing.
- Cap rate 21.3% vs local median 2.4% in Hancock — top-decile yield for the area; either an underpriced asset or a hidden risk that comps aren't pricing in. Stress-test before assuming the spread holds.
Location & tenants
- Location reads 70/100 on livability (#454 in NY) — a middle-class / working-renter tenant base. Strengths: cost of living A+, housing A, crime A-; Watch: schools D+, amenities D, commute F.
- Hancock Central School District (rural): math 40% / reading 40% proficiency, ranked #649 of 755 in NY (top 86%) — families likely to look elsewhere, expect single-tenant / working-renter base with shorter leases.
- Market conditions: 57 active listings in the ZIP; 66 units permitted in Delaware County in 2024 (0 in 5+ unit buildings).
Forward outlook
- In year one you build about $13k of equity ($864 loan paydown + $12k appreciation (10.0% local appreciation)).
- Delaware County population projected at -27% by 2050 — secular population decline; favor cash flow + early exit over multi-decade hold.
- At projected returns (10.0% appreciation + 3.0% rent growth), your $35k cash investment doubles in ~2 years — after that, you're playing with house money.
- By year 3, paydown + projected appreciation supports a ~$34k cash-out refi (75% LTV) — recoverable capital for the next deal without selling this one.
Negotiation context
- It's been on market 64 days — a 6% lower offer ($118k) is reasonable based on typical stale-listing flexibility.
- 5 sale attempts since 11y ago with the ask held roughly flat each time — persistent listings suggest the price (not the market) is what's stuck; bring a comps-based counter.
- Current owner paid $44k; list at $125k implies a 184% gain — meaningful room to come down on a strong offer.
Risks & watch-outs
- Watch-outs: property tax is 2.5% of price; flood insurance adds $56/mo; built in 1930 — expect roof / HVAC / electrical / plumbing capex.
- Climate carrying-cost: severe flood risk — expect insurance premiums to compound above CPI over the hold.
Questions for the listing agent
- It's been on market 64 days. Have you received any prior offers? Is the seller open to a 6% concession, seller financing, or rate buy-down credit?
- Built in 1930 — when were the roof, HVAC, electrical panel, plumbing, and water heater last replaced?
- Property tax is high relative to price — has the assessment been appealed recently, and will the sale trigger a re-assessment?
- What's the actual annual flood-insurance premium (NFIP or private), and is the property in a SFHA with mandatory coverage?
- Why hasn't it sold? Are there any deal-killer items the seller is aware of (foundation, flood, title, zoning, code violations)?
- Is there a deadline driving the sale (1031 exchange, divorce, estate, relocation)? That informs how much negotiation room exists.
- Schools are D-rated, which usually means shorter tenancies and higher turnover. Who's the typical renter profile here, and what's been the actual vacancy rate?
- What's the average days-on-market for RENTAL listings here right now (not sales)? A rising rental-DOM trend means longer vacancies and softer asking-rent achievability than the comps imply.
- What's the recent tenant-quality profile in this submarket — average credit score on applications, eviction rate, late-payment / NSF rate, and stable-employment percentage? A property-management company in the area should have these aggregated.
- How much new apartment / multifamily construction is in the pipeline within 1–3 miles? Heavy new supply (>2% of stock underway) typically softens rents 12–24 months out; light construction supports rent growth.
Investment metrics
- 1% rule
- 2.56% ✓
- Cap rate
- 21.26%
- Cash-on-cash
- 53.47%
- DSCR
- 3.38
- GRM
- 3.3
CMA / ARV
- ARV (median comp)
- $192,725
- List price
- $125,000
- Delta
- -35.14%
- Verdict
- UNDERPRICED
- Comps
- 3 within 1.0 mi
Show comp detail 1 sale within ~0.75 mi
| Address | Dist | Beds/Ba | Sqft | Sold | Price | $/sf | Match |
|---|---|---|---|---|---|---|---|
| 102 Mill St | 0.67mi | 4/4.0 | 1,800 (+6%) | 22mo | $167,500 | $93 | 33 |
Match score weights: distance 35% · size 25% · config 20% · recency 20%. Top-matched comps best support the ARV.
Projected returns pro-forma
10.0% appreciation · 3.0% rent growth · sell at horizon
- IRR
- 65.0%
- Equity multiple
- 5.69×
- Total profit
- $164,019
- Equity at exit
- $112,610
- IRR
- 58.6%
- Equity multiple
- 12.66×
- Total profit
- $407,968
- Equity at exit
- $242,848
Cash invested: $35,000 (down + closing). Projections, not guarantees.
Landlord ↔ Tenant lean methodology
- Overall (STATE)
- 15 Strongly Tenant-Friendly
- State New York
- 15 Strongly Tenant-Friendly · D+10
- County
- — inherits STATE
- City
- — inherits STATE
ZIP-level market 13783
- Home prices YoY
- 2.9%
- Active inventory
- 57
- Price-to-rent
- 6.5×
Monthly cashflow live
- Estimated rent
- $3,200 medium interval (Pro) →
- Mortgage (P&I)
- −$656
- Tax from tax record
- −$261 /mo · $3,130/yr
- Insurance
- −$52
- Flood insurance flood zone
- −$56 /mo · $666/yr
- HOA
- −$0
- Vacancy / Maint / Mgmt
- −$672
- Net cashflow
- $1,504
Break-even live
2-unit breakdown (identical units grouped — click to expand)
| Units | Beds | Baths | Est. rent |
|---|---|---|---|
| 2× units | 2 | 1 | $3,200 |
| #1 | 2 | 1 | $1,600 |
| #2 | 2 | 1 | $1,600 |
| Total (2 units) | $3,200 | ||
UW: 25.0% down · 7.5% · 30yr · 1.5% tax · 5.0% vac · 8.0% maint · 8.0% mgmt
Financing live
Cash to close
- Down payment
- $31,250
- Closing costs
- $3,750
- Reserves months
- —
- Total cash needed
- —
Loan-product check · same deal, 3 products live
Conventional
25% down · 7.5% · 30yr
- Down + closing
- —
- Monthly P&I
- —
- Monthly cashflow
- —
- DSCR
- —
- Eligible?
- —
Personal DTI + credit; lowest rate.
DSCR
20% down · 8.5% · 30yr
- Down + closing
- —
- Monthly P&I
- —
- Monthly cashflow
- —
- DSCR
- —
- Eligible?
- —
No personal income docs; deal must DSCR.
Hard money
10% down · 12.0% · 12mo
- Down + closing
- —
- Monthly P&I
- —
- Monthly cashflow
- —
- DSCR
- —
- Eligible?
- —
Short-term bridge; refi at stabilization.
Listing history 17 events
-
2026-06-01days on market $125,000 Active 64 DOM
-
2026-05-31days on market $125,000 Active 63 DOM
-
2026-03-30$125,000 Active 597-char remark
Show marketing remark (597 chars)
Spring is ready to bloom and so is this property. Located in the Village of Hancock, this Main Street property is situated in a small historic community famous for fishing, kayaking and hiking. Right off Route 17. The town as well as the property has a vintage look and feel. Some updates made, just need a bit of elbow grease to give it that finished antique shine. The best part of all, you get two for the price of one! Two separate floors and entrances. Live in one floor and rent out the other or occupy the entire home. Perfect primary, vacation or investment property ready for the taking!
-
2026-03-16historical $125,000 597-char remark
Show marketing remark (597 chars)
Spring is ready to bloom and so is this property. Located in the Village of Hancock, this Main Street property is situated in a small historic community famous for fishing, kayaking and hiking. Right off Route 17. The town as well as the property has a vintage look and feel. Some updates made, just need a bit of elbow grease to give it that finished antique shine. The best part of all, you get two for the price of one! Two separate floors and entrances. Live in one floor and rent out the other or occupy the entire home. Perfect primary, vacation or investment property ready for the taking!
-
2021-04-02soldstatus $44,000
-
2021-03-22soldstatus $44,000 233-char remark
Show marketing remark (233 chars)
This 2 unit, multi family home sits at the West end of the Village of Hancock. Fully renovated, hardwood floors throughout and covered front porch. Income producing (fully rented). Close to all amenities - call todayOWNER IS RE AGENT
-
2021-03-22soldstatus
Show marketing remark (233 chars)
This 2 unit, multi family home sits at the West end of the Village of Hancock. Fully renovated, hardwood floors throughout and covered front porch. Income producing (fully rented). Close to all amenities - call todayOWNER IS RE AGENT
-
2019-11-15$44,000 233-char remark
Show marketing remark (233 chars)
This 2 unit, multi family home sits at the West end of the Village of Hancock. Fully renovated, hardwood floors throughout and covered front porch. Income producing (fully rented). Close to all amenities - call todayOWNER IS RE AGENT
-
2019-11-15$44,000
Show marketing remark (233 chars)
This 2 unit, multi family home sits at the West end of the Village of Hancock. Fully renovated, hardwood floors throughout and covered front porch. Income producing (fully rented). Close to all amenities - call todayOWNER IS RE AGENT
-
2015-11-19soldstatus $35,000
-
2015-11-11soldstatus $35,000
-
2015-11-11soldstatus $35,000
-
2015-08-20$39,000
-
2015-08-20$39,000
-
2007-10-19soldstatus $55,000
-
2007-01-09soldstatus $45,000
-
1999-10-08soldstatus $22,000
ⓘ Source: listings_history table (triggers on properties + properties_extension) + one-shot
backfill from property_details.listing_events for pre-trigger history.
Tax reassessment forecast NY · Partial reset (capped growth)
- Current annual tax
- $3,130 · $261/mo
- Projected year-2 tax
- $3,130 · $261/mo
- Expected delta
- $0/yr ($0/mo · 0.0%)
ⓘ Screening estimate from a state-policy table — verify with the county assessor before closing.
Climate risk First Street
- Flood 9/10 Extreme FEMA zone X (shaded) · 99% chance over 30 yrs
- Wildfire 2/10 Low
- Heat 3/10 Moderate 8 d/yr ≥92°F today · 19 d/yr by 30 yrs out
- Wind 2/10 Low 100% chance of damaging wind over 30 yrs
- Air quality 2/10 Low 0 unhealthy d/yr today · 1 by 30 yrs out
Nearby sold comps map
Loading sold comps map…
Walkable amenities ~0.75 mi
Loading nearby amenities…
Taxation est. · year 1
- Rental income
- $38,400
- − Mortgage interest
- −$7,002
- − Property taxes
- −$3,130
- − Insurance
- −$1,292
- − Repairs & maintenance
- −$3,072
- − Management
- −$3,072
- − Depreciation
- −$3,636
- Taxable income
- $17,196
- Est. tax owed @ 24.0%
- −$4,127
- After-tax cash flow
- $13,921/yr
For passive investors: Depreciation is non-cash, so a rental often shows a tax loss while cash-flowing — sheltering income. Rental losses are passive: they offset passive income freely, and up to $25,000/yr can offset ordinary (W-2) income if you actively participate and your MAGI is under $100k (phasing out to $0 by $150k); unused losses carry forward. On sale, claimed depreciation is recaptured at up to 25%, and gains may owe capital-gains tax (a 1031 exchange can defer both). Figures are a year-1 estimate at your 24.0% rate — not tax advice; consult a CPA.
Schools (NCES district)
- District
- Hancock Central School District
- NCES district ID
- 3613560
- Math proficiency
- 40% ▬ 0.00%
- Reading proficiency
- 40% ▼ -10.00%
- Median HH income
- $40,208
- Composite
- 35.99/100
- National rank
- #9539
- State rank
- #649 of 755 in NY
Livability — Hancock
- Score
- 70/100
- State rank
- #454
- US rank
- #7935
Category grades
Schools grade is shown separately in the Schools card above.
Census & demographics
- Census place
- Hancock, NY
- Population (ZIP)
- 2,200
Population outlook (Delaware County) Hauer SSP2
- Today (2025)
- 42,668 people
- By 2030
- 40,337 · -5.5%
- By 2040
- 35,514 · -16.8%
- By 2050
- 31,265 · -26.7%
- By 2075
- 24,455 · -42.7%
- By 2100
- 19,529 · -54.2%
Race, ethnicity, and origin ACS 2023
- Neighborhood character
- Predominantly White (91%)
- Race & ethnicity
- White 91% Hispanic / Latino 4% Asian 3% Two or more races 2% Black 1%
- Common ancestry
- Romanian 6% Serbian 3% Lithuanian 2%
- Foreign-born
- 9% · Canada
- Languages at home
- 97% English-only · Other Indo-European 2% Spanish 1% German/W. Germanic 1%
Political lean MEDSL · Delaware
- 2024 margin
- R (+19.8) · D 40.1% · R 59.9%
- 2008→2024 swing
- -14.6pp toward R · 2008: -5.2pp · 2024: -19.8pp
- All cycles
- 2024: R+19.8 2020: R+18.4 2016: R+29.2 2012: R+9.6 2008: R+5.2
Not yet ingested
- Civics
- —
Market trends
- HPI YoY
- ▲ 13.62%
- Current HPI
- 484.0977
- Rent YoY
- —
- Metro
- —
- State GDP YoY
- ▲ 2.60%
- F500 in state
- 92
Industry mix (Fortune 500 HQ in NY)
| Industry | F500 HQs | Revenue |
|---|---|---|
| Financial Services | 10 | $950B |
|
||
| Consumer Goods | 9 | $162B |
|
||
| Insurance | 4 | $225B |
|
||
| Telecommunications | 2 | $144B |
|
||
| Pharmaceuticals | 2 | $112B |
|
||
| Media / Entertainment | 2 | $69B |
|
||
Price history
+468.2% since first listed15 events — show timeline
- 2026-03-30 Listed $125,000 OneKey® MLS as Distributed by MLS Grid
- 2026-03-16 Coming Soon $125,000 OneKey® MLS as Distributed by MLS Grid
- 2021-04-02 Sold (Public Records) $44,000 Public Records
- 2021-03-22 Sold (MLS) — PWMLS
- 2021-03-22 Sold (MLS) $44,000 PWMLS
- 2019-11-15 Listed $44,000 PWMLS
- 2019-11-15 Listed $44,000 PWMLS
- 2015-11-19 Sold (Public Records) $35,000 Public Records
- 2015-11-11 Sold (MLS) $35,000 PWMLS
- 2015-11-11 Sold (MLS) $35,000 PWMLS
- 2015-08-20 Listed $39,000 PWMLS
- 2015-08-20 Listed $39,000 PWMLS
- 2007-10-19 Sold (Public Records) $55,000 Public Records
- 2007-01-09 Sold (Public Records) $45,000 Public Records
- 1999-10-08 Sold (Public Records) $22,000 Public Records
Property tax history
+1.8%/yrLatest (2025): $3,130 · +2.8% YoY. Source: county tax records.
Cash-flow waterfall
monthlySold comps — $/sqft
last 12 mo · ≤1 miLoading sold comps…