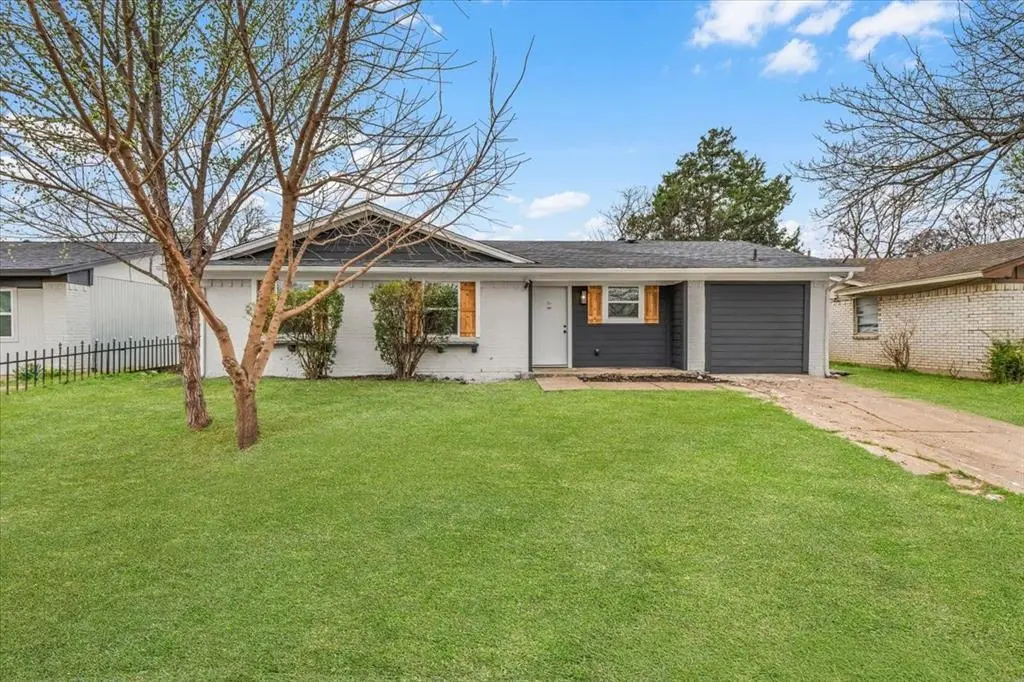
6415 Cinnamon Oaks Dr · Dallas, TX
Flood risk 1/10 · Minimal
- FEMA flood zone
- X (unshaded)
- Chance of flooding over 30 yrs
- 0.0%
- Est. flood insurance / yr
- $507 – $1,088
Fire risk 3/10 · Minor
- Est. fire insurance / yr
- $1,222 – $2,270
Heat risk 7/10 · Major
- Hot days now (above 110°F)
- 7 days/yr
- Hot days in 30 yrs
- 24 days/yr
Wind risk 6/10 · Moderate
- Chance of severe wind over 30 yrs
- 27.0%
Air-quality risk 2/10 · Minimal
- Unhealthy air days now
- 1 days/yr
- Unhealthy air days in 30 yrs
- 2 days/yr
Risk factors via First Street. Map © Google.
Why this score? — see what drove the F grade
The composite is a weighted blend of 9 inputs, each scored 0–100. Each bar is that input's sub-score; the figure is the points it added to the 100-point composite (weight × sub-score).
- Cash flow +8.2/30.0
- Livability +4.0/5.0
- 1% rule +3.0/10.0
- Schools +2.8/10.0
- Condition / age +2.5/5.0
- DSCR +2.2/10.0
- Rent growth +1.8/5.0
- ARV discount +0.0/15.0
- Appreciation +0.0/10.0
$220,000
🖨 Deal sheet 📄 Offer letter ✓ Due diligence
Listing remarks MLS
Investors and Do-It-Yourselfers, here's a 3-1-1 for your next project. Needs work, being offered as-is, seller to make no repairs. No blind offers, please.
Key facts
- Fully renovated
- Updated flooring
- Move in ready
Tags
Property features AI
Finance
- Other: Builder special listing condition
- Financial info: Treat as clear loan type; No second mortgage
- HOA & community: No association (no HOA)
Exterior
- Parking: Driveway parking
- Utilities: City water; Co-op electric; Not in a municipal utility district
- Home design: Single family residence; Residential property; One level; Built in 1972
- Construction: Year built 1972
- Exterior features: Lot under 0.5 acre; Approximately 0.16 acres; Subdivision: Highland Hills West
Interior
- Kitchen: No appliances included
- Bedrooms: 4 bedrooms (primary bedroom on main level)
- Bathrooms: 2 full bathrooms
- Interior features: Open floorplan; Kitchen island; Chandelier; Decorative lighting; One living area; One dining area; Room count includes 2 main rooms
- Laundry & utility: No washer/dryer listed
Neighborhood map
What this means for you Summary
Snapshot
- This is a 3-bed/1.0-bath single-family listed at $220k.
Deal economics
- At list price, monthly cash flow is $-210 ($-3k/yr) — negative.
- To cash-flow at today's rent, offer at most $183k (16.8% below list).
- To meet the 1% rule (rent ≥ 1% of price), the offer needs to be $175k (20.4% below list).
- Recommended offer: $175k (20.4% below list) — sets the bar for 1% rule.
- Cap rate 5.2% vs local median 2.3% in Dallas — top-decile yield for the area; either an underpriced asset or a hidden risk that comps aren't pricing in. Stress-test before assuming the spread holds.
Location & tenants
- Location reads 81/100 on livability (#24 in TX, #1,380 nationally) — a professional / high-income tenant draw. Strengths: amenities A+, commute A+, housing A+; Watch: crime F.
- Dallas ISD (urban): math 31% / reading 36% proficiency, ranked #559 of 826 in TX (top 68%) — families likely to look elsewhere, expect single-tenant / working-renter base with shorter leases; 83% free/reduced lunch — lower-income household profile, screen leases tightly.
- Zoned schools: J N Ervin El (math 17% / reading 20%, grade F, #3,759 of 4,322 statewide, top 88%, 646 students, 98% FRL).
- Zoned-school proficiency averages 18% at this address vs 34% district-wide (-15 pts) — the specific schools serving this property underperform the Dallas ISD average; the district grade overstates school quality for this exact location.
- Market conditions: Rents soft (-2.8%/yr); 207 active listings in the ZIP; 10 comparable units currently listed for rent nearby; rentals leasing fast (median 8d on market — plan ~1-2 weeks tenant-placement turnaround); 12,577 units permitted in Dallas County in 2024 (6,829 in 5+ unit buildings).
- This rent runs 39% of the median local income ($54k/yr) — at the standard rent-burdened threshold; future hikes will face affordability resistance.
Forward outlook
- Local home prices are declining (-3.0%/yr); year-one equity from $2k of loan paydown is wiped out by about $7k of value loss. Plan a longer hold.
- Dallas County population projected at +35% by 2050 — long-run rental-demand tailwind backs the buy-and-hold thesis.
Negotiation context
- It's been on market 33 days — a 3% lower offer ($213k) is reasonable based on typical stale-listing flexibility.
- 3 sale attempts; this cycle's ask has dropped $20k (8%) from the opening price — seller is motivated, your offer sets the floor, not the list.
Risks & watch-outs
- Climate carrying-cost: major wind risk, 27% chance of damaging wind over 30y; extreme-heat days projected 7→24/yr by 2055 (HVAC capex compounding) — expect insurance premiums to compound above CPI over the hold.
Questions for the listing agent
- What do current leases actually rent for vs. the listed asking? Can we see a recent rent roll and the last 12 months of T-12 income?
- It's been on market 33 days. Have you received any prior offers? Is the seller open to a 20% concession, seller financing, or rate buy-down credit?
- Built in 1972 — when were the roof, HVAC, electrical panel, plumbing, and water heater last replaced?
- Is there a deadline driving the sale (1031 exchange, divorce, estate, relocation)? That informs how much negotiation room exists.
- Crime grade is F in this area — have there been break-ins, vandalism, or insurance claims at this property in the last 3 years? What carrier currently insures it and at what premium?
- The area grade is low — what's the realistic commute time and amenity access for the typical tenant pool here? Any planned neighborhood developments (good or bad) we should know about?
- What's the average days-on-market for RENTAL listings here right now (not sales)? A rising rental-DOM trend means longer vacancies and softer asking-rent achievability than the comps imply.
- What's the recent tenant-quality profile in this submarket — average credit score on applications, eviction rate, late-payment / NSF rate, and stable-employment percentage? A property-management company in the area should have these aggregated.
- How much new for-sale + rental construction is in the pipeline within 1–3 miles? Heavy new supply typically softens prices + rents 12–24 months out; constrained supply supports both.
Investment metrics
- 1% rule
- 0.80% ✗
- Cap rate
- 5.15%
- Cash-on-cash
- -4.08%
- DSCR
- 0.82
- GRM
- 10.5
CMA / ARV
- ARV (on-the-fly)
- $183,933
- Comps found
- 12
Show comp detail 12 sales within ~0.75 mi
| Address | Dist | Beds/Ba | Sqft | Sold | Price | $/sf | Match |
|---|---|---|---|---|---|---|---|
| 6544 Cinnamon Oaks Dr | 0.16mi | 3/1.5 | 1,073 (+11%) | 2mo | $205,000 | $191 | 69 |
| 6341 Leaning Oaks St | 0.17mi | 3/1.5 | 1,042 (+8%) | 11mo | $189,900 | $182 | 67 |
| 3620 Pacesetter Dr | 0.58mi | 3/1.5 | 942 (-2%) | 5mo | $140,000 | $149 | 63 |
| 3503 Silverhill Dr | 0.40mi | 4/2.0 (+1) | 1,019 (+6%) | 1mo | $212,000 | $208 | 62 |
| 3554 Tioga St | 0.48mi | 3/1.0 | 903 (-6%) | 10mo | $195,000 | $216 | 59 |
| 6424 Teague Dr | 0.70mi | 3/1.0 | 912 (-5%) | 3mo | $125,000 | $137 | 56 |
| 2934 Morgan Dr | 0.59mi | 3/1.0 | 1,080 (+12%) | 1mo | $175,000 | $162 | 51 |
| 7831 San Jose Ave | 0.72mi | 3/2.0 | 1,004 (+4%) | 11mo | $225,000 | $224 | 46 |
| 2749 Morgan Dr | 0.72mi | 3/2.0 | 1,048 (+9%) | 6mo | $234,000 | $223 | 42 |
| 3707 Pacesetter Dr | 0.62mi | 3/1.5 | 1,100 (+14%) | 4mo | $139,900 | $127 | 42 |
| 3450 Pacesetter Dr | 0.36mi | 4/1.5 (+1) | 1,100 (+14%) | 13mo | $210,000 | $191 | 42 |
| 6624 Sebring Dr | 0.72mi | 3/1.5 | 1,083 (+12%) | 4mo | $215,000 | $199 | 40 |
Match score weights: distance 35% · size 25% · config 20% · recency 20%. Top-matched comps best support the ARV.
Projected returns pro-forma
-3.0% appreciation · 0.0% rent growth · sell at horizon
- IRR
- -26.7%
- Equity multiple
- 0.12×
- Total profit
- $-54,056
- Equity at exit
- $32,803
- IRR
- -40.2%
- Equity multiple
- -0.36×
- Total profit
- $-83,806
- Equity at exit
- $19,022
Cash invested: $61,600 (down + closing). Projections, not guarantees.
Landlord ↔ Tenant lean methodology
- Overall (STATE)
- 87 Strongly Landlord-Friendly
- State Texas
- 87 Strongly Landlord-Friendly · R+5
- County
- — inherits STATE
- City
- — inherits STATE
ZIP-level market 75241
- Home prices YoY
- -16.9%
- Rents YoY
- -2.8%
- Active inventory
- 207
- Price-to-rent
- 10.5×
Monthly cashflow live
- Estimated rent
- $1,752 high interval (Pro) →
- Mortgage (P&I)
- −$1,154
- Tax from tax record
- −$348 /mo · $4,179/yr
- Insurance
- −$92
- HOA
- −$0
- Vacancy / Maint / Mgmt
- −$368
- Net cashflow
- $-210
Break-even live
UW: 25.0% down · 7.5% · 30yr · 1.5% tax · 5.0% vac · 8.0% maint · 8.0% mgmt
Financing live
Cash to close
- Down payment
- $55,000
- Closing costs
- $6,600
- Reserves months
- —
- Total cash needed
- —
Loan-product check · same deal, 3 products live
Conventional
25% down · 7.5% · 30yr
- Down + closing
- —
- Monthly P&I
- —
- Monthly cashflow
- —
- DSCR
- —
- Eligible?
- —
Personal DTI + credit; lowest rate.
DSCR
20% down · 8.5% · 30yr
- Down + closing
- —
- Monthly P&I
- —
- Monthly cashflow
- —
- DSCR
- —
- Eligible?
- —
No personal income docs; deal must DSCR.
Hard money
10% down · 12.0% · 12mo
- Down + closing
- —
- Monthly P&I
- —
- Monthly cashflow
- —
- DSCR
- —
- Eligible?
- —
Short-term bridge; refi at stabilization.
Rent comps 10 comps
| Address | Beds | Baths | Sqft | Rent | $/sqft | DOM | Units | Dist |
|---|---|---|---|---|---|---|---|---|
| 3440 Simpson Stuart Rd Dallas, TX | 1.0–3.0 | 1.0–2.0 | 942 | $2,103 | $2.23 | 1d | 9 | 0.74mi |
| 3131 Simpson Stuart Rd Dallas, TX | 1.0–3.0 | 1.0–2.0 | 1024 | $1,694 | $1.65 | 3d | 33 | 0.75mi |
| 2525 Lyola St Dallas, TX | 3.0 | 2.0 | 1080 | $1,895 | $1.75 | 44d | 1 | 0.87mi |
| 5850 Highland Hills Dr Dallas, TX | 2.0–4.0 | 1.0–2.0 | 910 | $1,083 | $1.19 | 2d | 9 | 0.98mi |
| 5761 Highland Hills Dr Dallas, TX | 1.0–3.0 | 1.0–2.0 | 1040 | $1,749 | $1.68 | 3d | 7 | 0.99mi |
| 2529 Morgan Dr Dallas, TX | 2.0 | 1.0 | 842 | $1,650 | $1.96 | 24d | 1 | 1.01mi |
| 5821 Bonnie View Rd Dallas, TX | 1.0–3.0 | 1.0–2.0 | 820 | $1,101 | $1.34 | 7d | 7 | 1.17mi |
| 2111 Crouch Rd Dallas, TX | 1.0–2.0 | 1.0–2.0 | 866 | $1,277 | $1.47 | 6d | 1 | 1.24mi |
| 4140 Wilshire Blvd Dallas, TX | 3.0 | 2.0 | 1125 | $1,795 | $1.60 | 17d | 1 | 1.31mi |
| 3835 Basswood Dr Dallas, TX | 3.0 | 2.0 | 1000 | $1,625 | $1.62 | 24d | 1 | 1.44mi |
Listing history 16 events
-
2026-04-30status Pending
-
2026-04-29price $220,000
-
2026-04-15price $225,000
-
2026-04-09price $229,999
-
2026-04-02price $234,999
-
2026-03-28price $235,000
-
2026-03-28$240,000 Active
-
2026-03-26historical
-
2026-03-19price $240,000
-
2026-03-12price $245,000
-
2026-03-02$250,000 Active
-
2026-01-16soldstatus
-
2026-01-15soldstatus Closed 157-char remark
Show marketing remark (157 chars)
Investors and Do-It-Yourselfers, here's a 3-1-1 for your next project. Needs work, being offered as-is, seller to make no repairs. No blind offers, please.
-
2026-01-03status Pending 157-char remark
Show marketing remark (157 chars)
Investors and Do-It-Yourselfers, here's a 3-1-1 for your next project. Needs work, being offered as-is, seller to make no repairs. No blind offers, please.
-
2025-12-12$119,900 Active 157-char remark
Show marketing remark (157 chars)
Investors and Do-It-Yourselfers, here's a 3-1-1 for your next project. Needs work, being offered as-is, seller to make no repairs. No blind offers, please.
-
2025-11-13soldstatus
ⓘ Source: listings_history table (triggers on properties + properties_extension) + one-shot
backfill from property_details.listing_events for pre-trigger history.
Tax reassessment forecast TX · Resets to sale price
- Current annual tax
- $4,179 · $348/mo
- Projected year-2 tax
- $4,179 · $348/mo
- Expected delta
- $0/yr ($0/mo · 0.0%)
ⓘ Screening estimate from a state-policy table — verify with the county assessor before closing.
Climate risk First Street
- Flood 1/10 Low FEMA zone X (unshaded) · 0% chance over 30 yrs
- Wildfire 3/10 Moderate
- Heat 7/10 Severe 7 d/yr ≥110°F today · 24 d/yr by 30 yrs out
- Wind 6/10 Major 27% chance of damaging wind over 30 yrs
- Air quality 2/10 Low 1 unhealthy d/yr today · 2 by 30 yrs out
Nearby sold comps map
Loading sold comps map…
Walkable amenities ~0.75 mi
Loading nearby amenities…
Taxation est. · year 1
- Rental income
- $21,024
- − Mortgage interest
- −$12,323
- − Property taxes
- −$4,179
- − Insurance
- −$1,100
- − Repairs & maintenance
- −$1,682
- − Management
- −$1,682
- − Depreciation
- −$6,400
- Taxable loss
- −$6,342
- Est. tax savings @ 24.0%
- +$1,522
- After-tax cash flow
- $-992/yr
For passive investors: Depreciation is non-cash, so a rental often shows a tax loss while cash-flowing — sheltering income. Rental losses are passive: they offset passive income freely, and up to $25,000/yr can offset ordinary (W-2) income if you actively participate and your MAGI is under $100k (phasing out to $0 by $150k); unused losses carry forward. On sale, claimed depreciation is recaptured at up to 25%, and gains may owe capital-gains tax (a 1031 exchange can defer both). Figures are a year-1 estimate at your 24.0% rate — not tax advice; consult a CPA.
Schools (NCES district)
- District
- Dallas ISD
- NCES district ID
- 4816230
- Math proficiency
- 31% ▼ -16.00%
- Reading proficiency
- 36% ▼ -4.00%
- Median HH income
- $42,881
- Composite
- 28.41/100
- National rank
- #6763
- State rank
- #559 of 826 in TX
Livability — Dallas
- Score
- 81/100
- State rank
- #24
- US rank
- #1380
Category grades
Schools grade is shown separately in the Schools card above.
Census & demographics
- Census place
- Dallas, TX
- County
- Dallas County · 2,612,404 people
- City population
- 1,168,437
- Metro
- Dallas-Fort Worth-Arlington, TX
- Population (ZIP)
- 33,840
- Household income
- $53,998
- Rent vs Own
- Severe rent burden
- 1076.0
Population outlook (Dallas County) Hauer SSP2
- Today (2025)
- 2,979,839 people
- By 2030
- 3,191,823 · +7.1%
- By 2040
- 3,619,611 · +21.5%
- By 2050
- 4,026,915 · +35.1%
- By 2075
- 4,957,073 · +66.4%
- By 2100
- 5,508,725 · +84.9%
Race, ethnicity, and origin ACS 2023
- Neighborhood character
- Majority Black (62%)
- Race & ethnicity
- Black 62% Hispanic / Latino 30% Two or more races 8% White 5% Native American 2%
- Hispanic origin (detail)
- Mexican 24%
- Foreign-born
- 13% · Canada
- Languages at home
- 73% English-only · Spanish 25%
Political lean MEDSL · Dallas
- 2024 margin
- Strong D (+22.2) · D 60.2% · R 38.0% · Other 1.8%
- 2008→2024 swing
- +6.9pp toward D · 2008: 15.3pp · 2024: 22.2pp
- All cycles
- 2024: D+22.2 2020: D+31.6 2016: D+26.2 2012: D+15.4 2008: D+15.3
Not yet ingested
- Civics
- —
Market trends
- HPI YoY
- ▼ -72.36%
- Current HPI
- 356.2348
- Rent YoY
- ▼ -2.75%
- Metro
- Dallas-Fort Worth-Arlington, TX
- State GDP YoY
- ▲ 3.95%
- F500 in state
- 110
Industry mix (Fortune 500 HQ in TX)
| Industry | F500 HQs | Revenue |
|---|---|---|
| Energy | 16 | $1,198B |
|
||
| Technology | 5 | $198B |
|
||
| Engineering / Construction | 4 | $72B |
|
||
| Energy Services | 3 | $60B |
|
||
| Utilities | 3 | $41B |
|
||
| Healthcare | 2 | $330B |
|
||
Price history
+83.5% since first listed16 events — show timeline
- 2026-04-30 Pending — NTREIS
- 2026-04-29 Price Changed $220,000 NTREIS
- 2026-04-15 Price Changed $225,000 NTREIS
- 2026-04-09 Price Changed $229,999 NTREIS
- 2026-04-02 Price Changed $234,999 NTREIS
- 2026-03-28 Price Changed $235,000 NTREIS
- 2026-03-28 Listed $240,000 NTREIS
- 2026-03-26 Listing Removed — NTREIS
- 2026-03-19 Price Changed $240,000 NTREIS
- 2026-03-12 Price Changed $245,000 NTREIS
- 2026-03-02 Listed $250,000 NTREIS
- 2026-01-16 Sold (Public Records) — Public Records
- 2026-01-15 Sold (MLS) — NTREIS
- 2026-01-03 Pending — NTREIS
- 2025-12-12 Listed $119,900 NTREIS
- 2025-11-13 Sold (Public Records) — Public Records
Property tax history
+8.7%/yrLatest (2025): $4,179 · -0.4% YoY. Source: county tax records.
Cash-flow waterfall
monthlySold comps — $/sqft
last 12 mo · ≤1 miLoading sold comps…