200 E Ivanhoe St #69 · Chandler, AZ
Flood risk 1/10 · Minimal
- FEMA flood zone
- X (shaded)
- Chance of flooding over 30 yrs
- 0.0%
- Est. flood insurance / yr
- $507 – $1,088
Fire risk 1/10 · Minimal
- Est. fire insurance / yr
- $610 – $1,132
Heat risk 9/10 · Severe
- Hot days now (above 111°F)
- 7 days/yr
- Hot days in 30 yrs
- 19 days/yr
Wind risk 1/10 · Minimal
- Chance of severe wind over 30 yrs
- —
Air-quality risk 2/10 · Minimal
- Unhealthy air days now
- 0 days/yr
- Unhealthy air days in 30 yrs
- 1 days/yr
Risk factors via First Street. Map © Google.
Why this score? — see what drove the B+ grade
The composite is a weighted blend of 9 inputs, each scored 0–100. Each bar is that input's sub-score; the figure is the points it added to the 100-point composite (weight × sub-score).
- Cash flow +30.0/30.0
- ARV discount +13.8/15.0
- 1% rule +10.0/10.0
- DSCR +10.0/10.0
- Schools +4.8/10.0
- Livability +3.9/5.0
- Condition / age +2.2/5.0
- Rent growth +2.1/5.0
- Appreciation +0.0/10.0
$59,500
🖨 Deal sheet 📄 Offer letter ✓ Due diligence
Listing remarks
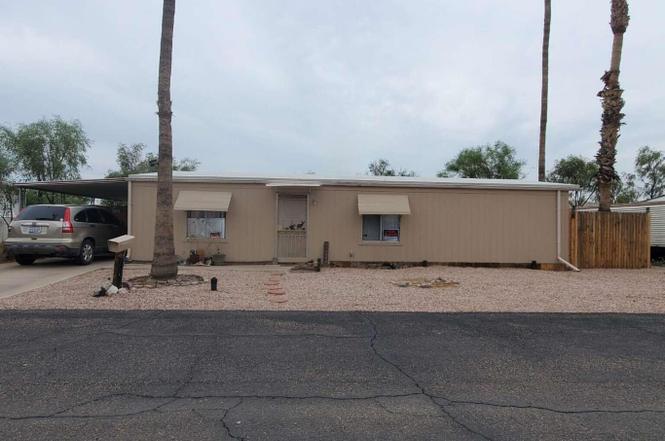
GROUND SET * * * 3 BEDROOM 2 BATHROOM 1983 FLAMINGO 24X48 DOUBLEWIDE, UPDATED IN 2021 WITH NEW FLOORING, PAINT INSIDE/OUTSIDE, NEWER WASHER/DRYER INSIDE, MASTER BATHROOM, 2ND BATHROOM READY FOR YOU TO CUSTOMIZE, MINI SPLIT HEATING/COOLING, 1 WINDOW AC UNIT, FENCED YARD/PET FRIENDLY, Can be used as a year-round primary residence or a seasonal ''snowbird'' home, or an investment property to rent. 2 CAR COVERED CARPORT 2 SHEDS. Welcome to Chandler Estates, a quaint ''55 or Better'' community that boasts year-round sunshine, just minutes from downtown Chandler, Arizona. Although surrounded by the hustle and bustle of the city, our community offers the seclusion and quiet of a desert resort, w
Key facts
- Fenced yard
- Investment property
- 3 parking spots
Tags
Property features AI
Finance
- HOA & community: Land lease: $1,200 monthly; No association fees included; Community pool; Community fitness center; Coin-operated laundry; Community media room; Biking/walking paths; Near bus stop
Exterior
- Parking: 2 covered parking spaces; 2 carport spaces; 1 open parking space
- Utilities: City water; Public sewer
- Home design: Manufactured/mobile home; Leasehold ownership; City and city lights view; Property listed as fixer
- Construction: Wood-frame construction; Painted exterior; Other roof (see remarks)
- Exterior features: Private street access; Private yard; On-site storage; Gravel/stone front yard; Gravel/stone backyard; Private maintained road
Interior
- Kitchen: Pantry; Refrigerator
- Bedrooms: Up to 3 bedrooms
- Flooring: Laminate; Vinyl; Wood; Other
- Bathrooms: 2 full bathrooms
- Heating & cooling: Mini-split heating and cooling; Natural gas heating; Ceiling fans; Window or wall AC units
- Interior features: High-speed internet; No interior steps; Vaulted ceilings; Pantry; Full bath in primary bedroom; Multiple entry/exit points; Lever door handles; Lever-style bath faucets
- Laundry & utility: Laundry inside
Neighborhood map
What this means for you Summary
Snapshot
- This is a 3-bed/2.0-bath manufactured listed at $60k. Condition is rated fair.
Deal economics
- At list price, monthly cash flow is $1k ($14k/yr) — positive.
- The deal already cash-flows at list — no discount required.
- Meets the 1% rule at list price ($2k rent vs $60k).
- Cap rate 29.2% vs local median 3.3% in Chandler — top-decile yield for the area; either an underpriced asset or a hidden risk that comps aren't pricing in. Stress-test before assuming the spread holds.
Location & tenants
- Location reads 78/100 on livability (#9 in AZ, #2,508 nationally) — a middle-class / working-renter tenant base. Strengths: employment A+, housing A+, crime A-; Watch: health & safety D, cost of living D-.
- Chandler Unified District #80 (4242) (suburban): math 49% / reading 57% proficiency, ranked #31 of 249 in AZ (top 12%) — acceptable for families but not a draw, mixed tenant base, ~2y average lease.
- Zoned schools: Galveston Elementary School (math 15% / reading 30%, grade F, #679 of 1,109 statewide, top 62%, 461 students, 87% FRL); Willis Junior High School (math 28% / reading 36%, grade F, #73 of 218 statewide, top 35%, 865 students, 55% FRL); Chandler High School (math 25% / reading 32%, grade F, #133 of 381 statewide, top 35%, 3,597 students, 46% FRL) — zoned schools average 63% FRL vs 25% district-wide (37 pts higher); higher-poverty schools than district average — tighter screening recommended.
- Zoned-school proficiency averages 28% at this address vs 53% district-wide (-25 pts) — the specific schools serving this property underperform the Chandler Unified District #80 (4242) average; the district grade overstates school quality for this exact location.
- Market conditions: Rents soft (-1.7%/yr); 182 active listings in the ZIP; 40 comparable units currently listed for rent nearby; rentals at typical pace (median 20d on market — plan ~3-4 weeks tenant-placement turnaround); solid renter incomes; 36,011 units permitted in Maricopa County in 2024 (12,801 in 5+ unit buildings).
Forward outlook
- Local home prices are declining (-3.0%/yr); year-one equity from $411 of loan paydown is wiped out by about $2k of value loss. Plan a longer hold.
- Maricopa County population projected at +38% by 2050 — long-run rental-demand tailwind backs the buy-and-hold thesis.
- At projected returns (-3.0% appreciation + 0.0% rent growth), your $17k cash investment doubles in ~2 years — after that, you're playing with house money.
Negotiation context
- Only 5 days on market — expect competitive offers; lowballing is unlikely to land.
Risks & watch-outs
- Climate carrying-cost: extreme-heat days projected 7→19/yr by 2055 (HVAC capex compounding) — expect insurance premiums to compound above CPI over the hold.
Questions for the listing agent
- Have any recent inspections been done? Can we get a copy of the seller's disclosures and any deferred-maintenance estimates?
- Is there a deadline driving the sale (1031 exchange, divorce, estate, relocation)? That informs how much negotiation room exists.
- Schools are B-rated — typically a magnet for longer-tenancy family renters. What's the average tenant stay here, and is there a school-zone premium baked into asking?
- What's the average days-on-market for RENTAL listings here right now (not sales)? A rising rental-DOM trend means longer vacancies and softer asking-rent achievability than the comps imply.
- What's the recent tenant-quality profile in this submarket — average credit score on applications, eviction rate, late-payment / NSF rate, and stable-employment percentage? A property-management company in the area should have these aggregated.
- How much new for-sale + rental construction is in the pipeline within 1–3 miles? Heavy new supply typically softens prices + rents 12–24 months out; constrained supply supports both.
Investment metrics
- 1% rule
- 3.29% ✓
- Cap rate
- 29.19%
- Cash-on-cash
- 81.78%
- DSCR
- 4.64
- GRM
- 2.5
CMA / ARV
- ARV (on-the-fly)
- $69,120
- Comps found
- 2
Show comp detail 2 sales within ~0.75 mi
| Address | Dist | Beds/Ba | Sqft | Sold | Price | $/sf | Match |
|---|---|---|---|---|---|---|---|
| 200 E Ivanhoe St #65 | 0.00mi | 2/2.0 (-1) | 1,072 (-7%) | 8mo | $25,000 | $23 | 77 |
| 200 E Knox Rd #104 | 0.74mi | 2/2.0 (-1) | 1,200 (+4%) | 4mo | $72,250 | $60 | 50 |
Match score weights: distance 35% · size 25% · config 20% · recency 20%. Top-matched comps best support the ARV.
Projected returns pro-forma
-3.0% appreciation · 0.0% rent growth · sell at horizon
- IRR
- 78.6%
- Equity multiple
- 4.42×
- Total profit
- $56,962
- Equity at exit
- $8,872
- IRR
- 81.4%
- Equity multiple
- 8.24×
- Total profit
- $120,662
- Equity at exit
- $5,144
Cash invested: $16,660 (down + closing). Projections, not guarantees.
Landlord ↔ Tenant lean methodology
- Overall (STATE)
- 87 Strongly Landlord-Friendly
- State Arizona
- 87 Strongly Landlord-Friendly · R+3
- County
- — inherits STATE
- City
- — inherits STATE
ZIP-level market 85225
- Home prices YoY
- -28.1%
- Rents YoY
- -1.7%
- Active inventory
- 182
- Price-to-rent
- 2.5×
Monthly cashflow live
- Estimated rent
- $1,958 high interval (Pro) →
- Mortgage (P&I)
- −$312
- Tax est. 1.5%
- −$74 /mo · $892/yr
- Insurance
- −$25
- HOA
- −$0
- Vacancy / Maint / Mgmt
- −$411
- Net cashflow
- $1,135
Break-even live
UW: 25.0% down · 7.5% · 30yr · 1.5% tax · 5.0% vac · 8.0% maint · 8.0% mgmt
Financing live
Cash to close
- Down payment
- $14,875
- Closing costs
- $1,785
- Reserves months
- —
- Total cash needed
- —
Loan-product check · same deal, 3 products live
Conventional
25% down · 7.5% · 30yr
- Down + closing
- —
- Monthly P&I
- —
- Monthly cashflow
- —
- DSCR
- —
- Eligible?
- —
Personal DTI + credit; lowest rate.
DSCR
20% down · 8.5% · 30yr
- Down + closing
- —
- Monthly P&I
- —
- Monthly cashflow
- —
- DSCR
- —
- Eligible?
- —
No personal income docs; deal must DSCR.
Hard money
10% down · 12.0% · 12mo
- Down + closing
- —
- Monthly P&I
- —
- Monthly cashflow
- —
- DSCR
- —
- Eligible?
- —
Short-term bridge; refi at stabilization.
Rent comps 40 comps
| Address | Beds | Baths | Sqft | Rent | $/sqft | DOM | Units | Dist |
|---|---|---|---|---|---|---|---|---|
| 235 E Ray Rd Chandler, AZ | 2.0–3.0 | 2.0 | 1031 | $1,904 | $1.85 | 1d | 9 | 0.22mi |
| 250 E Ray Rd Chandler, AZ | 1.0–3.0 | 1.0–2.0 | 1073 | $3,948 | $3.68 | 19d | 11 | 0.36mi |
| 250 E Ray Rd Chandler, AZ | 2.0 | 2.0 | 1156 | $2,080 | $1.80 | 5d | 1 | 0.36mi |
| 498 N Arizona Ave Unit 7 Chandler, AZ | 2.0 | 1.0 | 800 | $1,850 | $2.31 | 24d | 1 | 0.39mi |
| 498 N Arizona Ave Unit 7 Chandler, AZ | 2.0 | 1.0 | 800 | $1,900 | $2.38 | 43d | 1 | 0.39mi |
| 250 E Ray Rd Unit 2 Chandler, AZ | 2.0 | 2.0 | 1138 | $1,684 | $1.48 | 43d | 1 | 0.40mi |
| 501 E Ray Rd Lot 181 Chandler, AZ | 3.0 | 2.0 | 1344 | $2,099 | $1.56 | 43d | 1 | 0.42mi |
| 433 W Ray Rd Chandler, AZ | 2.0 | 1.0 | 770 | $1,000 | $1.30 | 43d | 1 | 0.42mi |
| 418 N Colorado St Chandler, AZ | 3.0 | 1.0 | 967 | $1,950 | $2.02 | 12d | 1 | 0.48mi |
| 418 N Colorado St Chandler, AZ | 3.0 | 1.0 | 964 | $1,950 | $2.02 | 24d | 1 | 0.48mi |
| 98 W Orchid Ln Unit 98-03 Chandler, AZ | 2.0 | 1.0 | 800 | $1,025 | $1.28 | 43d | 1 | 0.55mi |
| 337 N Colorado St Unit 100-102 Chandler, AZ | 2.0 | 2.0 | 900 | $2,250 | $2.50 | 43d | 1 | 0.59mi |
| 318 N Washington St Unit A Chandler, AZ | 2.0 | 1.0 | 800 | $1,675 | $2.09 | 43d | 1 | 0.59mi |
| 373 N Nevada St Unit LCAM373-375 Chandler, AZ | 2.0 | 1.0 | 750 | $1,300 | $1.73 | 18d | 1 | 0.60mi |
| 274 N Delaware St Unit B Chandler, AZ | 3.0 | 2.0 | 1269 | $2,450 | $1.93 | 24d | 1 | 0.68mi |
| 699 W Ray Rd #5 Chandler, AZ | 2.0 | 1.0 | 825 | $1,149 | $1.39 | 10d | 1 | 0.70mi |
| 774 E Carla Vista Dr Chandler, AZ | 3.0 | 2.0 | 1076 | $2,010 | $1.87 | 43d | 1 | 0.78mi |
| 760 N Evergreen St Chandler, AZ | 3.0 | 2.0 | 1219 | $2,100 | $1.72 | 12d | 1 | 0.78mi |
| 510 E Kent Ave Chandler, AZ | 3.0 | 2.0 | 1422 | $2,190 | $1.54 | 2d | 1 | 0.83mi |
| 741 E Erie St Unit 1 Chandler, AZ | 3.0 | 1.5 | 1348 | $1,650 | $1.22 | 5d | 1 | 0.83mi |
| 123 N Washington St #12 Chandler, AZ | 2.0 | 2.5 | 1330 | $2,099 | $1.58 | 15d | 1 | 0.84mi |
| 445 W Chandler Blvd Chandler, AZ | 1.0–2.0 | 1.0–2.0 | 955 | $2,341 | $2.45 | 1d | 19 | 0.85mi |
| 124 N California St #33 Chandler, AZ | 2.0 | 2.5 | 1283 | $1,995 | $1.55 | 12d | 1 | 0.87mi |
| 860 N McQueen Rd #1013 Chandler, AZ | 3.0 | 2.0 | 1261 | $1,875 | $1.49 | 5d | 1 | 0.90mi |
| 860 N McQueen Rd Chandler, AZ | 3.0 | 2.5 | 1242 | $1,900 | $1.53 | 24d | 1 | 0.90mi |
| 860 N McQueen Rd #1013 Chandler, AZ | 3.0 | 2.0 | 1261 | $1,795 | $1.42 | 17d | 1 | 0.90mi |
| 860 N McQueen Rd #1159 Chandler, AZ | 2.0 | 2.5 | 1249 | $2,100 | $1.68 | 24d | 1 | 0.90mi |
| 860 N McQueen Rd #1073 Chandler, AZ | 2.0 | 2.5 | 1122 | $1,799 | $1.60 | 12d | 1 | 0.90mi |
| 860 N McQueen Rd #1003 Chandler, AZ | 3.0 | 2.0 | 1261 | $3,300 | $2.62 | 43d | 1 | 0.90mi |
| 859 W Ray Rd Apt 3 Chandler, AZ | 2.0 | 1.0 | 832 | $1,050 | $1.26 | 3d | 1 | 0.97mi |
| 859 W Ray Rd Apt 2 Chandler, AZ | 2.0 | 1.0 | 832 | $1,125 | $1.35 | 18d | 1 | 0.97mi |
| 859 W Ray Rd Apt 3 Chandler, AZ | 2.0 | 1.0 | 832 | $1,225 | $1.47 | 5d | 1 | 0.97mi |
| 859 W Ray Rd Apt 2 Chandler, AZ | 2.0 | 1.0 | 832 | $1,125 | $1.35 | 21d | 1 | 0.97mi |
| 886 W Galveston St #131 Chandler, AZ | 2.0 | 2.0 | 1272 | $1,800 | $1.42 | 24d | 1 | 0.97mi |
| 777 W Chandler Blvd Chandler, AZ | 2.0 | 2.0 | 835 | $1,943 | $2.33 | 43d | 1 | 1.03mi |
| 777 W Chandler Blvd Chandler, AZ | 2.0 | 2.0 | 1149 | $2,034 | $1.77 | 18d | 1 | 1.03mi |
| 777 W Chandler Blvd Chandler, AZ | 3.0 | 2.0 | 1388 | $2,234 | $1.61 | 24d | 1 | 1.03mi |
| 777 W Chandler Blvd Chandler, AZ | 2.0 | 2.0 | 1026 | $2,021 | $1.97 | 15d | 1 | 1.03mi |
| 333 E Commonwealth Ave Chandler, AZ | 2.0 | 1.0–2.0 | 874 | $1,878 | $2.15 | 1d | 11 | 1.05mi |
| 1351 N Pleasant Dr #2092 Chandler, AZ | 2.0 | 2.0 | 1300 | $3,450 | $2.65 | 43d | 1 | 1.06mi |
Listing history 5 events
-
2026-06-18days on market $59,500 Active 5 DOM
-
2026-06-17days on market $59,500 Active 4 DOM
-
2026-06-16days on market $59,500 Active 3 DOM
-
2026-06-15remarks 699-char remark
-
2026-06-15$59,500 Active 2 DOM
ⓘ Source: listings_history table (triggers on properties + properties_extension) + one-shot
backfill from property_details.listing_events for pre-trigger history.
Climate risk First Street
- Flood 1/10 Low FEMA zone X (shaded) · 0% chance over 30 yrs
- Wildfire 1/10 Low
- Heat 9/10 Extreme 7 d/yr ≥111°F today · 19 d/yr by 30 yrs out
- Wind 1/10 Low
- Air quality 2/10 Low 0 unhealthy d/yr today · 1 by 30 yrs out
Nearby sold comps map
Loading sold comps map…
Walkable amenities ~0.75 mi
Loading nearby amenities…
Taxation est. · year 1
- Rental income
- $23,492
- − Mortgage interest
- −$3,333
- − Property taxes
- −$892
- − Insurance
- −$298
- − Repairs & maintenance
- −$1,879
- − Management
- −$1,879
- − Depreciation
- −$1,731
- Taxable income
- $13,479
- Est. tax owed @ 24.0%
- −$3,235
- After-tax cash flow
- $10,389/yr
For passive investors: Depreciation is non-cash, so a rental often shows a tax loss while cash-flowing — sheltering income. Rental losses are passive: they offset passive income freely, and up to $25,000/yr can offset ordinary (W-2) income if you actively participate and your MAGI is under $100k (phasing out to $0 by $150k); unused losses carry forward. On sale, claimed depreciation is recaptured at up to 25%, and gains may owe capital-gains tax (a 1031 exchange can defer both). Figures are a year-1 estimate at your 24.0% rate — not tax advice; consult a CPA.
Condition & rehab AI · 13 photos
The home is in fair condition with cosmetic repairs needed. Painting, new flooring, and landscaping would significantly increase its value.
Repairs flagged
- Minor Kitchen cabinets — Slight wear and tear, but not damaged.
- Minor Bathroom — Small repairs needed on the bathtub and toilet area.
- Minor Exterior siding — Aging appearance, but no major damage.
Value-add opportunities
- Resale Painting the exterior and interior — Fresh paint can significantly improve the home's curb appeal and value.
- Both New flooring — Replacing worn-out carpet with hardwood or tile can enhance both resale and rental value.
- Both Landscaping — Well-maintained landscaping can increase both the home's curb appeal and rental potential.
Renovation cost estimate screening
| Repair item | Severity | Est. cost |
|---|---|---|
| Kitchen cabinets · Slight wear and tear, but not damaged. | Minor | $500–3,000 |
| Bathroom · Small repairs needed on the bathtub and toilet area. | Minor | $500–3,000 |
| Exterior siding · Aging appearance, but no major damage. | Minor | $500–3,000 |
| Total estimated repair cost · 3 items | $1,500–9,000 |
Value-add ROI direction
- Resale Painting the exterior and interior — Fresh paint can significantly improve the home's curb appeal and value. ↑
- Both New flooring — Replacing worn-out carpet with hardwood or tile can enhance both resale and rental value. ↑
- Both Landscaping — Well-maintained landscaping can increase both the home's curb appeal and rental potential. ↑
ⓘ Cost ranges are severity-bucket heuristics (US national rule-of-thumb). Get contractor quotes + a written scope before underwriting a rehab budget.
Schools (NCES district)
- District
- Chandler Unified District #80 (4242)
- NCES district ID
- 0401870
- Math proficiency
- 49% ▼ -8.00%
- Reading proficiency
- 57% ▼ -2.00%
- Median HH income
- $74,048
- Composite
- 47.54/100
- National rank
- #2268
- State rank
- #31 of 249 in AZ
Livability — Chandler
- Score
- 78/100
- State rank
- #9
- US rank
- #2508
Category grades
Schools grade is shown separately in the Schools card above.
Census & demographics
- Census place
- Chandler, AZ
- County
- Maricopa County · 4,537,380 people
- City population
- 299,016
- Metro
- Phoenix-Mesa-Chandler, AZ
- Population (ZIP)
- 72,297
- Household income
- $88,676
- Rent vs Own
- Severe rent burden
- 2327.0
Population outlook (Maricopa County) Hauer SSP2
- Today (2025)
- 4,979,203 people
- By 2030
- 5,378,229 · +8.0%
- By 2040
- 6,156,598 · +23.6%
- By 2050
- 6,872,376 · +38.0%
- By 2075
- 8,401,270 · +68.7%
- By 2100
- 9,247,439 · +85.7%
Race, ethnicity, and origin ACS 2023
- Neighborhood character
- Diverse neighborhood (Simpson 0.65)
- Race & ethnicity
- White 48% Hispanic / Latino 34% Two or more races 16% Black 7% Asian 6% Native American 2%
- Hispanic origin (detail)
- Mexican 29% Puerto Rican 1%
- Common ancestry
- Romanian 2% Lithuanian 2% Portuguese 1%
- Foreign-born
- 16% · Canada, Vietnam, China
- Languages at home
- 72% English-only · Spanish 21% Vietnamese 1% Chinese 1%
Political lean MEDSL · Maricopa
- 2024 margin
- Toss-up / Even · D 47.7% · R 51.2% · Other 1.1%
- 2008→2024 swing
- +7.1pp toward D · 2008: -10.6pp · 2024: -3.5pp
- All cycles
- 2024: R+3.5 2020: D+2.2 2016: R+3.5 2012: R+12.0 2008: R+10.6
Not yet ingested
- Civics
- —
Market trends
- HPI YoY
- ▼ -128.25%
- Current HPI
- 328.8354
- Rent YoY
- ▼ -1.66%
- Metro
- Phoenix-Mesa-Chandler, AZ
- State GDP YoY
- ▲ 4.54%
- F500 in state
- 20
Industry mix (Fortune 500 HQ in AZ)
| Industry | F500 HQs | Revenue |
|---|---|---|
| Technology | 2 | $13B |
|
||
| Mining / Metals | 1 | $23B |
|
||
| Environmental Services | 1 | $16B |
|
||
| Metals / Steel | 1 | $14B |
|
||
| Technology Distribution | 1 | $9B |
|
||
| Homebuilding | 1 | $8B |
|
||
Price history
1 event — show timeline
- 2026-06-11 Listed $59,500 ARMLS
Cash-flow waterfall
monthlySold comps — $/sqft
last 12 mo · ≤1 miLoading sold comps…