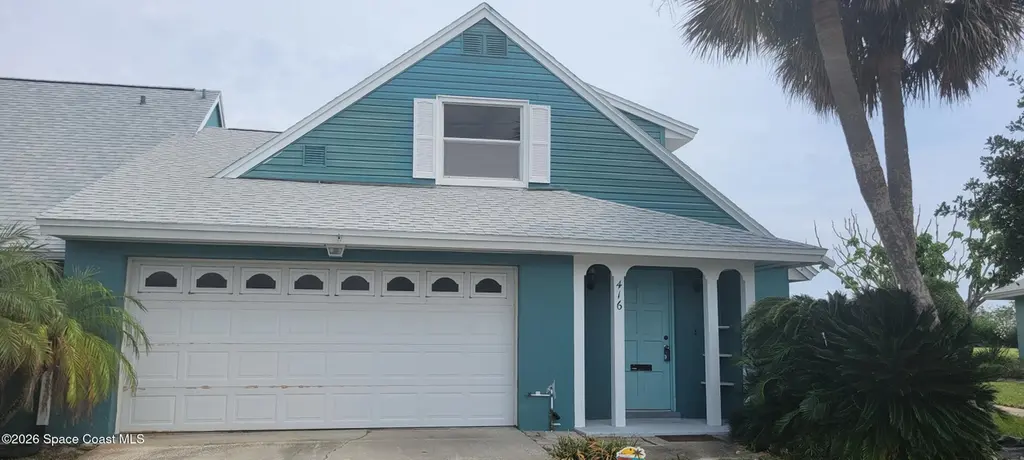
416 Emerald Dr S · Indian Harbour Beach, FL
Flood risk 6/10 · Moderate
- FEMA flood zone
- X (unshaded)
- Chance of flooding over 30 yrs
- 0.53%
- Est. flood insurance / yr
- $507 – $1,088
Fire risk 1/10 · Minimal
- Est. fire insurance / yr
- $947 – $1,759
Heat risk 10/10 · Severe
- Hot days now (above 103°F)
- 7 days/yr
- Hot days in 30 yrs
- 23 days/yr
Wind risk 10/10 · Severe
- Chance of severe wind over 30 yrs
- 99.0%
Air-quality risk 1/10 · Minimal
- Unhealthy air days now
- 0 days/yr
- Unhealthy air days in 30 yrs
- 0 days/yr
Risk factors via First Street. Map © Google.
Why this score? — see what drove the B grade
The composite is a weighted blend of 9 inputs, each scored 0–100. Each bar is that input's sub-score; the figure is the points it added to the 100-point composite (weight × sub-score).
- Cash flow +30.0/30.0
- DSCR +10.0/10.0
- 1% rule +9.5/10.0
- ARV discount +7.5/15.0
- Schools +4.7/10.0
- Livability +4.2/5.0
- Rent growth +2.9/5.0
- Condition / age +2.5/5.0
- Appreciation +0.0/10.0
$259,900
🖨 Deal sheet (PDF) 📄 Offer letter ✓ Due diligence
Listing remarks
Nice Townhome community situated in Indian Harbour Beach. This 3 bedroom 2 bathroom townhome has many updates to include new roof 2018, new AC and duct work 2025, new hot water heater 2025, and new water supply pipes 2025. The kitchen and both bathrooms have also be updated. Community has a gazebo with tables and benches for outdoor events and a community pool. Great location is situated just 2 blocks to the beach and close to shopping, restaurants, and bars. The interior of the property needs some TLC but many large price items already done. No rentals 1st year of ownership. Don't miss your opportunity to live the beach life!
Key facts
- New hot water heater
- Updated bathrooms
- Updated kitchen
Tags
Property features AI
Finance
- HOA & community: Community association (Town House Estates); Monthly association fee of $195 covering grounds maintenance
Exterior
- Parking: Attached 2-car garage
- Utilities: Public sewer; Cable available; Electricity available; Water available; Sewer and water connected
- Home design: Townhouse; Two levels; Entry level is 1
- Construction: Built with block, frame, and vinyl siding; Shingle roof; Pets allowed
- Exterior features: Glass-enclosed patio; Rear porch; Faces south; City street frontage; Asphalt road surface
Interior
- Kitchen: Dishwasher; Electric oven; Electric range; Microwave; Refrigerator; Electric water heater
- Bedrooms: 3 bedrooms (some located on upper level)
- Flooring: Carpet; Tile
- Bathrooms: 2 full bathrooms
- Heating & cooling: Central heating (electric); Central air conditioning (electric)
- Interior features: Kitchen island; Pantry; Primary bathroom has a shower (no tub)
- Laundry & utility: Washer hookup; Electric dryer hookup; Laundry area in garage (lower level)
Neighborhood map
What this means for you Summary
Snapshot
- This is a 3-bed/2.0-bath townhouse listed at $260k.
Deal economics
- At list price, monthly cash flow is $1k ($14k/yr) — positive.
- The deal already cash-flows at list — no discount required.
- Meets the 1% rule at list price ($4k rent vs $260k).
Location & tenants
- Location reads 84/100 on livability (#37 in FL, #722 nationally) — a professional / high-income tenant draw. Strengths: crime A+, housing A+, health & safety A+; Watch: cost of living C-, amenities F.
- Brevard (suburban): math 53% / reading 57% proficiency, ranked #19 of 73 in FL (top 26%) — acceptable for families but not a draw, mixed tenant base, ~2y average lease.
- Zoned schools: Ocean Breeze Elementary School (math 73% / reading 77%, grade A, #218 of 2,144 statewide, top 11%, 554 students, 25% FRL); Herbert C. Hoover Middle School (math 67% / reading 64%, grade A-, #95 of 571 statewide, top 17%, 506 students, 38% FRL); Satellite Senior High School (math 65% / reading 71%, grade B, #66 of 667 statewide, top 10%, 1,517 students, 20% FRL).
- Zoned-school proficiency averages 70% at this address vs 55% district-wide (+14 pts) — the actual schools serving this property are materially stronger than the Brevard average implies; a family-tenant draw the district grade alone would hide.
- Market conditions: Rents rising (+1.6%/yr); 312 active listings in the ZIP; 29 comparable units currently listed for rent nearby; rentals at typical pace (median 25d on market — plan ~3-4 weeks tenant-placement turnaround); solid renter incomes; 4,602 units permitted in Brevard County in 2024 (702 in 5+ unit buildings).
- This rent runs 45% of the median local income ($101k/yr) — at the standard rent-burdened threshold; future hikes will face affordability resistance.
Forward outlook
- Local home prices are declining (-3.0%/yr); year-one equity from $2k of loan paydown is wiped out by about $8k of value loss. Plan a longer hold.
- Brevard County population projected at +15% by 2050 — modest demand growth; plan on rents tracking national, not racing it.
- At projected returns (-3.0% appreciation + 1.6% rent growth), your $73k cash investment doubles in ~7 years — after that, you're playing with house money.
Negotiation context
- Only 3 days on market — expect competitive offers; lowballing is unlikely to land.
- Current owner paid $82k; list at $260k implies a 217% gain — meaningful room to come down on a strong offer.
Risks & watch-outs
- Climate carrying-cost: major flood risk; severe wind risk, 99% chance of damaging wind over 30y; extreme-heat days projected 7→23/yr by 2055 (HVAC capex compounding) — expect insurance premiums to compound above CPI over the hold.
Questions for the listing agent
- Built in 1971 — when were the roof, HVAC, electrical panel, plumbing, and water heater last replaced?
- What does the HOA fee cover, when was the last increase, and are there any pending special assessments or reserve-fund shortfalls?
- Is there a deadline driving the sale (1031 exchange, divorce, estate, relocation)? That informs how much negotiation room exists.
- Schools are A-rated — typically a magnet for longer-tenancy family renters. What's the average tenant stay here, and is there a school-zone premium baked into asking?
- What's the average days-on-market for RENTAL listings here right now (not sales)? A rising rental-DOM trend means longer vacancies and softer asking-rent achievability than the comps imply.
- What's the recent tenant-quality profile in this submarket — average credit score on applications, eviction rate, late-payment / NSF rate, and stable-employment percentage? A property-management company in the area should have these aggregated.
- How much new for-sale + rental construction is in the pipeline within 1–3 miles? Heavy new supply typically softens prices + rents 12–24 months out; constrained supply supports both.
Investment metrics
- 1% rule
- 1.45% ✓
- Cap rate
- 11.77%
- Cash-on-cash
- 19.58%
- DSCR
- 1.87
- GRM
- 5.7
CMA / ARV
No comps found within radius.
Projected returns pro-forma
-3.0% appreciation · 1.55% rent growth · sell at horizon
- IRR
- 10.0%
- Equity multiple
- 1.39×
- Total profit
- $28,126
- Equity at exit
- $38,752
- IRR
- 17.9%
- Equity multiple
- 2.38×
- Total profit
- $100,464
- Equity at exit
- $22,471
Cash invested: $72,772 (down + closing). Projections, not guarantees.
Landlord ↔ Tenant lean methodology
- Overall (STATE)
- 87 Strongly Landlord-Friendly
- State Florida
- 87 Strongly Landlord-Friendly · R+3
- County
- — inherits STATE
- City
- — inherits STATE
ZIP-level market 32937
- Rents YoY
- 1.6%
- Active inventory
- 312
- Price-to-rent
- 5.7×
Monthly cashflow live
- Estimated rent
- $3,768 high interval (Pro) →
- Mortgage (P&I)
- −$1,363
- Tax from tax record
- −$124 /mo · $1,485/yr
- Insurance
- −$108
- HOA
- −$195
- Vacancy / Maint / Mgmt
- −$791
- Net cashflow
- $1,187
Break-even live
Sensitivity live
| Price | -10% $1,334 | -5% $1,261 | +0% $1,187 | +5% $1,114 | +10% $1,040 |
|---|---|---|---|---|---|
| Rent | -10% $889 | -5% $1,038 | +0% $1,187 | +5% $1,336 | +10% $1,485 |
| Rate | -1.0pp $1,318 | -0.5pp $1,253 | base $1,187 | +0.5pp $1,120 | +1.0pp $1,051 |
UW: 25.0% down · 7.5% · 30yr · 1.5% tax · 5.0% vac · 8.0% maint · 8.0% mgmt
Financing live
Cash to close
- Down payment
- $64,975
- Closing costs
- $7,797
- Reserves months
- —
- Total cash needed
- —
Loan-product check · same deal, 3 products live
Conventional
25% down · 7.5% · 30yr
- Down + closing
- —
- Monthly P&I
- —
- Monthly cashflow
- —
- DSCR
- —
- Eligible?
- —
Personal DTI + credit; lowest rate.
DSCR
20% down · 8.5% · 30yr
- Down + closing
- —
- Monthly P&I
- —
- Monthly cashflow
- —
- DSCR
- —
- Eligible?
- —
No personal income docs; deal must DSCR.
Hard money
10% down · 12.0% · 12mo
- Down + closing
- —
- Monthly P&I
- —
- Monthly cashflow
- —
- DSCR
- —
- Eligible?
- —
Short-term bridge; refi at stabilization.
Rent comps 29 comps
| Address | Beds | Baths | Sqft | Rent | $/sqft | DOM | Units | Dist |
|---|---|---|---|---|---|---|---|---|
| 115 Lancha Cir #204 Satellite Beach, FL | 3.0 | 2.0 | 2116 | $2,700 | $1.28 | 15d | 1 | 0.19mi |
| 1109 Seminole Dr Unit 1464868P Satellite Beach, FL | 4.0 | 2.0 | 1872 | $6,688 | $3.57 | 15d | 1 | 0.28mi |
| 215 Marion St Indian Harbour Beach, FL | 4.0 | 2.0 | 2105 | $3,500 | $1.66 | 15d | 1 | 0.35mi |
| 1811 Highway A1A #2104 Indian Harbour Beach, FL | 3.0 | 2.0 | 1720 | $3,200 | $1.86 | 24d | 1 | 0.48mi |
| 1791 Jimmy Buffett Memorial Hwy Unit 1103 Indian Harbour Beach, FL | 3.0 | 2.0 | 1720 | $4,400 | $2.56 | 24d | 1 | 0.48mi |
| 1175 Bay Dr E Indian Harbour Beach, FL | 4.0 | 2.0 | 1650 | $3,700 | $2.24 | 24d | 1 | 0.49mi |
| 265 Marion St Indian Harbour Beach, FL | 4.0 | 2.0 | 1724 | $5,500 | $3.19 | 24d | 1 | 0.49mi |
| 128 Martin St Unit 1250956P Satellite Beach, FL | 3.0 | 2.0 | 1453 | $5,409 | $3.72 | 20d | 1 | 0.49mi |
| 231 Shore Ln Indian Harbour Beach, FL | 3.0 | 2.0 | 1640 | $3,200 | $1.95 | 24d | 1 | 0.50mi |
| 799 Shell St Satellite Beach, FL | 3.0 | 2.5 | 1248 | $3,950 | $3.17 | 24d | 1 | 0.52mi |
| 157 Kristi Dr Indian Harbour Beach, FL | 2.0 | 2.5 | 1296 | $2,500 | $1.93 | 24d | 1 | 0.58mi |
| 1017 Steven Patrick Ave Indian Harbour Beach, FL | 3.0 | 3.5 | 2193 | $3,300 | $1.50 | 24d | 1 | 0.72mi |
| 39 Anchor Dr Indian Harbour Beach, FL | 2.0 | 2.0 | 1304 | $2,395 | $1.84 | 24d | 1 | 0.77mi |
| 658 Atlantic Dr Satellite Beach, FL | 2.0 | 2.5 | 1470 | $2,200 | $1.50 | 24d | 1 | 0.79mi |
| 2225 Highway A1A #311 Indian Harbour Beach, FL | 2.0 | 2.0 | 1361 | $3,800 | $2.79 | 24d | 1 | 0.81mi |
| 2225 Highway A1A Indian Harbour Beach, FL | 2.0 | 1.0–2.0 | 1187 | $3,400 | $2.86 | 24d | 2 | 0.81mi |
| 230 Robert Ct Satellite Beach, FL | 3.0 | 2.0 | 2000 | $4,000 | $2.00 | 24d | 1 | 0.81mi |
| 100 Bel Aire Dr Indian Harbour Beach, FL | 4.0 | 2.0 | 1634 | $4,500 | $2.75 | 24d | 1 | 0.82mi |
| 2130 S Patrick Dr Satellite Beach, FL | 4.0 | 2.0 | 1975 | $2,750 | $1.39 | 15d | 1 | 0.90mi |
| 1874 Brittany Dr Melbourne, FL | 2.0–3.0 | 1.0–2.0 | 1286 | $1,990 | $1.55 | 15d | 12 | 0.93mi |
| 589 Coconut St Unit 1546106P Satellite Beach, FL | 4.0 | 2.0 | 2142 | $6,451 | $3.01 | 15d | 1 | 0.98mi |
| 360 Desoto Pkwy Satellite Beach, FL | 3.0 | 2.0 | 1679 | $3,200 | $1.91 | 24d | 1 | 1.09mi |
| 3699 Poseidon Way Indialantic, FL | 4.0 | 3.0 | 2415 | $3,995 | $1.65 | 15d | 1 | 1.18mi |
| 571 Kale St Satellite Beach, FL | 4.0 | 2.0 | 1976 | $3,700 | $1.87 | 24d | 1 | 1.19mi |
| 408 Hawthorne Ct Indian Harbour Beach, FL | 3.0 | 2.0 | 1367 | $2,295 | $1.68 | 24d | 1 | 1.39mi |
| 125 Kings Way Satellite Beach, FL | 2.0 | 2.5 | 1530 | $2,500 | $1.63 | 24d | 1 | 1.43mi |
| 159 Queens Ct Satellite Beach, FL | 2.0 | 2.0 | 1450 | $2,850 | $1.97 | 24d | 1 | 1.44mi |
| 440 Hawthorne Ct Indian Harbour Beach, FL | 2.0 | 2.0 | 1300 | $2,299 | $1.77 | 24d | 1 | 1.47mi |
| 265 Kings Way Satellite Beach, FL | 2.0 | 2.5 | 1530 | $2,395 | $1.57 | 24d | 1 | 1.48mi |
HOA detail
- Monthly dues
- $195 · $2,340/yr
- Likely covers
- waterpool
Listing history 4 events
-
2026-05-15status Pending
-
2026-05-12$259,900 Active
-
1985-06-01soldstatus $82,000
-
1981-12-01soldstatus $78,000
ⓘ Source: listings_history table (triggers on properties + properties_extension) + one-shot
backfill from property_details.listing_events for pre-trigger history.
Tax reassessment forecast FL · Resets to sale price
- Current annual tax
- $1,485 · $124/mo
- Projected year-2 tax
- $2,157 · $180/mo
- Expected delta
- +$672/yr (+$56/mo · 45.3%)
ⓘ Screening estimate from a state-policy table — verify with the county assessor before closing.
Climate risk First Street
- Flood 6/10 Major FEMA zone X (unshaded) · 53% chance over 30 yrs
- Wildfire 1/10 Low
- Heat 10/10 Extreme 7 d/yr ≥103°F today · 23 d/yr by 30 yrs out
- Wind 10/10 Extreme 99% chance of damaging wind over 30 yrs
- Air quality 1/10 Low 0 unhealthy d/yr today · 0 by 30 yrs out
Nearby sold comps map
Loading sold comps map…
Walkable amenities ~0.75 mi
Loading nearby amenities…
Taxation est. · year 1
- Rental income
- $45,222
- − Mortgage interest
- −$14,558
- − Property taxes
- −$1,485
- − Insurance
- −$1,300
- − Repairs & maintenance
- −$3,618
- − Management
- −$3,618
- − HOA
- −$2,340
- − Depreciation
- −$7,561
- Taxable income
- $10,743
- Est. tax owed @ 24.0%
- −$2,578
- After-tax cash flow
- $11,667/yr
For passive investors: Depreciation is non-cash, so a rental often shows a tax loss while cash-flowing — sheltering income. Rental losses are passive: they offset passive income freely, and up to $25,000/yr can offset ordinary (W-2) income if you actively participate and your MAGI is under $100k (phasing out to $0 by $150k); unused losses carry forward. On sale, claimed depreciation is recaptured at up to 25%, and gains may owe capital-gains tax (a 1031 exchange can defer both). Figures are a year-1 estimate at your 24.0% rate — not tax advice; consult a CPA.
Schools (NCES district)
- District
- Brevard
- NCES district ID
- 1200150
- Math proficiency
- 53% ▼ -9.00%
- Reading proficiency
- 57% ▼ -4.00%
- Median HH income
- $49,426
- Composite
- 46.86/100
- National rank
- #2370
- State rank
- #19 of 73 in FL
Livability — Indian Harbour Beach
- Score
- 84/100
- State rank
- #37
- US rank
- #722
Category grades
Schools grade is shown separately in the Schools card above.
Census & demographics
- Census place
- Indian Harbour Beach, FL
- County
- Brevard County · 602,871 people
- Metro
- Palm Bay-Melbourne-Titusville, FL
- Population (ZIP)
- 27,836
- Household income
- $101,184
- Rent vs Own
- Severe rent burden
- 534.0
Population outlook (Brevard County) Hauer SSP2
- Today (2025)
- 623,254 people
- By 2030
- 648,420 · +4.0%
- By 2040
- 690,009 · +10.7%
- By 2050
- 715,669 · +14.8%
- By 2075
- 775,744 · +24.5%
- By 2100
- 776,687 · +24.6%
Race, ethnicity, and origin ACS 2023
- Neighborhood character
- Predominantly White (82%)
- Race & ethnicity
- White 82% Hispanic / Latino 9% Two or more races 7% Asian 2% Black 1%
- Hispanic origin (detail)
- Mexican 1% Puerto Rican 2%
- Common ancestry
- Romanian 3% Lithuanian 3% Italian 2%
- Foreign-born
- 4% · Canada
- Languages at home
- 95% English-only · Spanish 3% Other Indo-European 1%
Political lean MEDSL · Brevard
- 2024 margin
- Strong R (+20.8) · D 39.1% · R 59.9% · Other 1.0%
- 2008→2024 swing
- -10.4pp toward R · 2008: -10.4pp · 2024: -20.8pp
- All cycles
- 2024: R+20.8 2020: R+16.4 2016: R+19.8 2012: R+12.7 2008: R+10.4
Not yet ingested
- Civics
- —
Market trends
- HPI YoY
- ▼ -336.76%
- Current HPI
- 361.3801
- Rent YoY
- ▲ 1.55%
- Metro
- Palm Bay-Melbourne-Titusville, FL
- State GDP YoY
- ▲ 3.28%
- F500 in state
- 36
Industry mix (Fortune 500 HQ in FL)
| Industry | F500 HQs | Revenue |
|---|---|---|
| Industrial Technology | 2 | $29B |
|
||
| Insurance | 2 | $17B |
|
||
| Retail | 1 | $60B |
|
||
| Technology Distribution | 1 | $58B |
|
||
| Homebuilding | 1 | $35B |
|
||
| Technology Manufacturing | 1 | $35B |
|
||
Price history
+233.2% since first listed4 events — show timeline
- 2026-05-15 Pending — SCMLS
- 2026-05-12 Listed $259,900 SCMLS
- 1985-06-01 Sold (Public Records) $82,000 Public Records
- 1981-12-01 Sold (Public Records) $78,000 Public Records
Property tax history
+1.5%/yrLatest (2025): $1,485 · +4.3% YoY. Source: county tax records.
Cash-flow waterfall
monthlySold comps — $/sqft
last 12 mo · ≤1 miLoading sold comps…